


Estimating the risk of manic relapse could help the psychiatrist individually adjust the treatment to the risk. Some authors have attempted to estimate this risk from baseline clinical data. Still, no studies have assessed whether the estimation could improve by adding structural magnetic resonance imaging (MRI) data. We aimed to evaluate it.
Material and methodsWe followed a cohort of 78 patients with a manic episode without mixed symptoms (bipolar type I or schizoaffective disorder) at 2–4–6–9–12–15–18 months and up to 10 years. Within a cross-validation scheme, we created and evaluated a Cox lasso model to estimate the risk of manic relapse using both clinical and MRI data.
ResultsThe model successfully estimated the risk of manic relapse (Cox regression of the time to relapse as a function of the estimated risk: hazard ratio (HR)=2.35, p=0.027; area under the curve (AUC)=0.65, expected calibration error (ECE)<0.2). The most relevant variables included in the model were the diagnosis of schizoaffective disorder, poor impulse control, unusual thought content, and cerebellum volume decrease. The estimations were poorer when we used clinical or MRI data separately.
ConclusionCombining clinical and MRI data may improve the risk of manic relapse estimation after a manic episode. We provide a website that estimates the risk according to the model to facilitate replication by independent groups before translation to clinical settings.
Manic episodes are characterized by an abnormally elevated, expansive, or irritable mood accompanied by symptoms such as poor judgment that may lead to significant problems with relationships, job/school performance, and other life domains. Today we have treatments that efficaciously decrease the risk of manic relapse. Still, they have potentially relevant side effects such as renal failure or liver toxicity.1 Therefore, to effectively improve the patients’ overall health, we probably should increase the strength of the treatment when the risk of manic relapse is high while decreasing it when it is low. Thus, we should individually balance the benefit of potentially prevented episodes with the cost of potential side effects. However, this “precision psychiatry” approach2,3 requires reliably estimating the risk of manic relapse. Some authors have reported several clinical variables associated with increased manic relapse risk, such as the number of manic episodes, residual manic symptoms, cognitive deficits, or comorbidities.4–10 We could potentially improve the estimation of manic relapse by adding data from structural magnetic resonance imaging (MRI). Still, to our knowledge, this strategy has not been published. Conversely, several studies have applied machine learning to predict whether an MRI scan is from an individual diagnosed with bipolar disorder or healthy control.11,12 These studies convey moderate optimism. They usually report that the algorithm guessed the diagnosis more than chance but less than 100%. This gray zone means MRI-based machine-learning algorithms do better than tossing a coin.13,14 Still, they are far from pathognomonic biomarkers.
With these considerations in mind, we conceived of creating a biosignature combining clinical- and MRI-based risk-estimation model that could aid the clinician in cases of doubt. Indeed, some groups have recently reported great clinical-based models to estimate the risk of a manic episode.15–17 For example, Birmaher et al. built a calculator to predict recurrence risk in recovered BD youths/young adults from the COBY study.15 Their calculator predicted manic relapses with excellent/outstanding accuracy (area under the curve, AUC=0.89) and good calibration (observed and predicted risks were similar). When removed from the model, the risk factors associated with larger AUC decrements were a younger age at disorder onset, a history of episodes with mainly hypo/manic symptoms, shorter recoveries from previous episodes, and a younger age. The same group later validated the calculator with adults from the CDS study.16 The calculator underestimated the risk by around 0.20, though there was no internal miscalibration and the accuracy was lower but still acceptable (AUC=0.72). With a related but different aim, Pradier et al. created models to predict the conversion to bipolar disorder in individuals with depressive disorders receiving antidepressants achieving an acceptable accuracy (AUC=0.76) and calibration.17 The most relevant clinical factors were gender, psychotic symptoms, and suicidal ideation.
We wondered whether incorporating MRI data could further improve such models. To this end, we asked individuals with a manic episode to be scanned and followed up until a manic relapse. Afterward, we fitted a machine learning model to estimate the risk of manic relapse from baseline clinical and MRI data. Finally, we evaluated the accuracy of the risk estimations using an unbiased cross-validation approach. Our overarching goal was to create a risk-estimation model to guide the clinician in choosing optimal therapeutic strategies and adjusting admission needs. For example, the clinician could follow patients with a high estimated risk of relapse more frequently, make admissions last longer, and adjust the strength of the treatment accordingly.
Materials and methodsThis study complies with the Transparent Reporting of a multivariable prediction model for Individual Prognosis or Diagnosis (TRIPOD, see checklist in the Supplement).
ParticipantsWe included 78 individuals with a current manic episode without mixed symptoms recruited from the Hospital Benito Menni, Hospital General de Granollers, Hospital Sant Rafael, and Hospital del Sagrat Cor, Barcelona. We were interested in manic relapses in general, transdiagnostically. Thus we included individuals with either bipolar disorder type I or schizoaffective disorder. Inclusion criteria were (a) current manic episode according to DSM-IV diagnostic criteria; (b) age 18–65 years; and (c) right-handedness. Exclusion criteria were: (a) hypomanic episode; (b) Young Mania Rating Scale (YMRS)18<18 to ensure discarding hypomania; (c) Hamilton Depression Rating Scale (HDRS)19>8 to ensure discarding mixed episodes; (d) history of traumatic brain injury; (e) severe neurological disease; (f) premorbid intelligence quotient (IQ) <70; (g) contraindications to MRI (e.g., metallic implants); and (h) severe substance dependence during the previous six months.
The authors assert that all procedures contributing to this work comply with the ethical standards of the relevant national and institutional committees on human experimentation and with the Helsinki Declaration of 1975, as revised in 2008. All procedures involving human subjects/patients were approved by the Clinical Research Ethics Committee of Germanes Hospitalàries del Sagrat Cor de Jesús, Barcelona (approval number PR-2014-19). All participants gave written informed consent before participation. Healthy controls received a gift card as compensation for their participation in the study.
Collection of dataWe detail the collection of baseline clinical and structural MRI data and the standard preprocessing of the latter with SPM12 (Wellcome Trust Center for Neuroimaging, London, UK) in the Supplement. Mainly, experienced psychiatrists confirmed the manic episode diagnosis and administered the YMRS, HDRS, and Positive and Negative Syndrome Scale (PANSS).20
Follow-up visits were at 2, 4, 6, 9, 12, 15, and 18 months after the MRI scanning session. In case of relapse between two visits, the psychiatrist wrote the approximate date of relapse. If there were no relapses before study termination (at 18 months or earlier in case of loss to follow-up or depressive episode), we saved the date of the last visit. For 30 patients, we could determine relapses (or their absence) during an extended period after 18 months up to 10.6 years without ambiguities. We discarded the follow-up information for that extended period whenever doubts existed.
Univariate predictors of relapseWe first conducted simple Cox proportional hazards regressions for descriptive purposes to find baseline clinical conditions associated with manic relapse. The dependent variable was the time from the remission of the current manic episode to the first manic relapse (or the last visit for patients with no registered relapse). The independent variable was the clinical variable or voxel volume. In the case of voxel volumes, we first removed the effects of age and sex from the gray and white matter volumes using linear models. We included the whole brain; we did not pre-plan selecting some brain regions or anatomical targets. For clinical variables, we used p<0.05, and for voxel volumes, p<0.005.21 We did not correct this analysis for multiple comparisons because of its sole descriptive purpose.
We created a user-friendly script for R for this analysis based on the “survival” package.22 We provide this script in the Supplement to allow other groups to conduct these analyses.
Creation of the risk estimation modelAs we detail later, we created the risk estimation models exclusively using the data from the training set. The clinical data included age, sex, premorbid IQ, age at onset, age at first admission, illness duration, diagnosis of schizoaffective disorder (vs. bipolar disorder type I), lithium, antipsychotic dosage (chlorpromazine equivalents), and clinical symptoms based on YMRS/HDRS/PANSS items (plus total scores). The MRI data included the modulated and unmodulated gray and white matter images because we have found elsewhere that segments convey complementary volumetric information, and their combination increases the accuracy.23,24 Again, we included the whole brain; we did not pre-plan selecting some brain regions or anatomical targets.
First, we used “lasso” regressions to impute the missing values twenty times.25 Second, we removed the effects of the MRI device with ComBat.26 This tool has been reported to improve simpler methods27,28 and avoid most biases for simple machine-learning models such as lasso.29 Third, we removed the effects of age and sex from the MRI images using linear models. Finally, we fitted a multiple “lasso” Cox regression. The dependent variable was the time to the first manic relapse (i.e., one measure per participant), and the independent variables were the clinical and MRI data. We conducted 18 lasso regressions, each with the voxels of half brain (resulting from dividing the brain in two by planes at 0° or 45° of the anatomical planes). Afterward, we combined the regressions. We have found elsewhere that this ensemble approach substantially increases the accuracy.24
We conducted all analyses with our freely available graphical software MRI Predict (https://www.mripredict.com/).
Validation of the risk estimation modelWe used a cross-validation approach to assess the accuracy of the estimations in new individuals. To guarantee that the cross-validation-derived performance was unbiased, we conducted all preprocessing and modeling operations exclusively using one subset of patients (the “training set”) and afterward estimated the hazard ratio (HR) of the other patients (the independent “test set”). HR>1 means increased, and HR<1 means decreased relapse risk.
Specifically, we divided the overall cohort into ten groups or “folds”. For the first fold, we used individuals from folds 2–10 for the training set and individuals from fold 1 for the test set. For the second fold, we used individuals from folds 1 and 3–10 for the training set and individuals from fold 2 for the test set. And so on. With this strategy, we could estimate all individuals’ HRs. Still, we never used the same individuals for training and validating a model, ensuring the unbiasedness of the scheme.
To assess the accuracy of the estimations, we tested whether the estimated manic relapse risk was associated with a higher relapse hazard. Specifically, we fitted a mixed-effects Cox proportional hazards regression model with the “multisite.accuracy” package for R, in turn, based on the “coxme” package.30,31 The dependent variable was the time to the first manic relapse, the independent variable was the logarithm of the estimated HR, and the MRI device was a random-effects factor. We used the multisite.accuracy version (instead of simpler Cox models) to avoid biases due to combining patients scanned with different MRI devices.29,30 We tested the Cox proportional hazard assumption with the “cox.zph” function.22
We also assessed the discrimination accuracy and calibration32 at different follow-up times (every six months until ten years). To assess discrimination, we calculated the multisite version of the area under the curve (AUC) at each follow-up time with the “multisite.accuracy” package30 for R (based on the “AROC” package33). The AUC provides an aggregate measure of sensitivity/specificity across all possible classification thresholds. For instance, we could define individuals with an estimated HR>1 as having a high risk of relapse. Using this classification threshold, we could calculate the sensitivity and specificity of the detection of relapses at a 3-year follow-up. However, we could also use other thresholds, such as HR>1.1, HR>1.2, and so long. The AUC represents the aggregation of the sensitivities and specificities at all thresholds. An AUC=50% means that the classification is as good as tossing a coin, while an AUC=100% means that the classification is perfect. We used the multisite.accuracy version (instead of simpler AUC) to avoid biases due to combining patients scanned with different devices.29,30 On the other hand, to assess calibration, we calculated the expected calibration error (ECE) using the “CalibratR” package for R34 (though we modified the function to conduct the calculations separately for each site). The ECE compares the probabilities of relapse derived from the model with the observed probabilities. To obtain the former, we first converted the logarithms of the HR of the (cross-validation) training set to probabilities using the normal function, we calibrated them using isotonic regression calibration with the “rfUtilities” package for R,35 and finally interpolated the calibration estimated with training test to the test set. To calculate the ECE, we divided the patients into bins (the first bin including the patients with lowest estimated probabilities and the last bin including those with the highest, separately for sites). Afterward, for each bin, we subtracted the average estimated probability and the observed probability (proportion of relapses). Finally, we averaged the absolute errors from the different bins. We tried to create ten equal-sized bins for each MRI device, as long as each bin had at least 5 patients. We conducted weighted averages to account for differences in bin sizes.
To assess whether the models’ risk estimation accuracy was mainly related to MRI or clinical data, we also created models exclusively based on these variables separately.
Relevance of the models’ variablesTo assess the relevance of the model's variables, we calculated the relative absolute coefficients (rβ) based on the “lares” R package.36 Specifically, we calculated the absolute value of each coefficient and divided it by the sum of the absolute values of all model's coefficients. We repeated this operation separately for each model and then averaged across models.
Model sharing for other groupsWe encourage independent groups to replicate our model's accuracy assessment. To help them, we provide a simplified website-based version of the tool (https://www.mripredict.com/mania/) that quickly estimates the manic relapse risk of an individual. For the website, we fitted a model using the whole cohort and selected the coefficients with an absolute value≥0.05 (see Supplement).
ResultsTable 1 describes the cohort, in which we registered 25 manic relapses during the follow-up. Among the individuals without documented manic relapse, 21 had a depressive episode, eight were lost to follow-up, and 24 had not had any relapse at the termination of the study. While the sample size and the number of manic relapses might seem limited, a power analysis with the R package “powerSurvEpi”37 showed that these data would yield 80% statistical power to detect HR≥2.97 and 90% statistical power to detect HR≥3.54 between two groups.
Characteristics of the cohort.
| All patients | Patients with a manic relapse | Pa | |
|---|---|---|---|
| Sample size | 78 | 25 | – |
| Mean age in years (SD) | 40.5 (12.9) | 37.2 (14) | n.s. |
| Females (%) | 51.3% | 40% | n.s. |
| Premorbid IQb | 100.8 (9.9) | 100.4 (9.5) | n.s. |
| Mean age at onset in years (SD) | 27.5 (11.1) | 22.7 (8.4) | 0.008 |
| Mean age at first admission in years (SD) | 31.4 (14) | 25.1 (9.8) | 0.022 |
| Mean duration of illness in years (SD) | 13.3 (11.7) | 15 (14) | n.s. |
| Schizoaffective disorder (%) | 6.4% | 16% | 0.046 |
| Manic symptoms (YMRS) (SD) | 22.4 (4.1) | 22.8 (4) | n.s. |
| Depressive symptoms (HDRS) (SD) | 2.9 (2.8) | 3.1 (2.5) | n.s. |
| Psychotic (and other) symptoms (PANSS) (SD) | |||
| Total score (SD) | 48.8 (10.2) | 49.1 (7.5) | n.s. |
| Positive scale (SD) | 17 (5.5) | 18 (5.5) | n.s. |
| Negative scale (SD) | 8.4 (2.1) | 8.2 (1.8) | n.s. |
| General psychopathology scale (SD) | 23.8 (5.5) | 23.9 (4.2) | n.s. |
| Lithium (%) – mean (SD) | 70.5% – 593 (497) | 75.0% – 684 (463) | n.s. |
| Chlorpromazine equivalents (SD) | 568 (378) | 589 (350) | n.s. |
HDRS: Hamilton Rating Scale for Depression; IQ: intelligence quotient; MRI: magnetic resonance imaging; PANSS: Positive and Negative Syndrome Scale; SD: standard deviation; YMRS: Young Mania Rating Scale.
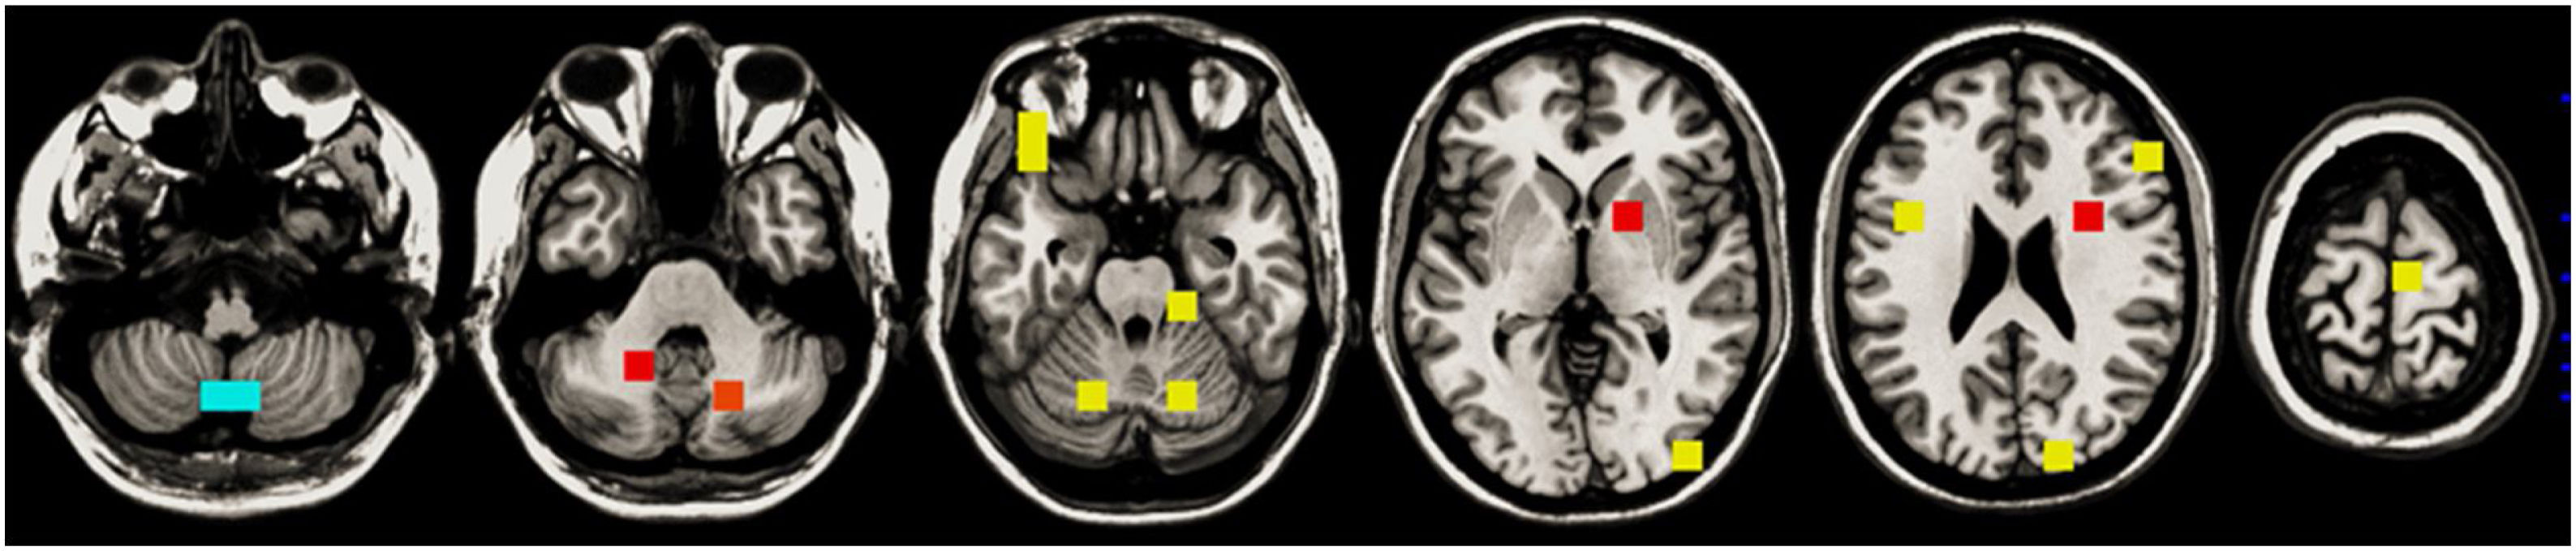
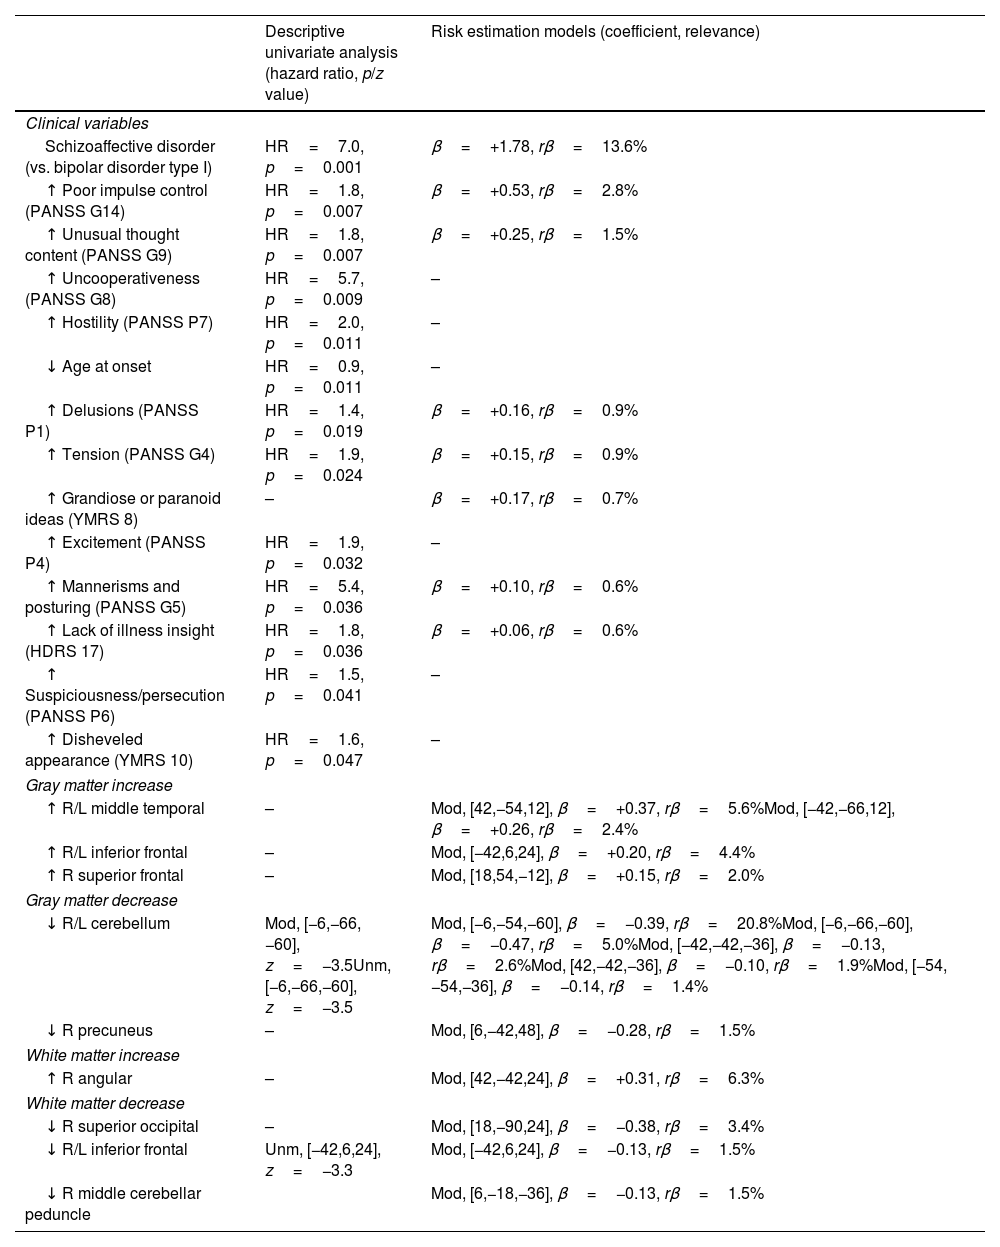
The descriptive univariate analysis showed that patients diagnosed with schizoaffective disorder, with specific clinical symptoms (mainly poor impulse control and unusual thought content), a younger age of onset, or decreases in the cerebellum or inferior frontal white matter had an increased risk of manic relapse (see Fig. 1 and Table 2 for details).
, gray matter decreases (cyan), and white matter decreases (yellow), associated with an increased risk of relapse after a manic episode (classical survival analysis). Axial slices at (MNI) Z=−48, −36, −24, 0, 24, and 72.")
Descriptive univariate analysis and risk estimation models of manic relapse.
| Descriptive univariate analysis (hazard ratio, p/z value) | Risk estimation models (coefficient, relevance) | |
|---|---|---|
| Clinical variables | ||
| Schizoaffective disorder (vs. bipolar disorder type I) | HR=7.0, p=0.001 | β=+1.78, rβ=13.6% |
| ↑ Poor impulse control (PANSS G14) | HR=1.8, p=0.007 | β=+0.53, rβ=2.8% |
| ↑ Unusual thought content (PANSS G9) | HR=1.8, p=0.007 | β=+0.25, rβ=1.5% |
| ↑ Uncooperativeness (PANSS G8) | HR=5.7, p=0.009 | – |
| ↑ Hostility (PANSS P7) | HR=2.0, p=0.011 | – |
| ↓ Age at onset | HR=0.9, p=0.011 | – |
| ↑ Delusions (PANSS P1) | HR=1.4, p=0.019 | β=+0.16, rβ=0.9% |
| ↑ Tension (PANSS G4) | HR=1.9, p=0.024 | β=+0.15, rβ=0.9% |
| ↑ Grandiose or paranoid ideas (YMRS 8) | – | β=+0.17, rβ=0.7% |
| ↑ Excitement (PANSS P4) | HR=1.9, p=0.032 | – |
| ↑ Mannerisms and posturing (PANSS G5) | HR=5.4, p=0.036 | β=+0.10, rβ=0.6% |
| ↑ Lack of illness insight (HDRS 17) | HR=1.8, p=0.036 | β=+0.06, rβ=0.6% |
| ↑ Suspiciousness/persecution (PANSS P6) | HR=1.5, p=0.041 | – |
| ↑ Disheveled appearance (YMRS 10) | HR=1.6, p=0.047 | – |
| Gray matter increase | ||
| ↑ R/L middle temporal | – | Mod, [42,−54,12], β=+0.37, rβ=5.6%Mod, [−42,−66,12], β=+0.26, rβ=2.4% |
| ↑ R/L inferior frontal | – | Mod, [−42,6,24], β=+0.20, rβ=4.4% |
| ↑ R superior frontal | – | Mod, [18,54,−12], β=+0.15, rβ=2.0% |
| Gray matter decrease | ||
| ↓ R/L cerebellum | Mod, [−6,−66,−60], z=−3.5Unm, [−6,−66,−60], z=−3.5 | Mod, [−6,−54,−60], β=−0.39, rβ=20.8%Mod, [−6,−66,−60], β=−0.47, rβ=5.0%Mod, [−42,−42,−36], β=−0.13, rβ=2.6%Mod, [42,−42,−36], β=−0.10, rβ=1.9%Mod, [−54,−54,−36], β=−0.14, rβ=1.4% |
| ↓ R precuneus | – | Mod, [6,−42,48], β=−0.28, rβ=1.5% |
| White matter increase | ||
| ↑ R angular | – | Mod, [42,−42,24], β=+0.31, rβ=6.3% |
| White matter decrease | ||
| ↓ R superior occipital | – | Mod, [18,−90,24], β=−0.38, rβ=3.4% |
| ↓ R/L inferior frontal | Unm, [−42,6,24], z=−3.3 | Mod, [−42,6,24], β=−0.13, rβ=1.5% |
| ↓ R middle cerebellar peduncle | Mod, [6,−18,−36], β=−0.13, rβ=1.5% | |
For the sake of simplicity, in the univariate analysis, we only show clinical variables with uncorrected p-value<0.05 and peaks of MRI clusters with voxel z-value>3.1; in the machine-learning analysis, we only show clinical variables with relevance (rβ)>0.5% and voxels with rβ>1%. See the entire model in the Supplement. HDRS: Hamilton Rating Scale for Depression; L: left; Mod: modulate; PANSS: Positive and Negative Syndrome Scale; R: right; Unm: unmodulated; YMRS: Young Mania Rating Scale.
The machine learning algorithm selected the schizoaffective disorder diagnostic label, a few symptoms (the most relevant of which were poor impulse control and unusual thought content), and several increases/decreases of gray and white matter modulated volume (the most relevant of which were the decreases of gray matter in the cerebellum). See Table 2 and Supplement for further details.
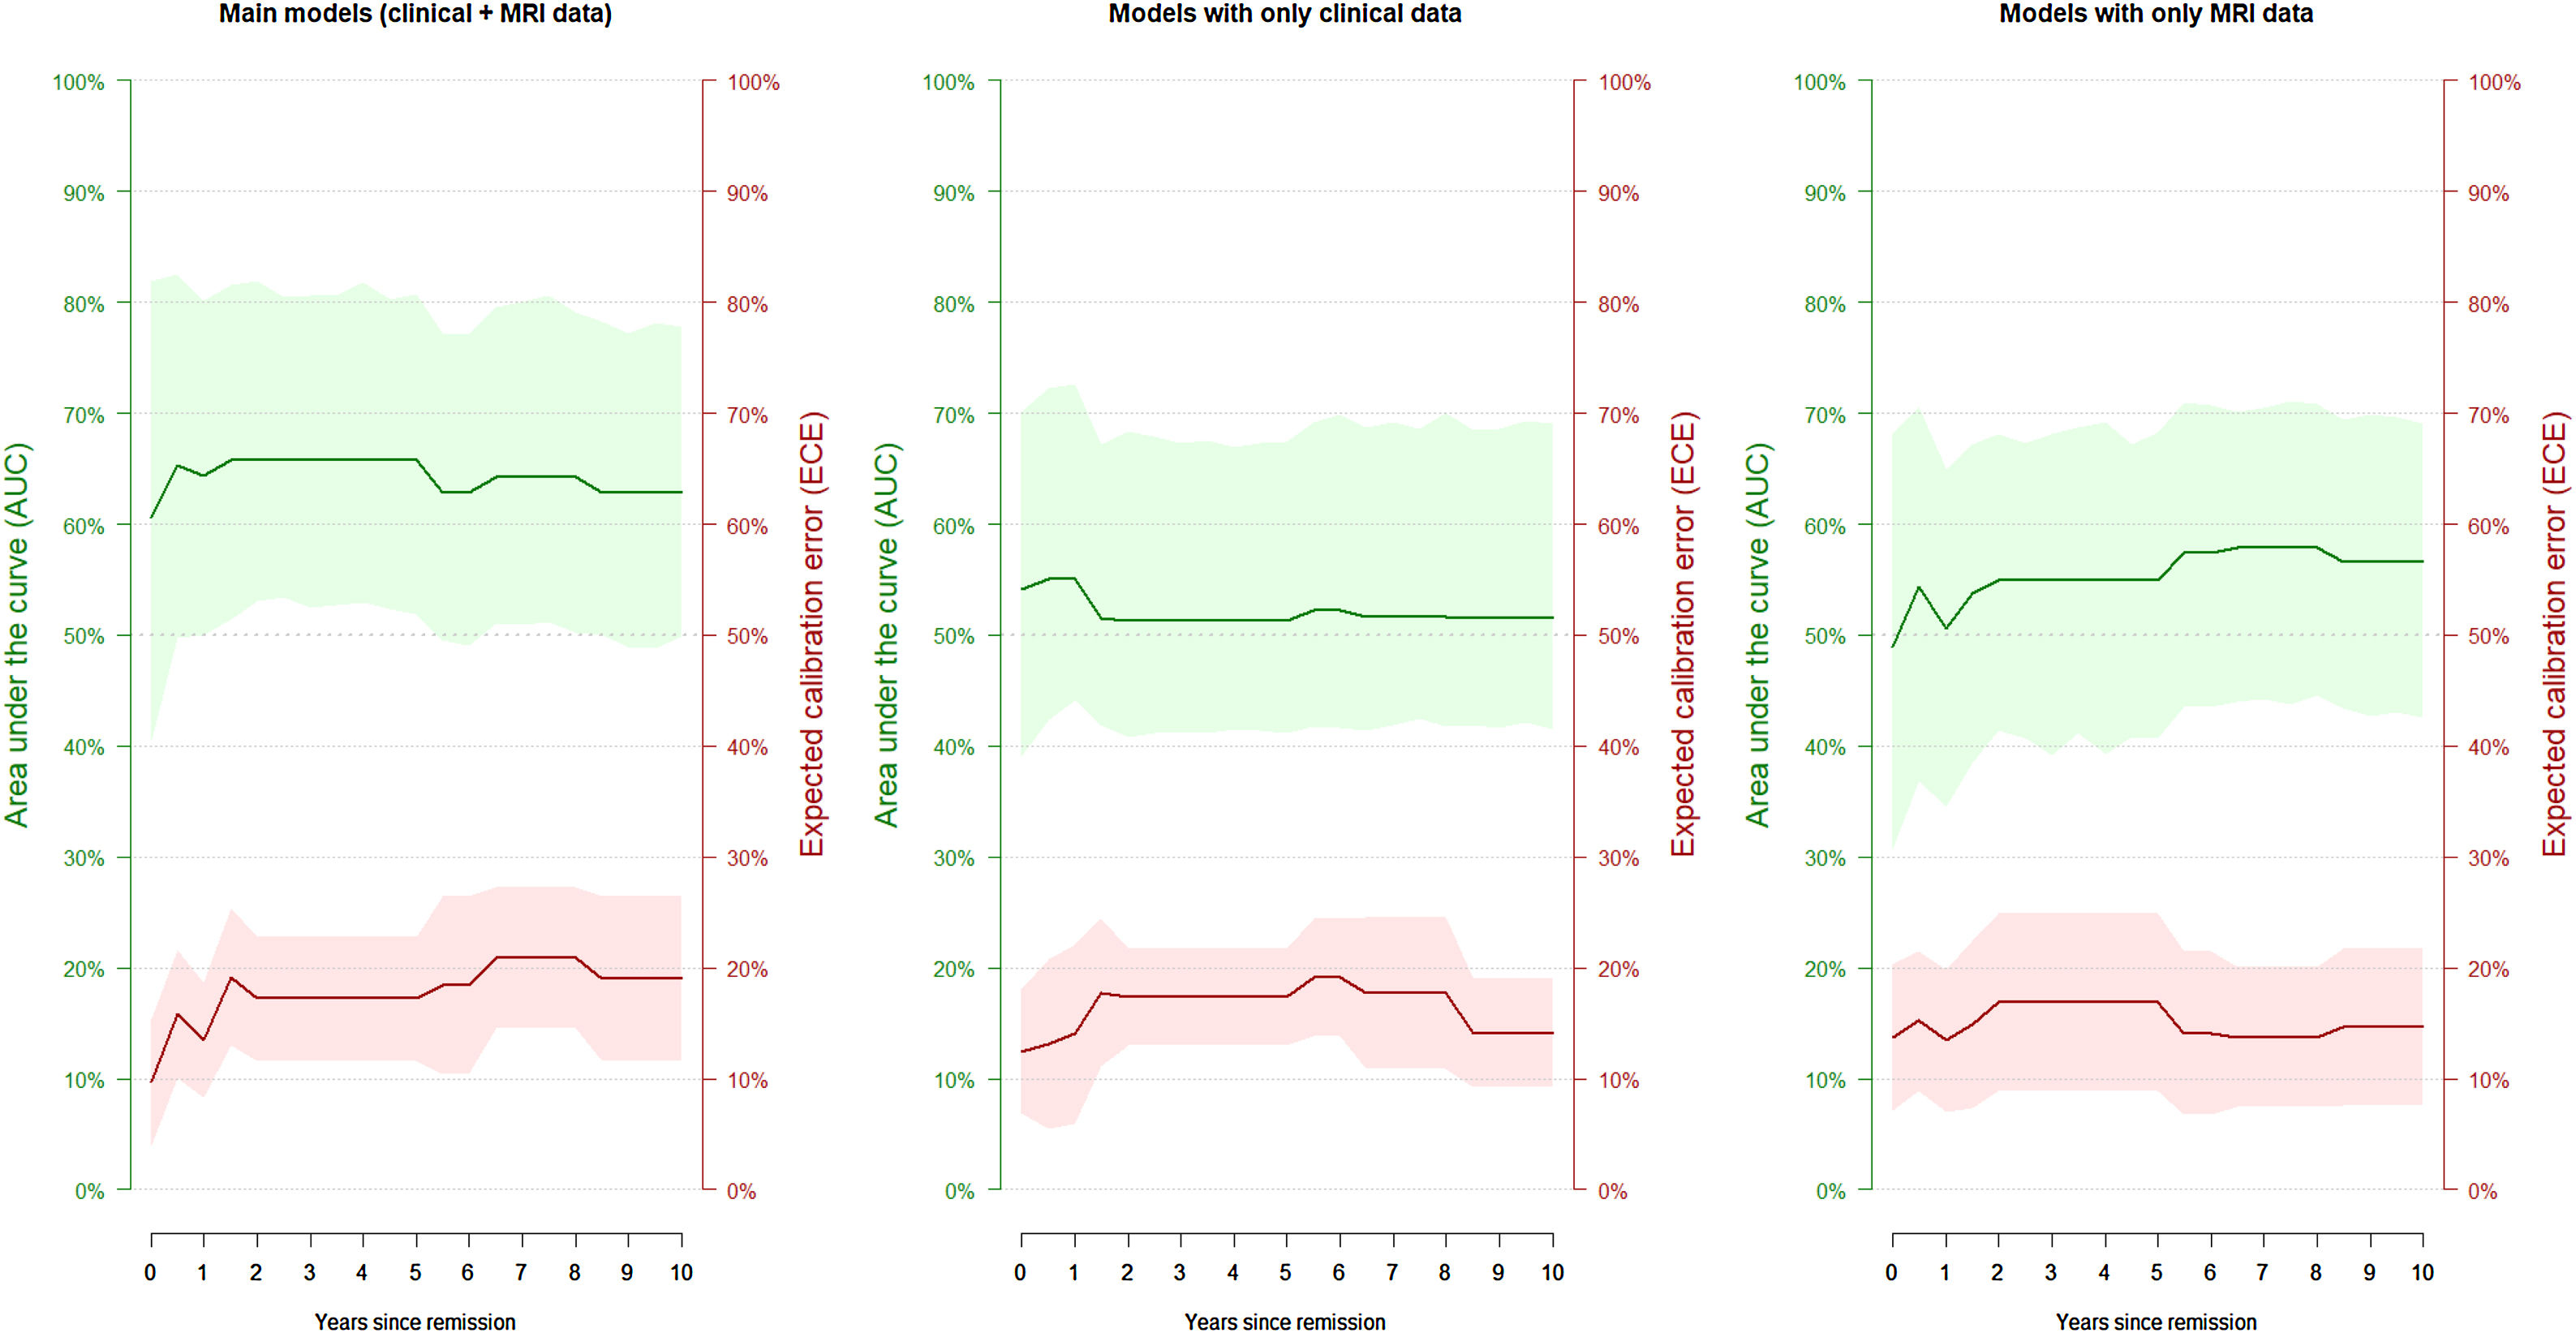
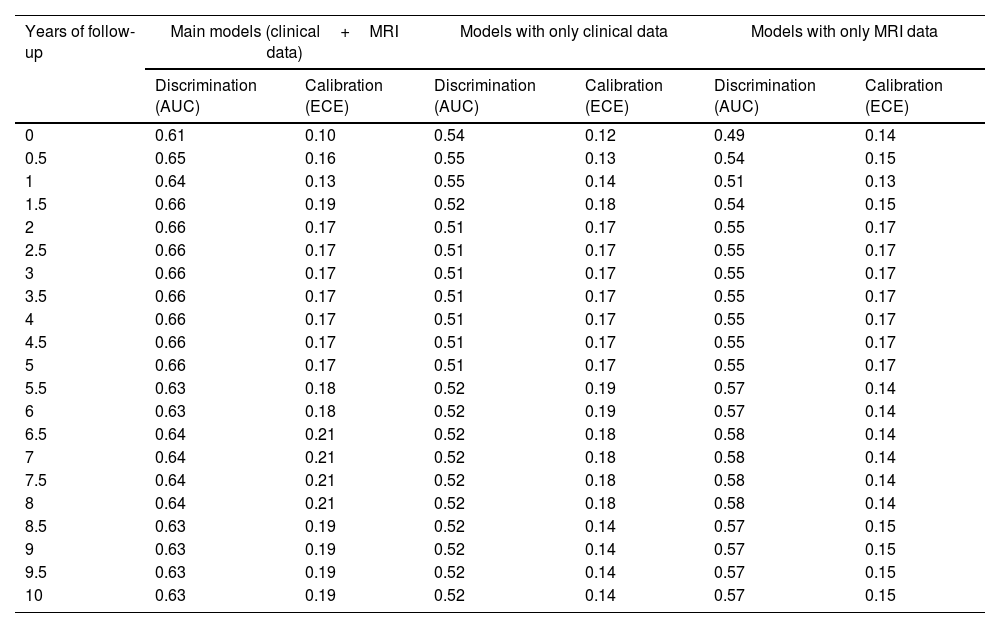
The model successfully estimated the risk of manic relapse (HR=2.35, p=0.027; Cox proportional hazard assumption hold). In addition, the model showed poor to acceptable discrimination accuracy (AUC around 0.65; Table 3 and Fig. 2) and good calibration (most ECE <0.2).
Discrimination accuracy and calibration of the main models and the models with only clinical or magnetic resonance imaging (MRI) data.
| Years of follow-up | Main models (clinical+MRI data) | Models with only clinical data | Models with only MRI data | |||
|---|---|---|---|---|---|---|
| Discrimination (AUC) | Calibration (ECE) | Discrimination (AUC) | Calibration (ECE) | Discrimination (AUC) | Calibration (ECE) | |
| 0 | 0.61 | 0.10 | 0.54 | 0.12 | 0.49 | 0.14 |
| 0.5 | 0.65 | 0.16 | 0.55 | 0.13 | 0.54 | 0.15 |
| 1 | 0.64 | 0.13 | 0.55 | 0.14 | 0.51 | 0.13 |
| 1.5 | 0.66 | 0.19 | 0.52 | 0.18 | 0.54 | 0.15 |
| 2 | 0.66 | 0.17 | 0.51 | 0.17 | 0.55 | 0.17 |
| 2.5 | 0.66 | 0.17 | 0.51 | 0.17 | 0.55 | 0.17 |
| 3 | 0.66 | 0.17 | 0.51 | 0.17 | 0.55 | 0.17 |
| 3.5 | 0.66 | 0.17 | 0.51 | 0.17 | 0.55 | 0.17 |
| 4 | 0.66 | 0.17 | 0.51 | 0.17 | 0.55 | 0.17 |
| 4.5 | 0.66 | 0.17 | 0.51 | 0.17 | 0.55 | 0.17 |
| 5 | 0.66 | 0.17 | 0.51 | 0.17 | 0.55 | 0.17 |
| 5.5 | 0.63 | 0.18 | 0.52 | 0.19 | 0.57 | 0.14 |
| 6 | 0.63 | 0.18 | 0.52 | 0.19 | 0.57 | 0.14 |
| 6.5 | 0.64 | 0.21 | 0.52 | 0.18 | 0.58 | 0.14 |
| 7 | 0.64 | 0.21 | 0.52 | 0.18 | 0.58 | 0.14 |
| 7.5 | 0.64 | 0.21 | 0.52 | 0.18 | 0.58 | 0.14 |
| 8 | 0.64 | 0.21 | 0.52 | 0.18 | 0.58 | 0.14 |
| 8.5 | 0.63 | 0.19 | 0.52 | 0.14 | 0.57 | 0.15 |
| 9 | 0.63 | 0.19 | 0.52 | 0.14 | 0.57 | 0.15 |
| 9.5 | 0.63 | 0.19 | 0.52 | 0.14 | 0.57 | 0.15 |
| 10 | 0.63 | 0.19 | 0.52 | 0.14 | 0.57 | 0.15 |
AUC: area under the ROC curve; ECE: expected calibration error.
 data. The shadow areas indicate the 95% confidence intervals.")
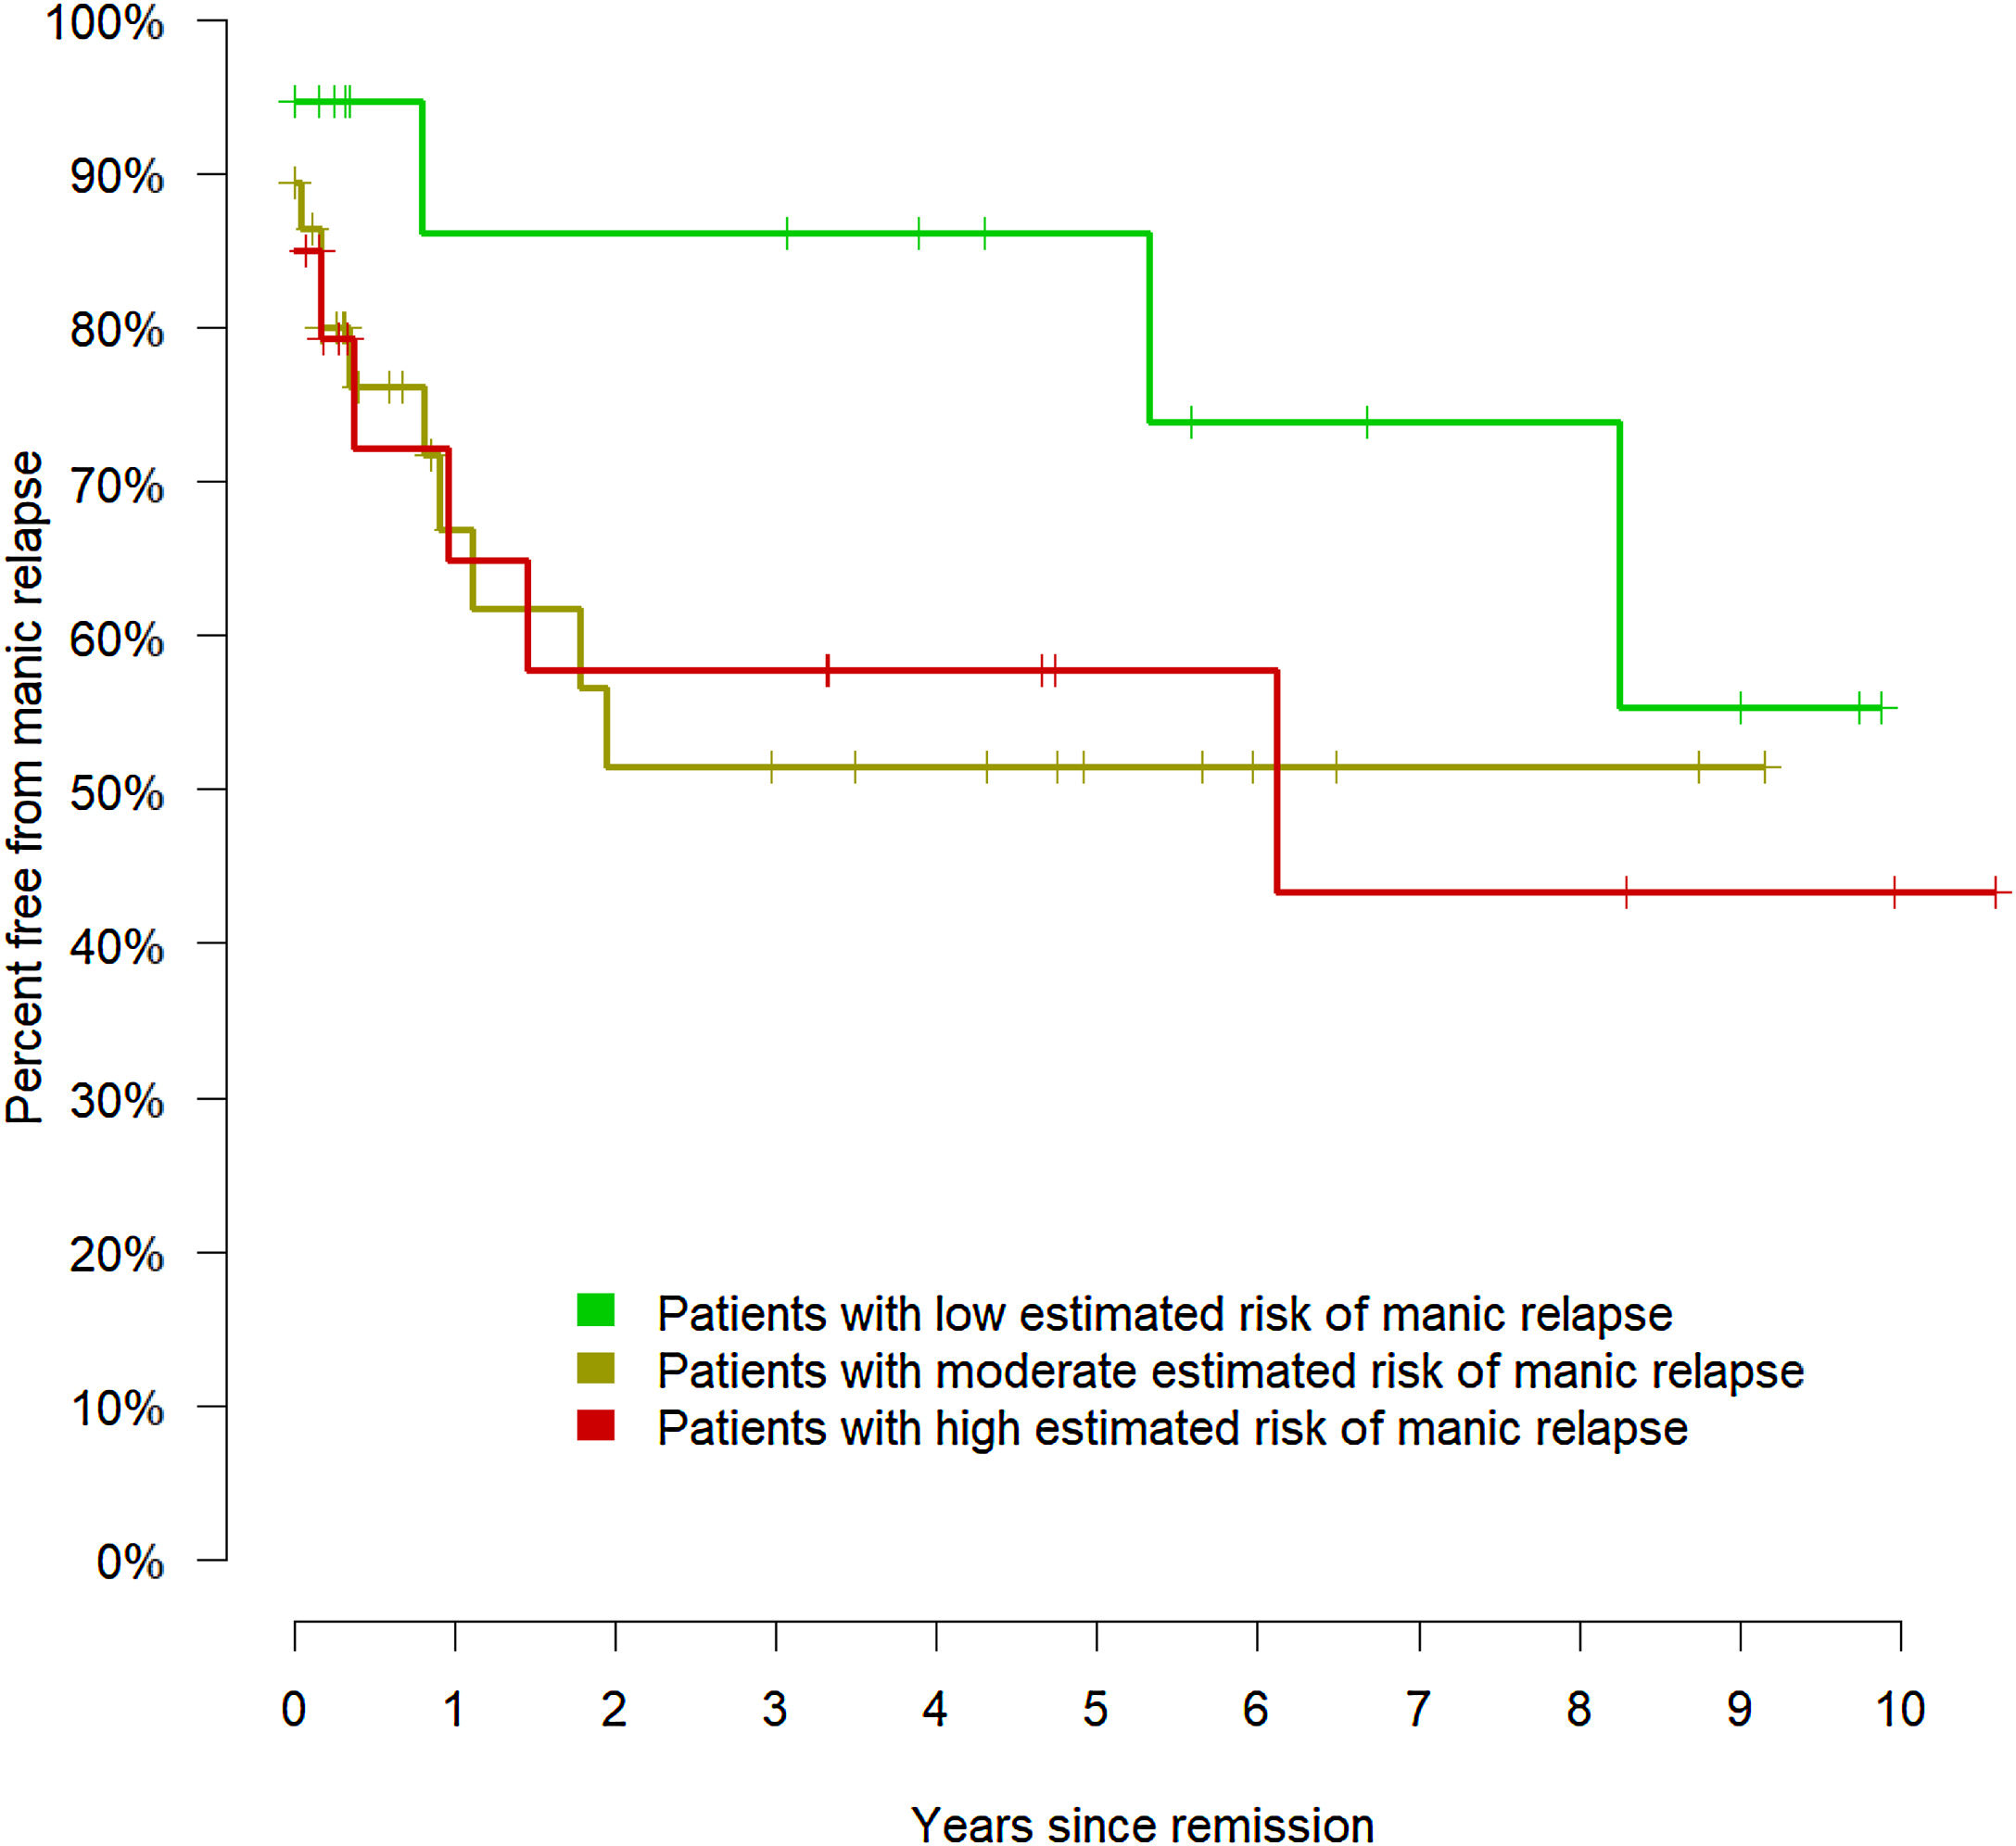
Therefore, the model could effectively evaluate the risk of manic relapse in new data. To display the relationship between the estimated risk of manic relapse and the observed manic relapses, we divided the cohort into low (lower quartile of the estimated risk of manic relapse), moderate (middle quartiles), and high risk (upper quartile). Fig. 3 shows the corresponding Kaplan–Meier curves.

The models exclusively based on MRI or clinical data yielded poorer estimations. The Cox regressions did not achieve statistical significance (only clinical data: HR=3.95, p=0.066; only MRI data: HR=1.66, p=0.551), and all confidence intervals of the AUCs included 0.5 (i.e., like tossing a coin, Table 3 and Fig. 2).
DiscussionIn this study, we created and validated a model that estimates the risk of manic relapse using both clinical and MRI data. To ensure our model was applicable, we used clinical variables usually collected by psychiatrists during the clinical assessment. Similarly, we only included the structural MRI volume, which many physicians ask to rule out tumors and other organic pathology. However, while we feel these findings are promising, we advocate caution until further studies replicate the results. Notably, the estimations were poorer when we used clinical or MRI data separately, showing the advantages of combining them.
Clinical dataThe risk estimation model used the diagnosis of schizoaffective disorder (vs. bipolar disorder type I) and the presence of several clinical symptoms, with the most relevant in the model being poor impulse control, unusual thought content, delusions, tension, grandiose or paranoid ideas, mannerisms and lack of illness insight.
It is worth noting that all clinical symptoms with rβ>0.5% model relevance come from PANSS, with the only exceptions of grandiose or paranoid ideas (YMRS 8) and lack of illness insight (HDRS 17), which did have indeed a relatively small relevance compared to the two most relevant PANSS items (rβ=0.6–0.7% vs. 1.5–2.8%). While PANSS may also measure affective symptoms, the relevance of PANSS items for estimating manic relapse risk invites speculation on whether a schizoaffective spectrum disorder may exist. In that spectrum, some patients would have schizophrenia-like symptoms without fulfilling the criteria of schizoaffective disorder (e.g., including periods with psychotic but not affective symptoms). Indeed, gray matter abnormalities in schizoaffective disorder resemble schizophrenia more than bipolar disorder.38 This resemblance suggests that schizoaffective disorder is a subtype of schizophrenia or that in a continuum spectrum model of psychosis, schizoaffective disorder is more skewed toward schizophrenia than bipolar disorder.
Interestingly, the model selected a diagnostic label (schizoaffective disorder) even if it had also selected its associated symptoms, supporting that diagnostic labels are more than a mere collection of symptoms. Even more, the coefficient of the diagnostic label was substantially higher than the coefficients of the symptoms, supporting that diagnostic labels are clinically helpful. These observations may be relevant in the current debate about DSM/ICD diagnoses.39
Also interestingly, some of the items selected by the model (e.g., delusions and lack of illness insight) have been previously identified as the main risk factors for medication nonadherence in bipolar disorder and schizophrenia.40 And nonadherence has been associated, in turn, with a higher number of manic episodes and hospitalizations.41 Thus, it may be that the mechanism by which these symptoms increase the risk of relapse is by decreasing treatment adherence. Such a mechanism would indicate the need to include interventions to increase adherence, especially in patients with a higher risk of relapse. Moreover, the importance of increasing adherence is higher when non-adherence has been associated with higher suicidal risk.42
An unexpected finding was that lithium usage was not a relevant variable in the model. Indeed, the percentage of patients receiving lithium and the mean dosage were similar between patients who did or did not relapse. Looking at the data, we could not find an apparent reason for this finding, i.e., lithium was not statistically associated with more severe symptoms (other than PANSS N1, blunted affect, p=0.001, and HDRS 6, early awakening, p=0.035). However, as noted above, it could be that even if the indication of lithium was not inferior in patients with higher relapse risk, the actual usage was lower due to non-adherence.
Neuroimaging dataThe brain abnormality showing the highest relevance in the model was the cerebellum gray matter decrease, followed at a considerable distance by a white matter increase in the angular gyrus, several gray matter increases (especially in middle temporal and inferior frontal gyri), and a white matter decrease in the superior occipital region.
These regions have little overlap with those reported in meta-analyses of gray and white matter abnormalities in bipolar disorder.13,43–45 However, our machine-learning algorithms did not look for abnormalities. Instead, they only selected those regions whose volumes may confer protection or risk of relapse. It may well be that some of these regions have a completely average volume in patients with bipolar disorder. Still, a larger or smaller volume may confer protection.
Interestingly, previous studies have found increased middle temporal and decreased cerebellar volumes in antipsychotic-naive individuals with first-episode schizophrenia.46,47 Therefore, it could be that this region's increase is associated with a psychotic-related higher manic relapse risk.
Combination of clinical and structural dataAn important finding of our study is that the machine learning algorithms estimated the risk better when we combined clinical variables and structural MRI data. We want to highlight that this finding does not mean that models based only on clinical data cannot successfully estimate the risk of manic relapse. Indeed, some previous clinical models using larger sample sizes have successfully done it.15–17 However, we show that the combination of clinical and MRI data improves the estimations. This finding is very relevant because the paradigm of many previous MRI machine learning papers was to use MRI data to predict clinical data (e.g., the diagnosis). Conversely, we propose a new paradigm: to use brain imaging to help clinics. Our findings are humble and need replication, but they show that this new paradigm is viable.
Descriptive univariate and machine learning analysisThe overlap between clinical and MRI variables detected in the descriptive univariate analysis and those selected by the machine learning algorithm was only partial. One reason for these discrepancies may be the potential effects of confounders in the univariate analysis. For example, both unusual thought content and excitement symptoms seemed to increase the risk of manic relapse. However, individuals with high unusual thought content in our cohort also tended to have high excitement (Spearman rho=0.341, p=0.016), and a bivariate analysis including both symptoms showed that excitement did not increase relapse risk when controlling for unusual thought content. Therefore, it is unsurprising that the machine learning algorithm seldom selected it. Other differences between the descriptive univariate analysis and the machine learning results may relate to their different methodological nature. The former selects the variables using a conventional threshold (p<0.05). In contrast, the latter selects those variables that optimize the risk estimation model. The variables included in the machine learning model may not need to be “statistically significant”; conversely, the algorithms may not select “statistically significant” variables if their inclusion does not improve the risk estimation. It may be the case, for instance, that between two strongly correlated variables or voxels, the algorithm tends to select one and not the other, even if the latter is also associated with higher risk. Therefore, we suggest considering neither the descriptive univariate analysis nor the machine learning analysis as explicative. The univariate analysis is descriptive, and it does not consider confounding effects. At the same time, the machine learning analysis only aims to estimate the risk. Also relevantly, the p-values of the descriptive analysis only refer to the relationship between symptoms/volumes and observed relapses in the same data. In contrast, the p-value of the machine learning analysis refers to the relationship between the relapse risk estimated from the symptoms/volumes and the observed relapses in new data.
Enhancing statistical powerAn obvious way to optimize the accuracy of the risk estimations is by increasing the sample size. For instance, as noted earlier, a previous study with a much larger sample size successfully predicted the risk of relapse exclusively using clinical data.15,16 Therefore, we strongly suggest future studies have large cohorts or that groups combine the existing longitudinal data to have larger sample sizes, as done in the ENIGMA Bipolar Disorder working group.48
We also speculate that future studies with more complex algorithms may yield more accurate risk estimations. Deep learning, for example, could detect complex relationships between features that our Cox lasso regression did not detect. However, any complex algorithm would require a much larger sample size, which is not readily achievable in a longitudinal study. We also speculate that we might have achieved more accurate risk estimations combining information from different MRI sequences. For instance, diffusion MRI may provide finer details about white matter structure. However, we aimed only to use the structural MRI many physicians already ask for to rule out tumors and other organic pathology. And in any case, risk estimations only based on baseline data might hardly achieve very high accuracy because relapses also depend on life events and stressors that may happen after the assessment.49
MRI costsIf replicated, the risk estimation model could provide the clinician with helpful information to optimize the patient's follow-up and thus reduce the risk of manic relapse. Given the relevance and severity of such relapses, the economic cost of a structural MRI may seem negligible. However, it could be that, for many reasons, the information provided by the model does not translate into a reduction of the relapse risk compared to not using models or using models based only on clinical data. Future trials should investigate the effectiveness, e.g., via the number of patients needed to scan to prevent relapse, and derive whether the overall strategy is cost-effective.
Weaknesses and strengthsThis study has some limitations. First, we used a relatively simple machine-learning algorithm. More complex algorithms would likely be more accurate, but they require a substantially larger sample size. Second, we collected the data at a particular time: when the current manic episode remits. However, we have reported earlier that the manic relapse risk changes dynamically in time, e.g., it progressively decreases if the patient does not have relapses.10 Thus, our model would still provide a reasonable estimation of the risk at the beginning of the follow-up, but this risk could be re-estimated at each follow-up visit (e.g., depending on new life events). Third, clinicians may prefer deciding the frequency of follow-up visits and medication based on proximal clinical variables such as sleep disturbance or increasing activity. However, we suggest not choosing between model-based risk estimations or proximal clinical variables but considering them all. Fourth, we only collected a set of clinical and MRI variables. Other clinical and MRI variables may further help estimate the manic relapse risk. Fifth, the discrimination and calibration assessments at different follow-up times assumed that patients lost to follow-up had not relapsed. We thus suggest that these specific assessments be taken with some caution. Finally, our sample was large enough to provide adequate statistical power but not to conduct subgroup analyses. Future studies may investigate whether different subgroups of patients may benefit from different models.
We must also remind the strengths. First, we used standard clinical variables and structural MRI. These data are often collected during clinical assessment, increasing the approach's feasibility. Second, this is a longitudinal study, which is rare in the context of neuroimaging.48,50 And in addition, we conducted frequent follow-up visits (at 2, 4, 6, 9, 12, 15, and 18 months). Finally, we based on the results of previous rigorous methodological studies to optimize MRI data processing avoiding data torturing and bias.
ConclusionWhile this study needs replication, it points out that combining clinical and MRI data may improve the estimation of the risk of manic relapse after a manic episode without mixed symptoms. Most previous studies aimed to find reliable MRI biomarkers or imitate clinical judgment (e.g., using MRIs to classify patients and controls). Instead, we combined clinical and MRI data to optimize a tool that could provide helpful information to the clinician.
Authors’ contributionsAS had full access to all the data in the study and takes responsibility for the integrity of the data and the accuracy of the data analysis. Concept and design: PP, AS, EPC, and JR. Acquisition, analysis, or interpretation of data: all authors. Statistical analysis: PP, AS, and JR Drafting of the manuscript: PP, AS, and JR. Critical revision of the manuscript for important intellectual content: all authors. Supervision: EPC and JR.
Data availabilityThe data supporting this study's findings are not publicly available due to the privacy of research participants. Requests may be sent to the Clinical Research Ethics Committee of Germanes Hospitalàries del Sagrat Cor de Jesús, Barcelona (Contact phone: 936529999, ext. 1486).
FundingWe would like to thank the Instituto de Salud Carlos III-Subdirección General de Evaluación y Fomento de la Investigación, the Spanish Ministry of Science, Innovation, and Universities, the European Regional Development Fund (ERDF/FEDER), European Social Fund, “Investing in your future,”“A way of making Europe” (projects: PI07/1278, PI10/02622, PI14/00292, PI/15/02242, and PI19/00394; contracts: CP14/00041 to JR, CM15/00024 to MMS, CD19/00232 to S-AL, and CPII19/00009 to JR). EJC-R was supported by the Swiss National Science Foundation (SNSF, Ambizione grant PZ00P2_185814). NV thanks the BITRECS project, which has received funding from the European Union's Horizon 2020 research and innovation program under the Marie Skłodowska-Curie grant agreement No 754550 and from “La Caixa” Foundation (ID 100010434), under the agreement LCF/PR/GN18/50310006. The funders had no role in the design and conduct of the study; collection, management, analysis, and interpretation of the data; preparation, review, or approval of the manuscript; and decision to submit the manuscript for publication. B.L. Amann received Research three grants (PI07/1278, PI10/02622 and PI/15/ 02242) and a mobility grant (BA21/00002) from the Instituto de Salud Carlos III-Subdirección General de Evaluación y Fomento de la Investigación, Plan Nacional 2008-2011 and 2013-2016.
Conflict of interestEV has received grants and served as consultant, advisor, or CME speaker for the following entities (work unrelated to the topic of this manuscript): AB-Biotics, Abbott, Allergan, Angelini, Dainippon Sumitomo Pharma, Galenica, Janssen, Lundbeck, Novartis, Otsuka, Sage, Sanofi-Aventis, and Takeda. NV has received financial support for CME activities and travel funds from the following entities (unrelated to the present work): Angelini, Janssen-Cilag, Lundbeck, and Otsuka. The other authors have no conflicts of interest to declare.
It is mandatory to recall the efforts of Núria Garcia and the rest of the administrative team, who made the challenging transfers of manic patients to the MRI possible. We would also like to thank all the patients who have selflessly participated in this study.
The following are the supplementary data to this article:
- Upward trends in eating disorders, self-harm, and suicide attempt emergency admissions in female adolescents after COVID-19 lockdown
- SARS-COV2 pandemic impact on suicide attempts admitted to pediatric critical care: A monographical observational retrospective study
- Holistic approach to COVID-19 aftermath
- COVID-19 pandemic and mental health in Spain: An analysis of their relationship using Google Trends