


Latest studies in patients with first episode psychosis (FEP) have shown alterations in cardiovascular, immune and endocrinological systems. These findings could indicate a systemic onset alteration in the metabolic disease as opposed to justifying these findings exclusively by antipsychotics’ side effects and long-term lifestyle consequences. In any case, this population is considered at higher risk for developing cardiometabolic disorders than their age-matched peers.
MethodsThis is a prospective longitudinal study. Metabolic syndrome (MetS) prevalence between 244 subjects with FEP and 166 controls at 3 years was compared. Additionally, we explored whether baseline differences in any of the MetS components according to Adult Treatment Panel III definition and prescribed antipsychotic could help to predict the MetS development at 3 years.
ResultsPatients with FEP present a similar baseline prevalence of MetS (6.6% vs 5.4%, p=0.320), according to ATP-III criteria. but with a higher prevalence of metabolic alterations than controls before the start of antipsychotic treatment. At 3-years follow-up the MetS prevalence had increased from 6.6% to 18.3% in the FEP group, while only from 5.4% to 8.1% in the control group. The multivariate model showed that, before antipsychotic exposure, a baseline altered waist circumference WC (OR=1.1, p=0.011), triglycerides (OR=1.1, p=0.043) and high-density lipoprotein HDL (OR=0.9, p=0.008) significantly predicted the presence of MetS at 3-years. We propose a predictive model of MetS at 3 years in 244 drug-naïve FEP patients.
ConclusionWe found that altered WC, HDL and triglycerides at baseline predicted the presence of full MetS after 3-years of initiating antipsychotic treatment. Our findings support the need for interventions to improve factors related to the physical health of FEP individuals.
Metabolic syndrome (MetS) is a series of metabolic abnormalities that together are considered risk factors for developing diabetes and cardiovascular disease. Diagnostic criteria include high triglyceride values, low high-density lipoprotein (HDL) cholesterol, high blood pressure, high blood glucose levels and abdominal obesity (either increased abdominal circumference or BMI≥30kg/m2).1,2 On the other hand, schizophrenia is a clinical syndrome characterized by psychotic symptoms and psychosocial deterioration that leads to a debilitating illness, with significant human and economic costs. Its etiology, still under study, combines genetic factors modulated by unknown environmental factors.3–5 Both schizophrenia and cardiovascular diseases derived from MetS have a high impact on mortality and disability worldwide.6–8 In recent decades, a differential gap has become evident between the mortality of patients with schizophrenia and the rest of the population, with a reduced life expectancy of up to 20 years in psychosis patients.9–11 Around 60% of the causes of death in these patients are due to cardiovascular diseases, which are in great part explained by the higher risk of presenting MetS.8
Atypical antipsychotics can cause weight gain and considerable changes in the metabolism, which can increase the risk of type II diabetes and increase circulating cholesterol levels.12–14 Weight gain, metabolic and liver adverse effects are highly frequent effect of atypical antipsychotics, and severity varies widely among individuals and treatments.15 After the first year of treatment 30%16 of patients suffering from a first episode of psychosis (FEP) experienced a weight gain higher than 20%. Thus, the first months of exposure to antipsychotic treatment is a critical period for development of obesity and metabolic abnormalities.12,13,17 However, contrary to what was traditionally postulated, recent studies have shown that this cannot be attributed solely to antipsychotic treatment.14,18,19 Latest studies in patients with FEP have shown alterations in cardiovascular, immune and endocrinological systems. These new findings could indicate a systemic onset alteration in the metabolic disease as opposed to justifying these findings exclusively by antipsychotics’ side effects and long-term lifestyle consequences, as had traditionally been done.20
In any case, this population is considered at higher risk for developing cardiometabolic disorders than their age-matched peers.18 However, although the high prevalence of MetS in these patients is widely known, the available risk-prediction algorithms, validated in the general population, could underestimate the risk in young people with psychosis. This fact seems to be mainly related to the role that age plays in these algorithms.21 Cardiometabolic risk prediction algorithms are also common in clinical practice, including only three of them psychiatric predictors: QRISK3,22 QDiabetes23 and PRIMROSE.24 Despite of this, they all appear to underestimate cardiovascular risk in young adults with or at risk of developing psychosis. Therefore, recent meta-analyses21,25 state that, at this point it is not useful to use the pre-established diagnostic parameters in the general population for the diagnosis of MetS in patients with a FEP.
Our objectives will be to compare the MetS prevalence between FEP and controls at 3 years, and to explore whether baseline differences in any of the MetS components could help to predict the MetS development at 3 years.
Material and methodsStudy design and settingThis is a prospective longitudinal study. Data were obtained from a longitudinal intervention program of FEP called PAFIP NCT02305823 (Programa de Atención a las Fases Iniciales de Psicosis) conducted at the outpatient clinic and the inpatient unit of the University Hospital Marqués de Valdecilla (Santander, Spain).26,27 Conforming to international standards for research ethics, this program was approved by the local institutional review board (the Clinical Research Ethics Committee of Cantabria). Patients meeting inclusion criteria and their families provided written informed consent prior to their inclusion in the program.
ParticipantsFrom February 2001 to October 2018, all referrals to PAFIP were screened for patients who met the following criteria: (1) 16–60 years old; (2) living in the catchment area; (3) experiencing their FEP; (4) no previous antipsychotic exposure; and (5) DSM-IV criteria for brief psychotic disorder; schizophreniform disorder; Schizophrenia; psychotic disorder not otherwise specified; or schizoaffective disorder. Patients were excluded for any of the following reasons: (1) meeting DSM-IV criteria for intellectual disability; (2) having a history of neurological disease or head injury; and (3) having a diagnosis of drug dependence. The diagnoses were confirmed using the Structured Clinical Interview for DSM-IV,28 carried out by an experienced psychiatrist 6 months on from the baseline visit. Our operational definition of a FEP included individuals suffering from their first episode of nonaffective psychosis (meeting the inclusion criteria defined above) regardless of the duration of untreated psychosis. A group of subjects, without psychiatric illness, was recruited as a control group between April 2010 and January 2012. Their assessment included sociodemographic questionnaires, anthropometric measures and blood extraction for laboratory testing. Control subjects were matched for age and gender with study subjects.
Anthropometric and metabolic syndrome assessmentClinical measures of weight, height, waist circumference (WC) were registered. Systolic blood pressure (SBP) and diastolic blood pressure (DBP) were also taken. Blood samples were drawn after 8h fasting for glucose and lipid profile testing. In the current study, the Adult Treatment Panel III (ATPIII)29 was used to define MetS. At baseline assessment, all individuals were drug-naïve and had not been exposed to antipsychotic treatment.
Laboratory analysisAll biochemical determinations were performed in our hospital. All measurements were obtained after an overnight fast. Fasting state, as well as treatment compliance, were reported by patients and their family members. Glucose, HDL cholesterol, and triglycerides were measured by automated methods on a TechniconDax (Technicon Instruments Corp, Tarrytown NY USA), using the reagents supplied by Boehringer-Mannheim (Mannheim, Germany). Low density lipoprotein (LDL) cholesterol was determined by the Friedewald et al. calculation30: LDL=total cholesterol−(HDL+[triglycerides/5]).
StatisticsSample sizeSample size was calculated based on the reported data about MetS prevalence in patients with FEP 13.8% vs healthy controls 7%.18 According to the parameter choices for a desired power of 0.90 and 95% confidence level we estimated that we would need 216 participants distributed over 108 cases and 108 healthy controls. Sample size analysis was conducted using Epidata software.31
Data analysisData were analyzed using the Statistical Package for Social Sciences (IBM SPSS. Version 27.0. Armonk. NY: IBM Corp). For comparison between FEP and control groups of demographic characteristics, MetS and individual metabolic component, chi-square tests for categorical variables, t-student for independent samples or the Mann–Whitney test for continuous variables were used. A significance level of p<0.05 (two-tailed) was applied. For the analysis of the baseline and follow up data at 3 years, t-student for paired samples or Wilcoxon test for quantitative measures and McNemar test for paired nominal data were used. Regression analyses using multivariate analysis controlling for age, sex, and type of antipsychotic drug (risperidone, ziprasidone, quetiapine vs. aripiprazole) were employed to examine the relationship between baseline metabolic values and MetS after 3 years. All metabolic alterations at 3 years (hyperglycemia, hypertriglyceridemia, altered WC, low HDL, high blood pressure) were investigated in separate models adjusted for sex, age and treatment.
For antipsychotic treatment comparison we followed an intention-to-treat approach and clustered the FEP patients into antipsychotic groups according to their prescribed antipsychotic at study entry: aripiprazole, risperidone, quetiapine and ziprasidone.
In the multivariate analysis we used an age younger than 30 years; women; and ziprasidone as reference population. The median age of the FEP group is 30 years. Relevant literature about MetS in general population32 has reported that from 18 years to 70 years old, women have higher MetS prevalence than men. Although both aripiprazole and ziprasidone have been described as “metabolically neutral”, recent head-to-head comparisons between antipsychotic groups have shown that ziprasidone presents even significantly smaller increments in weight and BMI than aripiprazole.13,33
ResultsDemographic and treatment characteristicsThe baseline sample consists of 244 cases of FEP and 166 controls; in FEP group the mean (SD) age was 32 years (10); median 30 years (23–39); 54% (n=117) were men and 45.1% (n=96) were women; and their ethnicity was mainly white (92%). The prescribed antipsychotics at study entry were aripiprazole (n=90, 42.3%), risperidone (n=60, 28.2%), ziprasidone (n=34, 16.0%) and quetiapine (n=29, 13.6%). In control group the mean (SD) age was 29.6 years (7.9); median 28.9 years (23–39); 62% (n=151) were men and their ethnicity was largely white (99%).
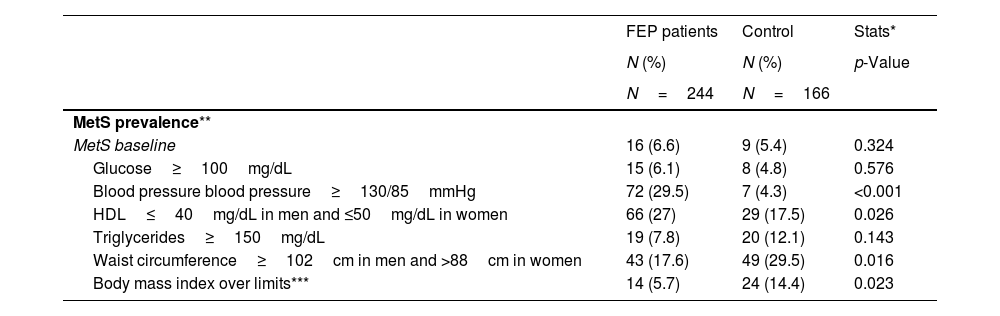
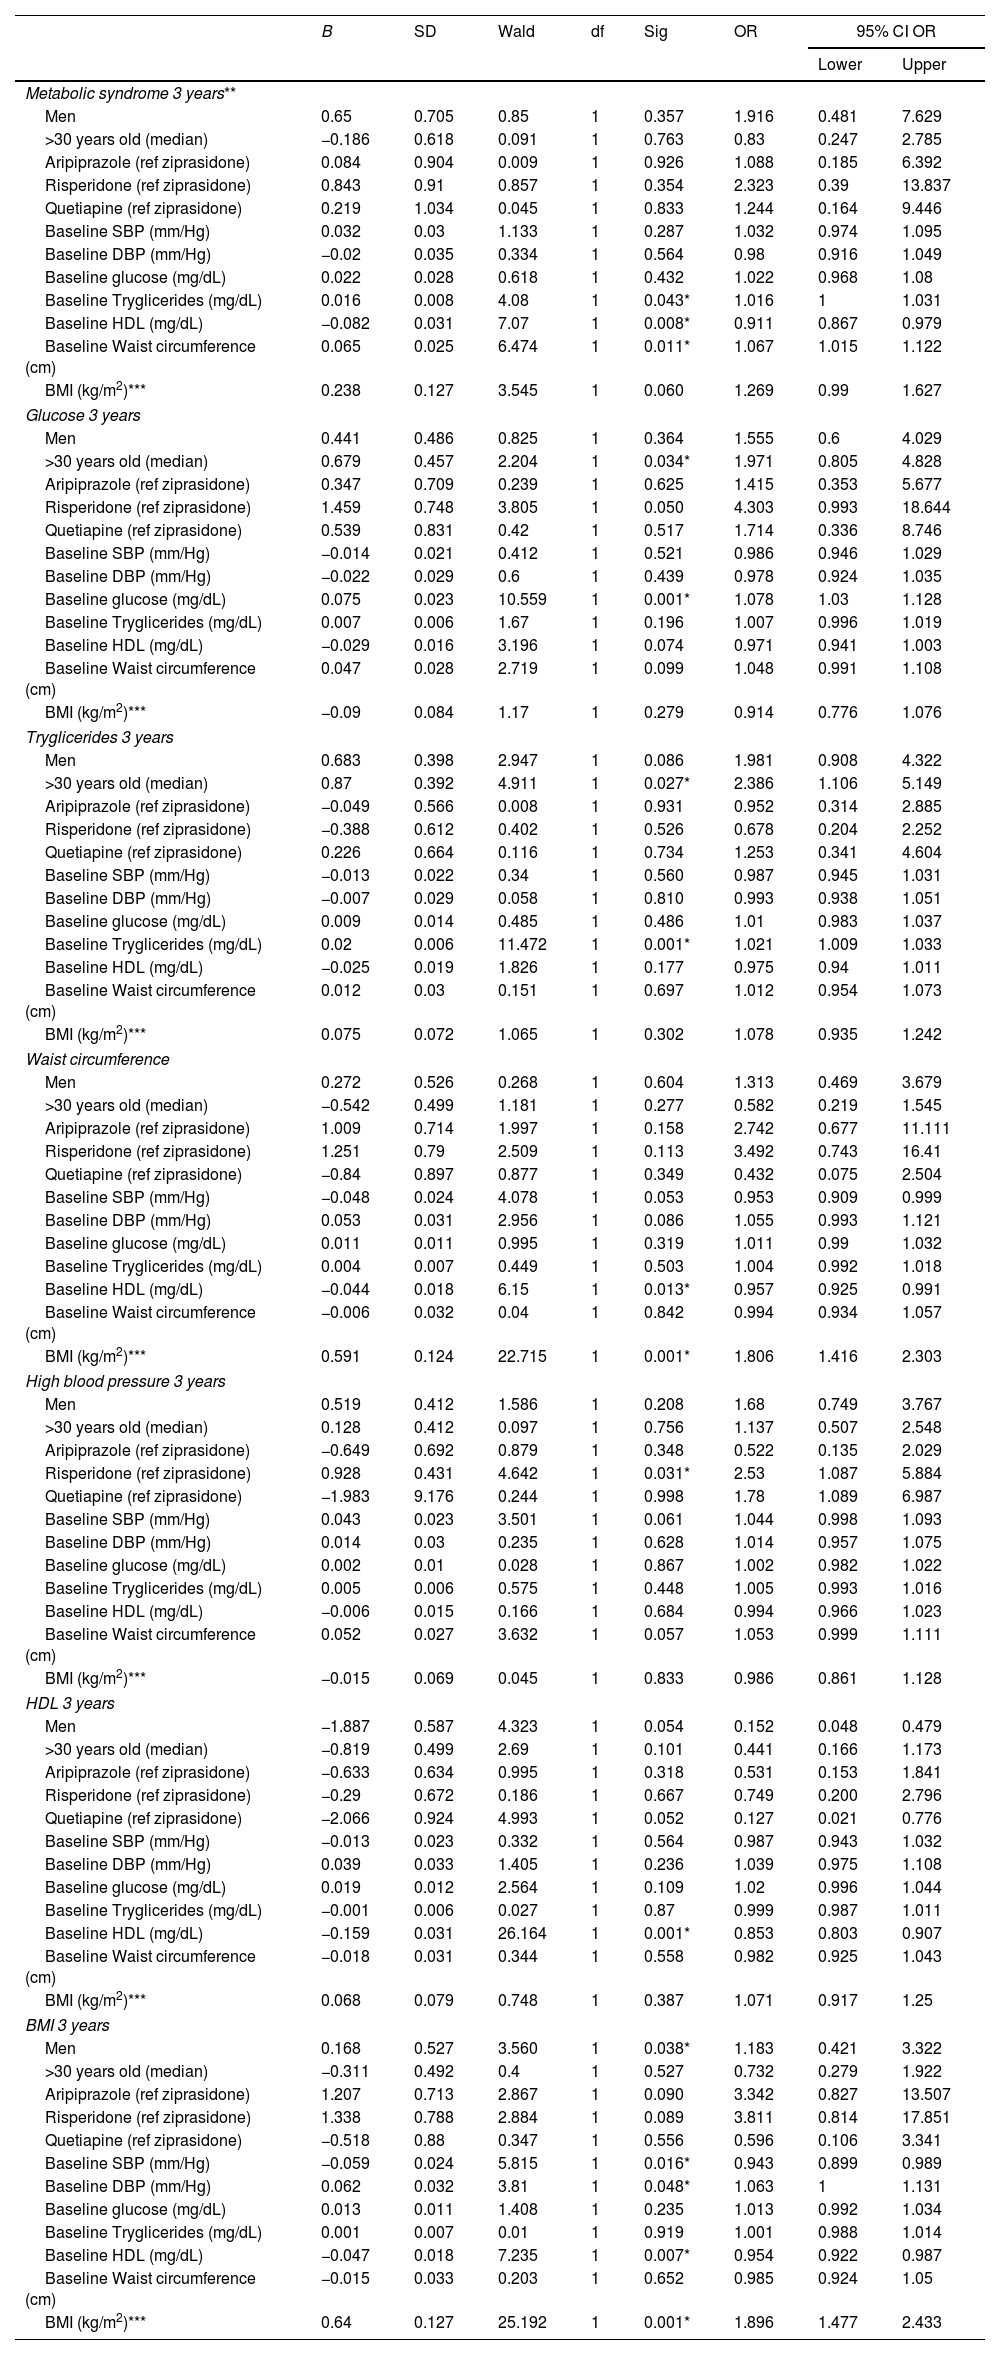
Metabolic syndrome: baseline prevalence, 3 years follow-up and predictive analysisBaseline MetS prevalence was similar between FEP and controls according to ATP-III and IDF criteria ATP-III (6.6% vs 5.4%, p=0.320), IDF (5.3% vs 5.4), WHO (15.1% vs 8.8%) (Table S.1). However, the FEP group had a worse evolution compared to the control group; at 3 years the MetS prevalence had increased from 6.6% to 18.3% (p=0.001) in the FEP group and from 5.4% to 8.1% (p=0.063) in the control group (Tables 1 and 2). In the FEP group, the multivariate model, using the development of MetS at 3 years as a dependent variable and age, sex, prescribed antipsychotic at study entry and the numerical values of each of the individual components of MetS as covariates, showed that, before antipsychotic exposure, a baseline altered WC (OR=1.1, p=0.011), triglycerides (OR=1.1, p=0.043) and HDL (OR=0.9, p=0.008) significantly predicted the presence of MetS at 3-years. On the other hand, none of the 3 drugs included in the multivariate model (aripiprazole, risperidone, quetiapine) had a higher risk than the reference treatment (ziprasidone) of presenting MetS at 3 years. Age and sex were also not determining factors for developing MetS at 3 years (Table 3).
Comparison of MetS prevalence and mean values of related components in FEP and control group.
| FEP patients | Control | Stats* | |
|---|---|---|---|
| N (%) | N (%) | p-Value | |
| N=244 | N=166 | ||
| MetS prevalence** | |||
| MetS baseline | 16 (6.6) | 9 (5.4) | 0.324 |
| Glucose≥100mg/dL | 15 (6.1) | 8 (4.8) | 0.576 |
| Blood pressure blood pressure≥130/85mmHg | 72 (29.5) | 7 (4.3) | <0.001 |
| HDL≤40mg/dL in men and ≤50mg/dL in women | 66 (27) | 29 (17.5) | 0.026 |
| Triglycerides≥150mg/dL | 19 (7.8) | 20 (12.1) | 0.143 |
| Waist circumference≥102cm in men and >88cm in women | 43 (17.6) | 49 (29.5) | 0.016 |
| Body mass index over limits*** | 14 (5.7) | 24 (14.4) | 0.023 |
| N=202 | N=86 | Stats*p-Value | |
|---|---|---|---|
| MetS 3 years | 37 (18.3) | 7 (8.1) | 0.028 |
| Glucose≥100mg/dL | 43 (21.2) | 7 (8.1) | 0.007 |
| Blood pressure blood pressure≥130/85mmHg | 42 (20.7) | 17 (20.5) | 0.622 |
| HDL≤40mg/dL in men and ≤ 50mg/dL in women | 51 (25.2) | 10 (11.6) | 0.006 |
| Triglycerides≥150mg/dL | 47 (23.2) | 10 (11.6) | 0.020 |
| Waist circumference≥102cm in men and >88cm in women | 78 (38.6) | 26 (30.6) | 0.112 |
| Body mass index over limits*** | 47 (23.2) | 18 (19.8) | 0.412 |
| MetS components mean values | Mean (SD) | Mean (SD) | Stats*p-Value |
|---|---|---|---|
| Baseline | |||
| Glucose (mg/dL) | 86.36 (21.5) | 84.49 (8.54) | 0.205 |
| Systolic blood pressure (mmHg) | 119.08 (15.11) | 106.14 (12.08) | 0.001 |
| Diastolic blood pressure (mmHg) | 70.65 (11.61) | 62.24 (8.77) | 0.001 |
| HDL (mg/dL) | 53.55 (15.76) | 57.71 (15.50) | 0.050 |
| Triglycerides (mg/dL) | 85.27 (38.76) | 86.6 (40.94) | 0.141 |
| Waist circumference (cm) | 83.30 (12.16) | 89.80 (13.51) | 0.005 |
| Body mass index (kg/m2) | 23.16 (4.26) | 26.03(4.44) | 0.001 |
| 3 years | |||
| Glucose (mg/dL) | 92.67 (16.65) | 85.52 (15.11) | 0.001 |
| Systolic blood pressure (mmHg) | 114.09 (14.94) | 114.56 (13.66) | 0.979 |
| Diastolic blood pressure (mmHg) | 70.67 (10.75) | 70.42 (11.18) | 0.851 |
| HDL (mg/dL) | 51.71 (13.93) | 58.30 (15.18) | 0.001 |
| Triglycerides (mg/dL) | 117.05 (72.96) | 93.76 (56.73) | 0.003 |
| Waist circumference (cm) | 90.67 (13.69) | 88.56 (13.25) | 0.227 |
| Body mass index (kg/m2) | 26.60 (4.97) | 26.27(4.51) | 0.587 |
Abbreviations: FEP, First Episode Psychosis. SD, Standard deviation. HDL, High density lipoprotein.
Statistics: chi squared and t student for independent samples or Mann–Whitney test were used. p-Value<0.05 is significant.
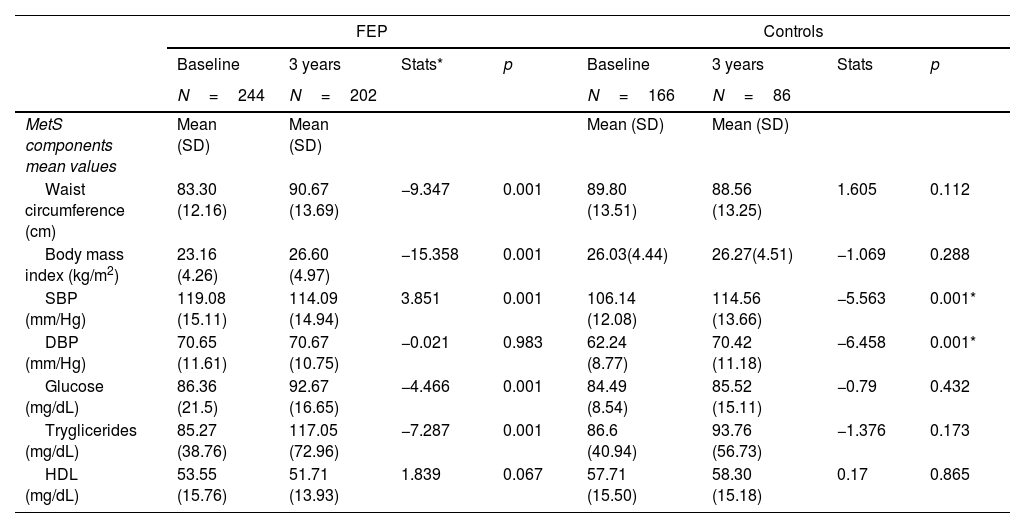
Three years follow-up of MetS and related factors mean values and prevalence in FEP and controls.
| FEP | Controls | |||||||
|---|---|---|---|---|---|---|---|---|
| Baseline | 3 years | Stats* | p | Baseline | 3 years | Stats | p | |
| N=244 | N=202 | N=166 | N=86 | |||||
| MetS components mean values | Mean (SD) | Mean (SD) | Mean (SD) | Mean (SD) | ||||
| Waist circumference (cm) | 83.30 (12.16) | 90.67 (13.69) | −9.347 | 0.001 | 89.80 (13.51) | 88.56 (13.25) | 1.605 | 0.112 |
| Body mass index (kg/m2) | 23.16 (4.26) | 26.60 (4.97) | −15.358 | 0.001 | 26.03(4.44) | 26.27(4.51) | −1.069 | 0.288 |
| SBP (mm/Hg) | 119.08 (15.11) | 114.09 (14.94) | 3.851 | 0.001 | 106.14 (12.08) | 114.56 (13.66) | −5.563 | 0.001* |
| DBP (mm/Hg) | 70.65 (11.61) | 70.67 (10.75) | −0.021 | 0.983 | 62.24 (8.77) | 70.42 (11.18) | −6.458 | 0.001* |
| Glucose (mg/dL) | 86.36 (21.5) | 92.67 (16.65) | −4.466 | 0.001 | 84.49 (8.54) | 85.52 (15.11) | −0.79 | 0.432 |
| Tryglicerides (mg/dL) | 85.27 (38.76) | 117.05 (72.96) | −7.287 | 0.001 | 86.6 (40.94) | 93.76 (56.73) | −1.376 | 0.173 |
| HDL (mg/dL) | 53.55 (15.76) | 51.71 (13.93) | 1.839 | 0.067 | 57.71 (15.50) | 58.30 (15.18) | 0.17 | 0.865 |
| MetS components prevalence | N (%) | N (%) | Mc Nemar | p | N (%) | N (%) | Mc Nemar | p |
|---|---|---|---|---|---|---|---|---|
| MetS** | 16 (6.6) | 37 (18.3) | Mc Nemar | <0.001 | 9 (5.4) | 7 (8.1) | Mc Nemar | 0.063 |
| Glucose≥100mg/dL | 15 (6.1) | 43 (21.2) | Mc Nemar | 0.001 | 8 (4.8) | 7 (8.1) | Mc Nemar | 0.063 |
| Blood pressure ≥130/85mmHg | 72 (29.5) | 42 (20.7) | Mc Nemar | 0.011 | 7 (4.3) | 17 (20.5) | Mc Nemar | 0.001 |
| HDL ≤40mg/dL in men and ≤50mg/dL in women | 66 (27) | 51 (25.2) | Mc Nemar | 0.706 | 29 (17.5) | 10 (11.6) | Mc Nemar | 0.754 |
| Triglycerides ≥150mg/dL | 19 (7.8) | 47 (23.2) | Mc Nemar | <0.001 | 20 (12.1) | 10 (11.6) | Mc Nemar | 1.00 |
| Waist circumference ≥102cm in men and >88cm in women | 43 (17.6) | 78 (38.6) | Mc Nemar | <0.001 | 49 (29.5) | 26(30.6) | Mc Nemar | 0.227 |
| Body mass index>30kg/m2** | 14 (5.7) | 47 (23.2) | Mc Nemar | 0.001 | 24 (14.4) | 45 (19.8) | Mc Nemar | 0.225 |
Abbreviations: FEP, First Episode Psychosis. SD, Standard deviation. HDL, High density lipoprotein. SBP, Systolic blood pressure. DBP, Diastolic blood pressure.
Summary of multiple binary logistic regression analysis.
| B | SD | Wald | df | Sig | OR | 95% CI OR | ||
|---|---|---|---|---|---|---|---|---|
| Lower | Upper | |||||||
| Metabolic syndrome 3 years** | ||||||||
| Men | 0.65 | 0.705 | 0.85 | 1 | 0.357 | 1.916 | 0.481 | 7.629 |
| >30 years old (median) | −0.186 | 0.618 | 0.091 | 1 | 0.763 | 0.83 | 0.247 | 2.785 |
| Aripiprazole (ref ziprasidone) | 0.084 | 0.904 | 0.009 | 1 | 0.926 | 1.088 | 0.185 | 6.392 |
| Risperidone (ref ziprasidone) | 0.843 | 0.91 | 0.857 | 1 | 0.354 | 2.323 | 0.39 | 13.837 |
| Quetiapine (ref ziprasidone) | 0.219 | 1.034 | 0.045 | 1 | 0.833 | 1.244 | 0.164 | 9.446 |
| Baseline SBP (mm/Hg) | 0.032 | 0.03 | 1.133 | 1 | 0.287 | 1.032 | 0.974 | 1.095 |
| Baseline DBP (mm/Hg) | −0.02 | 0.035 | 0.334 | 1 | 0.564 | 0.98 | 0.916 | 1.049 |
| Baseline glucose (mg/dL) | 0.022 | 0.028 | 0.618 | 1 | 0.432 | 1.022 | 0.968 | 1.08 |
| Baseline Tryglicerides (mg/dL) | 0.016 | 0.008 | 4.08 | 1 | 0.043* | 1.016 | 1 | 1.031 |
| Baseline HDL (mg/dL) | −0.082 | 0.031 | 7.07 | 1 | 0.008* | 0.911 | 0.867 | 0.979 |
| Baseline Waist circumference (cm) | 0.065 | 0.025 | 6.474 | 1 | 0.011* | 1.067 | 1.015 | 1.122 |
| BMI (kg/m2)*** | 0.238 | 0.127 | 3.545 | 1 | 0.060 | 1.269 | 0.99 | 1.627 |
| Glucose 3 years | ||||||||
| Men | 0.441 | 0.486 | 0.825 | 1 | 0.364 | 1.555 | 0.6 | 4.029 |
| >30 years old (median) | 0.679 | 0.457 | 2.204 | 1 | 0.034* | 1.971 | 0.805 | 4.828 |
| Aripiprazole (ref ziprasidone) | 0.347 | 0.709 | 0.239 | 1 | 0.625 | 1.415 | 0.353 | 5.677 |
| Risperidone (ref ziprasidone) | 1.459 | 0.748 | 3.805 | 1 | 0.050 | 4.303 | 0.993 | 18.644 |
| Quetiapine (ref ziprasidone) | 0.539 | 0.831 | 0.42 | 1 | 0.517 | 1.714 | 0.336 | 8.746 |
| Baseline SBP (mm/Hg) | −0.014 | 0.021 | 0.412 | 1 | 0.521 | 0.986 | 0.946 | 1.029 |
| Baseline DBP (mm/Hg) | −0.022 | 0.029 | 0.6 | 1 | 0.439 | 0.978 | 0.924 | 1.035 |
| Baseline glucose (mg/dL) | 0.075 | 0.023 | 10.559 | 1 | 0.001* | 1.078 | 1.03 | 1.128 |
| Baseline Tryglicerides (mg/dL) | 0.007 | 0.006 | 1.67 | 1 | 0.196 | 1.007 | 0.996 | 1.019 |
| Baseline HDL (mg/dL) | −0.029 | 0.016 | 3.196 | 1 | 0.074 | 0.971 | 0.941 | 1.003 |
| Baseline Waist circumference (cm) | 0.047 | 0.028 | 2.719 | 1 | 0.099 | 1.048 | 0.991 | 1.108 |
| BMI (kg/m2)*** | −0.09 | 0.084 | 1.17 | 1 | 0.279 | 0.914 | 0.776 | 1.076 |
| Tryglicerides 3 years | ||||||||
| Men | 0.683 | 0.398 | 2.947 | 1 | 0.086 | 1.981 | 0.908 | 4.322 |
| >30 years old (median) | 0.87 | 0.392 | 4.911 | 1 | 0.027* | 2.386 | 1.106 | 5.149 |
| Aripiprazole (ref ziprasidone) | −0.049 | 0.566 | 0.008 | 1 | 0.931 | 0.952 | 0.314 | 2.885 |
| Risperidone (ref ziprasidone) | −0.388 | 0.612 | 0.402 | 1 | 0.526 | 0.678 | 0.204 | 2.252 |
| Quetiapine (ref ziprasidone) | 0.226 | 0.664 | 0.116 | 1 | 0.734 | 1.253 | 0.341 | 4.604 |
| Baseline SBP (mm/Hg) | −0.013 | 0.022 | 0.34 | 1 | 0.560 | 0.987 | 0.945 | 1.031 |
| Baseline DBP (mm/Hg) | −0.007 | 0.029 | 0.058 | 1 | 0.810 | 0.993 | 0.938 | 1.051 |
| Baseline glucose (mg/dL) | 0.009 | 0.014 | 0.485 | 1 | 0.486 | 1.01 | 0.983 | 1.037 |
| Baseline Tryglicerides (mg/dL) | 0.02 | 0.006 | 11.472 | 1 | 0.001* | 1.021 | 1.009 | 1.033 |
| Baseline HDL (mg/dL) | −0.025 | 0.019 | 1.826 | 1 | 0.177 | 0.975 | 0.94 | 1.011 |
| Baseline Waist circumference (cm) | 0.012 | 0.03 | 0.151 | 1 | 0.697 | 1.012 | 0.954 | 1.073 |
| BMI (kg/m2)*** | 0.075 | 0.072 | 1.065 | 1 | 0.302 | 1.078 | 0.935 | 1.242 |
| Waist circumference | ||||||||
| Men | 0.272 | 0.526 | 0.268 | 1 | 0.604 | 1.313 | 0.469 | 3.679 |
| >30 years old (median) | −0.542 | 0.499 | 1.181 | 1 | 0.277 | 0.582 | 0.219 | 1.545 |
| Aripiprazole (ref ziprasidone) | 1.009 | 0.714 | 1.997 | 1 | 0.158 | 2.742 | 0.677 | 11.111 |
| Risperidone (ref ziprasidone) | 1.251 | 0.79 | 2.509 | 1 | 0.113 | 3.492 | 0.743 | 16.41 |
| Quetiapine (ref ziprasidone) | −0.84 | 0.897 | 0.877 | 1 | 0.349 | 0.432 | 0.075 | 2.504 |
| Baseline SBP (mm/Hg) | −0.048 | 0.024 | 4.078 | 1 | 0.053 | 0.953 | 0.909 | 0.999 |
| Baseline DBP (mm/Hg) | 0.053 | 0.031 | 2.956 | 1 | 0.086 | 1.055 | 0.993 | 1.121 |
| Baseline glucose (mg/dL) | 0.011 | 0.011 | 0.995 | 1 | 0.319 | 1.011 | 0.99 | 1.032 |
| Baseline Tryglicerides (mg/dL) | 0.004 | 0.007 | 0.449 | 1 | 0.503 | 1.004 | 0.992 | 1.018 |
| Baseline HDL (mg/dL) | −0.044 | 0.018 | 6.15 | 1 | 0.013* | 0.957 | 0.925 | 0.991 |
| Baseline Waist circumference (cm) | −0.006 | 0.032 | 0.04 | 1 | 0.842 | 0.994 | 0.934 | 1.057 |
| BMI (kg/m2)*** | 0.591 | 0.124 | 22.715 | 1 | 0.001* | 1.806 | 1.416 | 2.303 |
| High blood pressure 3 years | ||||||||
| Men | 0.519 | 0.412 | 1.586 | 1 | 0.208 | 1.68 | 0.749 | 3.767 |
| >30 years old (median) | 0.128 | 0.412 | 0.097 | 1 | 0.756 | 1.137 | 0.507 | 2.548 |
| Aripiprazole (ref ziprasidone) | −0.649 | 0.692 | 0.879 | 1 | 0.348 | 0.522 | 0.135 | 2.029 |
| Risperidone (ref ziprasidone) | 0.928 | 0.431 | 4.642 | 1 | 0.031* | 2.53 | 1.087 | 5.884 |
| Quetiapine (ref ziprasidone) | −1.983 | 9.176 | 0.244 | 1 | 0.998 | 1.78 | 1.089 | 6.987 |
| Baseline SBP (mm/Hg) | 0.043 | 0.023 | 3.501 | 1 | 0.061 | 1.044 | 0.998 | 1.093 |
| Baseline DBP (mm/Hg) | 0.014 | 0.03 | 0.235 | 1 | 0.628 | 1.014 | 0.957 | 1.075 |
| Baseline glucose (mg/dL) | 0.002 | 0.01 | 0.028 | 1 | 0.867 | 1.002 | 0.982 | 1.022 |
| Baseline Tryglicerides (mg/dL) | 0.005 | 0.006 | 0.575 | 1 | 0.448 | 1.005 | 0.993 | 1.016 |
| Baseline HDL (mg/dL) | −0.006 | 0.015 | 0.166 | 1 | 0.684 | 0.994 | 0.966 | 1.023 |
| Baseline Waist circumference (cm) | 0.052 | 0.027 | 3.632 | 1 | 0.057 | 1.053 | 0.999 | 1.111 |
| BMI (kg/m2)*** | −0.015 | 0.069 | 0.045 | 1 | 0.833 | 0.986 | 0.861 | 1.128 |
| HDL 3 years | ||||||||
| Men | −1.887 | 0.587 | 4.323 | 1 | 0.054 | 0.152 | 0.048 | 0.479 |
| >30 years old (median) | −0.819 | 0.499 | 2.69 | 1 | 0.101 | 0.441 | 0.166 | 1.173 |
| Aripiprazole (ref ziprasidone) | −0.633 | 0.634 | 0.995 | 1 | 0.318 | 0.531 | 0.153 | 1.841 |
| Risperidone (ref ziprasidone) | −0.29 | 0.672 | 0.186 | 1 | 0.667 | 0.749 | 0.200 | 2.796 |
| Quetiapine (ref ziprasidone) | −2.066 | 0.924 | 4.993 | 1 | 0.052 | 0.127 | 0.021 | 0.776 |
| Baseline SBP (mm/Hg) | −0.013 | 0.023 | 0.332 | 1 | 0.564 | 0.987 | 0.943 | 1.032 |
| Baseline DBP (mm/Hg) | 0.039 | 0.033 | 1.405 | 1 | 0.236 | 1.039 | 0.975 | 1.108 |
| Baseline glucose (mg/dL) | 0.019 | 0.012 | 2.564 | 1 | 0.109 | 1.02 | 0.996 | 1.044 |
| Baseline Tryglicerides (mg/dL) | −0.001 | 0.006 | 0.027 | 1 | 0.87 | 0.999 | 0.987 | 1.011 |
| Baseline HDL (mg/dL) | −0.159 | 0.031 | 26.164 | 1 | 0.001* | 0.853 | 0.803 | 0.907 |
| Baseline Waist circumference (cm) | −0.018 | 0.031 | 0.344 | 1 | 0.558 | 0.982 | 0.925 | 1.043 |
| BMI (kg/m2)*** | 0.068 | 0.079 | 0.748 | 1 | 0.387 | 1.071 | 0.917 | 1.25 |
| BMI 3 years | ||||||||
| Men | 0.168 | 0.527 | 3.560 | 1 | 0.038* | 1.183 | 0.421 | 3.322 |
| >30 years old (median) | −0.311 | 0.492 | 0.4 | 1 | 0.527 | 0.732 | 0.279 | 1.922 |
| Aripiprazole (ref ziprasidone) | 1.207 | 0.713 | 2.867 | 1 | 0.090 | 3.342 | 0.827 | 13.507 |
| Risperidone (ref ziprasidone) | 1.338 | 0.788 | 2.884 | 1 | 0.089 | 3.811 | 0.814 | 17.851 |
| Quetiapine (ref ziprasidone) | −0.518 | 0.88 | 0.347 | 1 | 0.556 | 0.596 | 0.106 | 3.341 |
| Baseline SBP (mm/Hg) | −0.059 | 0.024 | 5.815 | 1 | 0.016* | 0.943 | 0.899 | 0.989 |
| Baseline DBP (mm/Hg) | 0.062 | 0.032 | 3.81 | 1 | 0.048* | 1.063 | 1 | 1.131 |
| Baseline glucose (mg/dL) | 0.013 | 0.011 | 1.408 | 1 | 0.235 | 1.013 | 0.992 | 1.034 |
| Baseline Tryglicerides (mg/dL) | 0.001 | 0.007 | 0.01 | 1 | 0.919 | 1.001 | 0.988 | 1.014 |
| Baseline HDL (mg/dL) | −0.047 | 0.018 | 7.235 | 1 | 0.007* | 0.954 | 0.922 | 0.987 |
| Baseline Waist circumference (cm) | −0.015 | 0.033 | 0.203 | 1 | 0.652 | 0.985 | 0.924 | 1.05 |
| BMI (kg/m2)*** | 0.64 | 0.127 | 25.192 | 1 | 0.001* | 1.896 | 1.477 | 2.433 |
Abbreviations: CI, confidence interval. OR, odds ratio. SE, standard error. DF, degree freedom. Ref, reference.
Tables 1 and 2 provide data for mean values of WC, SBP, DBP, glucose, triglycerides and HDL, for both groups, at baseline and 3-years follow-up. We also observed differences between groups in the percentage of individuals in each group reaching some of the MetS criteria: low HDL (FEP 27% vs controls 17.5%, p=0.026), high blood pressure (FEP 29.5% vs controls 4.8%, p=0.001) and elevated WC (FEP 17.6% vs controls 29.5%, p=0.016) (Table 1). Similarly, we observed, among the FEP group, a greater increment in the percentage of subjects reaching any of the individual MetS components.
GlucoseIndividuals meeting the glucose criteria increased from 6.1% to 21.2% (p=0.001) in the FEP group and from 4.8% to 8.1% (p=0.063) in the control group (Table 2). In addition, the prevalence of hyperglycemia increased significantly more in the FEP group than in the control group at 3 years (FEP group 21.2% vs control group 8.1%, p=0.007) (Table 1). Only in the FEP group did the mean value of glucose increase significantly at 3 years, from 86.36mg/dL to 92.67mg/dL (p=0.001) (Table 2). The predictive model showed that being older than 30 years and having baseline glucose altered are factors for the development of hyperglycemia at 3 years (OR=1.97, p=0.034) (Table 3).
LipidsThe prevalence of altered HDL was higher among FEP patients than in controls at both time points (Table 2). Baseline HDL mean value was lower in the FEP group than in the control group (53.55mg/dL vs 57.7mg/dL, respectively; p=0.050), and these differences remained at 3-years follow-up (51.71mg/dL vs 58.30mg/dL, respectively; p<0.001). However, there were not significant differences in the average values of HDL within each group (Table 1). In the FEP group the predictive model showed that only having altered baseline HDL was risk factor for altered HDL at 3 years.
With respect to triglycerides, the baseline prevalence of hypertriglyceridemia (≥150mg/dL) was similar in both groups. However, at 3-years follow-up the prevalence was significantly greater in the FEP group than in the control group (23.3% vs 11.6%, respectively; p=0.020). Triglycerides mean value significantly increased from 85.27mg/dL to 117mg/dL at 3 years in the FEP group (p=0.001) while in the control group it remained similar (Table 2). In the FEP group the predictive model showed that being older than 30 years and having altered baseline tryglicerides were risks factor for the development of hypertriglyceridemia at 3 years (OR=2.386, p=0.027) (Table 3).
Blood pressureThe baseline prevalence of high blood pressure was significantly higher in the FEP group than in controls (29.5% vs 4.3%, p<0.001). However, high blood pressure decreased significantly in FEP and increased significantly in control group, in consequence, we didn’t find differences between FEP and controls at 3 years (Table 1). SBP mean value decreased significantly in the FEP group from 119mmHg to 114mmHg at 3 years (p=0.001) and increased from 106.14mmHg to 114.56mmHg at 3 years in the control group (p=0.001). DBP mean value increased significantly from 62.24mmHg to 70.42mmHg at 3 years in the control group (p=0.001) (Table 2). In FEP group, the predictive model showed that the development of high blood pressure at 3 years was influenced by risperidone treatment (with respect to ziprasidone) (Table 3).
Waist circumferenceThe baseline prevalence of altered WC was lower in the FEP group (19.1% vs 29.5%, p=0.016), but we did not find differences in either group after 3 years (Table 1). WC mean value increased significantly from 83.30cm to 90.67cm at 3 years only in the FEP group (Table 2). In the FEP group, the predictive model showed that the baseline factors increasing the WC at 3 years were being male, having altered BMI and altered HDL (Table 3).
Body mass indexThe baseline prevalence of obesity (BMI≥30kg/m2) was lower in the FEP group (5.7% vs 11.8%, p=0.023), but we did not find differences in either groups after 3 years. However, the prevalence increased significantly only in FEP group from 5.7% to 24.2% (Table 1). In the FEP group, the predictive model showed that the baseline factors increasing the risk of obesity (BMI≥30kg/m2) at 3 years were being male, having altered baseline SBP, DBP, BMI and HDL (Table 3).
DiscussionAfter analyzing the baseline prevalence and clinical correlates of MetS in 244 FEP drug naïve patients and 166 controls and the follow up at 3 years, we found that the FEP group had a worse evolution compared to the control group: (i) the FEP group presented a clear greater increased in MetS prevalence at 3 years compared with controls. At 3-years follow-up the MetS prevalence had increased from 6.6% to 18.3% in the FEP group, while only from 5.4% to 8.1% in the control group; (ii) Altered baseline values of HDL or triglycerides levels or WC were associated to presenting MetS 3 years later regardless of age, sex and type of antipsychotic treatment.
These results are of clinical relevancy, given the fact that the available cardiometabolic algorithms are of little use in FEP population due to several reasons: firstly, this is a population that tends to seek less medical attention, so there is a risk of underdiagnoses bias. On the other hand, certain alterations require a time course to develop the disease, although it is known that despite not reaching diagnostic threshold values, they can be associated with higher mortality and morbidity outcomes in the long term. Therefore, there would be a gap in early intervention for cardiovascular risk prediction in these patients that seems to be inherent to the disease. Subsequently, it is urgent to focus research on the main modifiable risk factors that contribute to these mortality figures. A more systemic understanding of schizophrenia could modify both the clinical evaluation and the treatment offered to these patients in order to prevent and modify not only the neuropsychiatric symptoms but also the set of symptoms that contribute to reducing their life expectancy.
In a more detailed examination, our study showed differences between groups in the individual components of MetS. Thus, among the MetS individual components prevalence, low HDL, hypertriglyceridemia and hyperglycemia were more frequently altered in FEP group than in control group at 3-years follow-up, and this worsening was predicted by different variables: (i) Age was associated to presenting hypertriglyceridemia and hyperglycemia 3 years later. (ii) Prevalence and mean value of HDL was worse in the FEP group compared to control group, not only at baseline assessment but also at 3 years, but this alteration was not influenced by age, sex or treatment. Despite the young age of our sample, the prevalence of MetS increases significantly more in the FEP patients than in the control group. However, as in the general population,32 age over 30 years is a risk factor for hyperglycemia and hypertriglyceridemia.
The association of the use of antipsychotic drugs and MetS is widely known.15 Although antipsychotic medications typically alleviate positive symptoms and delay relapse, metabolic side-effects are particularly common in patients treated with second-generation antipsychotics, especially clozapine and olanzapine.33 In this regard we may assume that the differences between FEP patients and controls in MetS prevalence at 3 years follow-up may be explained in part by the antipsychotic treatment exposure. Moreover, we found that the detection of increased blood pressure at three years is influenced by antipsychotic use. Despite of this we found no significant differences between antipsychotic drugs in the risk of developing MetS at 3 years follow-up. Clinical trials testing the effectiveness of atypical antipsychotics in drug-naïve young individuals, embodying a superlative model for the investigation of new molecular mechanisms underlying type 2 diabetes, hypertriglyceridemia, and other metabolic disturbances, are required to advance in the knowledge of glucometabolic disturbances beyond psychosis population.
With respect to MetS criteria, Garrido-Torres et al. (2021)18 performed individual meta-analyses in studies where both IDF and ATP-IIIA criteria were used to diagnose MetS. They found that MetS prevalence in the same population is higher when diagnosed according to IDF than ATP-IIIA. In the current paper, we found similar results when we used ATP-IIIA criteria and IDF criteria but a higher Baseline MetS prevalence in both FEP and controls using WHO criteria. The pre-established diagnostic parameters in the general population for the diagnosis of MetS could be not useful in patients with a FEP.21,25
There is evidence supporting that the metabolic disturbances in psychosis may begin early, even prior to the antipsychotic exposure. Our results are somehow contrary to this previous evidence since we observed no significant differences between FEP patients and controls in baseline MetS prevalence. On the other hand we did find differences when comparing the individual components of MetS between groups. This is important since some if these individuals components at baseline may be a risk factors for developing MetS in the long-term; thus, our study showed that those FEP patients presenting altered HDL, tryglicerides and WC at baseline, where at greater risk of developing MetS at 3 years follow-up.
These results are in line with previous evidence. Among the MetS components a low HDL cholesterol level and a large WC are accepted as the most strongly correlated with the syndrome.34,35 Measurements of the WC and HDL cholesterol level are recommended for the diagnosis and follow-up of MetS in patients with schizophrenia.34,36 Our results show that from the beginning and up to 3 years, the prevalence and the mean value of HDL is worse in the FEP group than in controls. However, our attention is drawn to the fact that at the intragroup level, there are no changes from the beginning to 3 years, nor influence of sex, age or drug treatment, as there are in the rest of the components. This can be explained by the relationship between the pro-inflammatory state, schizophrenia and MetS.37,38 With regard to dyslipemia, reduced HDL levels are correlated to a high inflammatory set point of monocytes and macrophages.39,40 Likewise, an anti-inflammatory effect has been observed in some antipsychotics. In humans, the immunomodulatory effect of risperidone and aripiprazole has been demonstrated.41 Along these lines, it has been described that the metabolic alterations observed in patients with schizophrenia could be the manifestation of a systemic inflammatory state that may or may not “trigger” in a vulnerable group of patients.42 At a molecular level, other factors are probably contributing to the weight gain and related metabolic alterations observed in psychosis. Crespo-Facorro et al. (2019)43 reported five obesity-related genes (GPER, LTF, MMP8, OLR1, and OLFM4) and four diabetes-related genes (ALPL, LTF, MMP8, and OLR1) to be differentially expressed in patients who received atypical antipsychotic treatment. These results suggest that altered gene expression caused by atypical antipsychotics may contribute to obesity and MetS in these patients.
On the other hand, epigenetic inheritance and prenatal development have recently received considerable attention within the research community as two factors to consider in the etiopathogenesis of obesity in the general population44 and in individuals with mental disorders.45 In this sense, a relationship between obesity, childhood maltreatment, and elevated inflammatory markers in adults with schizophrenia has been demonstrated.46 Therefore, the relationship between early life stress, fetal metabolic programming and schizophrenia47 through epigenetic markers has been established. Consequently, stressful psychosocial experiences in utero and/or during childhood can be interpreted as potentially modifiable risk factors.
Some limitations in this study should be noted. First, unfortunately, it is uncertain whether the patients have fully complied with antipsychotic treatment throughout the 3-years study period. Second, for antipsychotic comparisons we have followed and intention-to treat approach and clustered the FEP patients according to their prescribed antipsychotic at baseline, without considering that patients may have been changed to another antipsychotic during the study period since we could not perform per-protocol analysis. The type of antipsychotic included were at different risk for developing cardiovascular events, for instance risperidone is different from aripiprazole48; and third, we could not include into the analyses other variables known to affect weight change and MetS, such as diet and exercise. On the other hand, the study counts with relevant strengths. For instance, our study is a representative sample of naïve FEP patients and controls with 3-year follow-up of metabolic syndrome and related components.
In conclusion, patients with FEP present a similar prevalence of MetS, but with a higher prevalence of metabolic alterations than controls before the start of antipsychotic treatment. However, at 3 years, the prevalence of MetS is higher in FEP than in controls.
Finally, in this work, we propose a predictive model of MetS at 3 years in 244 drug-naïve patients with FEP, in which altered WC, HDL and triglycerides at baseline predicted the presence of full MetS after 3-years of initiating antipsychotic treatment. Our findings support the need for interventions to improve factors related to the physical health of FEP individuals.
Authors’ contributionsNG-T managed the literature searches, undertook the statistical analyses and wrote the first draft of the manuscript. BC-F designed the study, wrote the protocol, obtained the financial support and evaluated the patients. JV-B contributed to the interpretation of the data, contributed to the first draft of the manuscript and revised the manuscript critically. MR-V, JOM, ARG, MC-R, MG-R, MJ-R and RA-A revised the manuscript critically. All authors have revised and approved the final manuscript.
Role of funding sourceThe present study was carried out at the Hospital Marqués de Valdecilla, University of Cantabria, Santander, Spain, under the following grant support: the Instituto de Investigación Sanitaria Valdecilla (grant numbers INT/A20/04 and INT/A21/10), and the Instituto de Salud Carlos III (grant numbers PI020499, PI050427 and PI060507).
Unrestricted educational and research grants from AstraZeneca, Pfizer, Bristol-Myers Squibb, and Johnson & Johnson provided support for PAFIP activities. No pharmaceutical industry or institutional sponsors participated in the study concept and design, data collection, analysis and interpretation of the results, and drafting the manuscript.
Conflicts of interestNG-T, MR-V, JOM, ARG, MC-R, MG-R, MJ-R and RA-A report no conflicts of interest. BC-F has received unrestricted research funding from Instituto de Salud Carlos III, MINECO, Gobierno de Cantabria, Centro de Investigación Biomédica en Red de Salud Mental (CIBERSAM), from the 7th European Union Framework Program and Lundbeck. He has also received honoraria for his participation as a consultant and/or as a speaker at educational events from Janssen Johnson & Johnson, Lundbeck, and Otsuka Pharmaceuticals. JV-B has received unrestricted research funding from Instituto de Investigación Marqués de Valdecilla (IDIVAL). He has also received honoraria for his participation as a consultant and/or as a speaker at educational events from Janssen-Cilag and Lundbeck.
The authors wish to thank all “Programa Asistencial de las Fases Iniciales de Psicosis” (PAFIP) research team and all patients and family members who participated in the study.
The following are the supplementary data to this article: