


There are only few publications related to body composition in Down syndrome (DS).
ObjectiveEvaluate the relationship between indicators of nutrition assessment by Catalan references and CDC/NCHS and indicators of body composition, and compare the concordance between weight/height index (WHI), body mass index/age (BMIa) and weight/age (WA) to evaluate nutritional status in children with DS.
Materials and methodsAnalytical cross-sectional study in which 40 children with DS, 20 girls and 20 boys between 3 and 13 years old were studied. Anthropometric measurements were performed to obtain indicators of nutrition assessment as WHI, BMIa and WA and indicators of subcutaneous and visceral fat and muscular compartment. Correlation tests and Kappa index were evaluated to establish relationship and agreement respectively.
ResultsThe nutrition assessment in children with DS shows that 60% presents overweight and obesity according to BMIa, and 75% according to WHI. Correlation analysis indicates that waist circumference, fat brachial area, % fat mass by Slaughter and Weststrate and Deurenberg have a high positive correlation with BMIa (P-value<0.05). A logistic regression model showed that no indicator of fat mass is clinically significant in predicting an increase of the indicator WA. It was determined that the BMIa and WHI indicators have a higher concordance (Kappa=0.59; P=0.0000).
ConclusionsWe determined a high correlation between nutritional diagnosis (BMIa and WA) with indicators of visceral fat (waist circumference) and subcutaneous (% fat mass and fat brachial area) in children with DS. A greater agreement was found between indicators of BMIa and WA suggesting that they are optimal for assessing the nutritional status.
Existen pocas publicaciones en relación a la composición corporal en niños con síndrome de Down (SD).
ObjetivosEvaluar la relación entre los indicadores del estado nutricional (EN) –utilizando referencias catalanas y del CDC/NCHS – y los indicadores de la composición corporal, y comparar la concordancia entre los índices peso/talla (IP/T), índice de masa corporal/edad (IMC/E), y peso/edad (P/E) para evaluar el estado nutricional en niños con SD.
Materiales y métodosEstudio analítico de corte transversal en el que se estudiaron 40 niños con SD, 20 niñas y 20 niños de edades comprendidas entre 3 y 13 años. Se realizaron mediciones antropométricas para obtener indicadores del estado nutricional tales como IP/T, IMC/E y P/E, e indicadores de grasa visceral y subcutánea y del compartimiento muscular. Se evaluaron las pruebas de correlación y el índice de Kappa para establecer relación y concordancia, respectivamente.
ResultadosLa evaluación nutricional realizada en niños con SD muestra que el 60% presenta sobrepeso y obesidad, según el indicador IMC/E, porcentaje que alcanza el 75% según el índice IP/T. El análisis de correlación indica que la circunferencia de la cintura, el área de grasa braquial, y el % de masa grasa según Slaughter y Weststrate y Deurenberg, muestran una alta correlación positiva con el IMC/E (p<0,05). Un modelo de regresión logística reflejó que ningún indicador de la masa grasa es clínicamente significativo para predecir el incremento del indicador P/E. Se determinó que los indicadores IMC/E e IP/T tienen una mayor concordancia (Kappa=0,59; p=0,0000).
ConclusiónDeterminamos una alta correlación entre el diagnóstico nutricional (IMC/E e IP/T) y los indicadores de las grasas visceral (circunferencia de la cintura) y subcutánea (porcentaje de masa grasa y de área grasa braquial) en niños con SD. Se encontró una mayor concordancia entre los indicadores de IMC/E e IP/T, lo que sugiere que estos son óptimos para evaluar el estado nutricional.
Down syndrome (DS) is a genetic disorder caused by the presence of extra material in chromosome 21, affecting 2.93 per 1000 live Chilean newborns.1,2 It is associated with intellectual disability and with various medical conditions.3
Children with DS are shorter than children without DS.4,5 Some studies propose that children with DS with moderate to severe cardiac abnormalities are shorter than those who present slight abnormalities or absence of them. However, other studies find no association.4 It is postulated that the deficiency in growth would be related to a predisposition to overweight.6
Growth standards for the general population are not appropriate for individuals with DS, given that their use could diagnose nutritional status (NS) incorrectly.5,7 That is the reason why some countries have developed growth cures for this population (USA, UK and Ireland).8 A proposal for using the growth standards for Spanish children with DS, developed by the Fundación Catalana [Catalan Foundation],2,9,10 is currently being discussed in Chile. These standards are considered as the most appropriate for the Chilean population, given that they were designed based on a Hispanic population; however, they have the important limiting factor of the absence of the weight/height (WHI) indicator or body mass index/age (BMIa). The Pinhiero et al. study9 on Chilean children with DS established the need to carry out a body composition study in this group to validate the diagnoses provided by the Spanish standard.
There is little information on body composition in DS.11 Gonzalez-Aguero et al.12 reported high levels of total and regional fat mass in Spanish children with DS. Similar results were observed in children from New Zealand, with significant differences in fat mass percentage (FM%) between males and females.11
High prevalence of malnutrition by excess (overweight and obesity) has been published for children with DS, approximately 30–50%.11 Various mechanisms are postulated, such as hypothyroidism, leptin resistance, low energy consumption at rest, sedentary lifestyle and high energy intake, with the last two being the greatest contributors in excessive weight gain.13 In the last few decades, life expectancy in individuals with DS has increased, producing important complications associated with excessive body fat, such as type 2 diabetes and cardiovascular diseases.3,12 That is the reason why our objectives were to assess NS and body composition in children with DS using anthropometric techniques, to establish the relationship between NS as diagnosed by Catalan DS Foundation, BMIa and WHI (Centers for Disease Control and Protection, CDC/National Center for Health Statistics, NCHS) with body composition indicators and to compare the agreement among the various indicators to evaluate NS in children with DS.
Patients and methodsThis was a transversal analytical study. The sample was collected by simple randomized sampling in the Instituto Down de Concepción (Chile). Sample size was calculated with the finite population formula, with 95% confidence, 5% sampling error and 50% maximum variance, which yielded a sample of 42 children; the sample was finally set with 40 children, with 2 children being excluded for non-attendance on the measurement day. Ages ranged from 3 to 13 years old, with an average age of 6.5±2.2 standard deviations. The children consisted of 40% preschoolers, 52% school-aged children and 8% adolescents, of which 50% corresponded to each gender. Informed consent was obtained from the parents or tutors.
Previously standardized techniques were used to measure weight, height, body circumferences and skinfolds. Weight and height were determined with a scale with height rod (Seca 700 model with 50g readability and 1mm precision). Circumferences and skinfolds were measured 3 times, using an inextensible tape measure and a LANGE skinfold calliper with a precision of 0.2mm.
Using weight and height three indicators were considered to assess NS: weight-for-age (WA) and height-for age (HA) with Catalan Foundation references,10 BMIa with CDC/NCHS references14 and WHI (percentage of ideal weight at the 50th percentile (50p) of the real height of the CDC/NCHS children).
Cut-off points for the NS classification were: low weight (<10p), normal weight (>10p≤90p), overweight (90p≤97p) and obesity (>97p) for WA with the Catalan standard.10 In the case of BMI, the following cut-off points were used: low weight (<10p), normal weight (>10p≤85p), overweight (>85p≤95p) and obesity (≥95p). For WHI (percentage of weight in the 50th percentile of the real height of children in the CDC/NCHS curves) in the classification we used: <90% low weight, 90–110% normal weight, 110–120% overweight, >120% obesity.15
The tricipital skinfold (TSF) and mid-upper arm circumference (MUAC) indicators obtained were: mid-upper arm muscle circumference (MUAMC), mid-upper arm muscle area and mid-upper arm fat area (MUAFA). These indicators were classified according to Frisancho's proposal16 as very low (<5p), low (5p≤10p), normal (10p≤90p), high (90p≤95p) and very high (>95p).
Subcutaneous fat was estimated through FM%, TSF and MUAFA. The equations by Slaughter (SFM%)17 and Weststrate and Deurenberg (WDFM%)18 were used to determine FM%, which was then compared with what was proposed in the Freedman classification (Table 1).19
To estimate visceral fat the waist circumference (WC) was determined, using the references of Fernandez et al.20 The classifications were risk free (<75p), moderate risk (75p≤90p) and high risk (≥90p).
Statistical analysis testsHeterogeneity was assessed using Levene's test and normality was assessed using the Shapiro–Wilk test. To compare continuous variables Student's t-test was performed when the information was distributed normally and the Mann–Whitney test was used for non-normally distributed data. To establish association the Pearson correlation was used for the dependent variable WHI and the independent variables MUAFA, TSF, SFM%, WDFM% and WC, while Spearman's correlation was used for the dependent variable BMIa and the independent variables MUAFA, TSF, SFM%, WDFM% and WC. Logistic regression was performed to determine the probability of occurrence of obesity by the WA indicator (binary variable) according to independent variables. Agreement among NS indicators was assessed using the kappa coefficient. Descriptive statistics and parametric and non-parametric tests were carried out using STATA software (Release 12, 2011, StataCorp LP). Statistical significance was considered to be P<0.05.
ResultsA total of 40 children were assessed, 20 boys and 20 girls, with a mean age of 6.6±2.6 years (3–13 years) and 6.4±1.8 years (3–10.5 years) respectively. Three children showed short stature for the age.
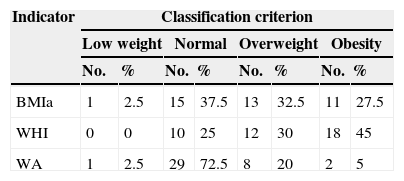
The nutritional status, through the anthropometrical evaluation of the children with DS studied, revealed that 60% of them had an NS of malnutrition by excess according to the BMIa indicator and 75% according to WHI, while 25% of the sample presented NS by excess with the WA indicator. The nutritional assessment and its classification are shown in Table 2.
Distribution and classification of nutritional status according to the BMIa, WHI and WA indicators.
| Indicator | Classification criterion | |||||||
|---|---|---|---|---|---|---|---|---|
| Low weight | Normal | Overweight | Obesity | |||||
| No. | % | No. | % | No. | % | No. | % | |
| BMIa | 1 | 2.5 | 15 | 37.5 | 13 | 32.5 | 11 | 27.5 |
| WHI | 0 | 0 | 10 | 25 | 12 | 30 | 18 | 45 |
| WA | 1 | 2.5 | 29 | 72.5 | 8 | 20 | 2 | 5 |
BMIa: body mass index by age; WHI: weight-for-height index; WA: weight/age.
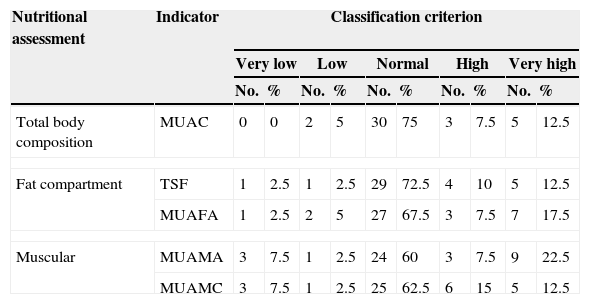
Body composition evaluation using the anthropometric indicators of fat compartment and muscle protein compartment can be seen in Table 3. The majority of children with DS are found within criteria of normality, followed by high and very high states for both fat and muscle compartments.
Distribution and classification of body composition of 40 children with Down syndrome.
| Nutritional assessment | Indicator | Classification criterion | |||||||||
|---|---|---|---|---|---|---|---|---|---|---|---|
| Very low | Low | Normal | High | Very high | |||||||
| No. | % | No. | % | No. | % | No. | % | No. | % | ||
| Total body composition | MUAC | 0 | 0 | 2 | 5 | 30 | 75 | 3 | 7.5 | 5 | 12.5 |
| Fat compartment | TSF | 1 | 2.5 | 1 | 2.5 | 29 | 72.5 | 4 | 10 | 5 | 12.5 |
| MUAFA | 1 | 2.5 | 2 | 5 | 27 | 67.5 | 3 | 7.5 | 7 | 17.5 | |
| Muscular | MUAMA | 3 | 7.5 | 1 | 2.5 | 24 | 60 | 3 | 7.5 | 9 | 22.5 |
| MUAMC | 3 | 7.5 | 1 | 2.5 | 25 | 62.5 | 6 | 15 | 5 | 12.5 | |
MUAC: mid-upper arm circumference; MUAFA: mid-upper arm fat area; MUAMA: mid-upper arm muscle area; MUAMC: mid-upper arm muscle circumference; TSF: tricipital skinfold.
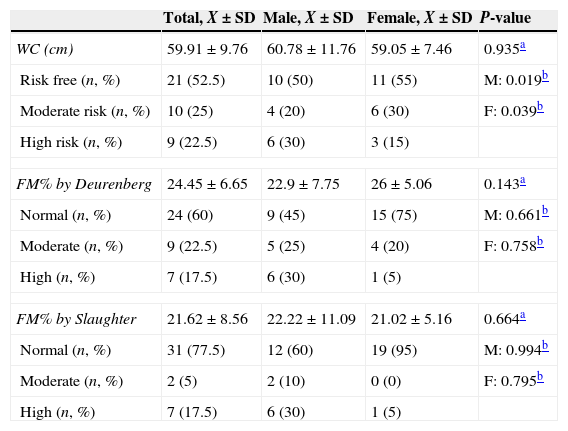
When the differences by gender were compared with the fat behaviour indicators, no statistically significant differences were found. Likewise, upon comparing the body composition of the sample using SFM% and WDFM%, none of the indicators presented statistical significance on comparing by gender and age (younger than 9 years old) with the reference population.19 However, on comparing mean WC by gender in preschoolers with the reference population,20 the boys and girls with DS presented a higher mean WC. This difference was statistically significant (the results for school-age children are not shown as no clinical significance was found). The results are shown in Table 4.
Differences by gender and by reference population according to various fat mass indicators.
| Total, X±SD | Male, X±SD | Female, X±SD | P-value | |
|---|---|---|---|---|
| WC (cm) | 59.91±9.76 | 60.78±11.76 | 59.05±7.46 | 0.935a |
| Risk free (n, %) | 21 (52.5) | 10 (50) | 11 (55) | M: 0.019b |
| Moderate risk (n, %) | 10 (25) | 4 (20) | 6 (30) | F: 0.039b |
| High risk (n, %) | 9 (22.5) | 6 (30) | 3 (15) | |
| FM% by Deurenberg | 24.45±6.65 | 22.9±7.75 | 26±5.06 | 0.143a |
| Normal (n, %) | 24 (60) | 9 (45) | 15 (75) | M: 0.661b |
| Moderate (n, %) | 9 (22.5) | 5 (25) | 4 (20) | F: 0.758b |
| High (n, %) | 7 (17.5) | 6 (30) | 1 (5) | |
| FM% by Slaughter | 21.62±8.56 | 22.22±11.09 | 21.02±5.16 | 0.664a |
| Normal (n, %) | 31 (77.5) | 12 (60) | 19 (95) | M: 0.994b |
| Moderate (n, %) | 2 (5) | 2 (10) | 0 (0) | F: 0.795b |
| High (n, %) | 7 (17.5) | 6 (30) | 1 (5) | |
F: female; M: male; FM%: percentage of fat mass; SD: standard deviation; WC: waist circumference.
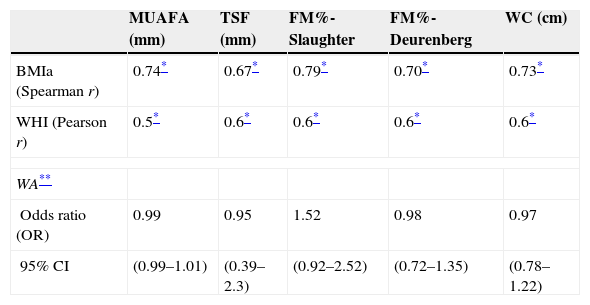
Table 5 reflects the degree of correlation among independent fat mass and NS indicators. It can be seen that WC, SFM% and WDFM% and MUAFA present high positive correlation with BMIa, being statistically significant (P-value <0.005), while TSF presents moderate correlation. Likewise, all the fat mass indicators are moderately correlated with the WHI indicator. Fig. 1 and Fig. 2 reflects the lineal association of an adjusted model between the dependent variable BMIa and independent variables such as SFM%, WDFM% and WC. Logistic regression model results demonstrated that no fat mass indicator is clinically significant in predicting an increase in the WA indicator.
Correlation between dependent and independent variables for fat mass.
| MUAFA (mm) | TSF (mm) | FM%-Slaughter | FM%-Deurenberg | WC (cm) | |
|---|---|---|---|---|---|
| BMIa (Spearman r) | 0.74* | 0.67* | 0.79* | 0.70* | 0.73* |
| WHI (Pearson r) | 0.5* | 0.6* | 0.6* | 0.6* | 0.6* |
| WA** | |||||
| Odds ratio (OR) | 0.99 | 0.95 | 1.52 | 0.98 | 0.97 |
| 95% CI | (0.99–1.01) | (0.39–2.3) | (0.92–2.52) | (0.72–1.35) | (0.78–1.22) |
CI: confidence interval; FM%: percentage of fat mass; MUAFA: mid-upper arm fat area; TSF: tricipital skinfold; WC: waist circumference.


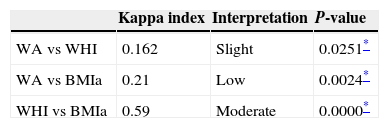
Table 6 shows that the indicators BMIa and WHI presented a greater degree of agreement (29 out of 40 diagnoses), while the indicator WA had slight agreement with WHI (13 out of 40 diagnoses) and low with BMIa (19 of 40 diagnoses). These results demonstrate that BMIa and WHI are useful for assessing NS in children with DS.
DiscussionThis is the first Chilean study to assess body composition in children with DS using anthropometry, given that most of the studies published to date have assessed only NS. In Chile there is a proposal to use the references of the Catalan Foundation to assess nutritional status in children with DS.2,9,10 These references rely on the indicators WA and HA to make the nutritional diagnosis, with the absence of the P/T or BMIa indicators being a serious limitation.9 According to this reference 25% of our sample presented malnutrition by excess based on WA, in contrast to 60% with BMIa and 75% with WHI. A similar result was found in the Chilean study in the city of Temuco, where 61.8% malnutrition by excess was reported, with BMIa being the only indicator used.21 In contrast, in the Pinhiero et al. study,9 using a representative sample of children with DS in the cities of Santiago, Curicó, Rancagua and Chillán, it was observed that 17.2% of the children with DS were overweight based on WA but that only 19.2% presented excess weight with BMIa. We believe that assessing with WA underestimates the diagnosis of malnutrition by excess, in contrast to BMIa and WHI.
According to the equations by Slaughter 20% of our sample presented moderate and high FM%, while this value was 40% according to the equations by Weststrate and Deurenberg. It is important to point out that both equations correlated positively with BMIa. At the same time, a high subcutaneous fat compartment was observed. Similar results have been reported with more sophisticated techniques, such as bone densitometry, air-displacement plethysmography and bioimpedance analysis.11,12,22 However, there are contradictory results in the Gonzalez-Aguero review.22 We did not find any differences in fat compartment by sex. In contrast, in the study on Spanish children with DS12 significant differences between genders were shown, with the females having higher values than the males, and the same result was reported in adolescents from New Zealand with DS.11
Insofar as the WC indicator, nearly 48% of sample presented cardiovascular risk. The WC measurement as an indicator of visceral fat and cardiovascular risk is important, for the identification and prevention of metabolic complications.20 The WC indicator was seen to have high correlation with BMIa and WHI indicators, as was similarly reported in the Chilean study on children and adolescents with DS.21 In contrast, in the study on Spanish adolescents with DS, WC was too imprecise to detect excess adipose tissue in this population.12
Moderate agreement was found between WHI and BMIa, unlike WA. Pinhiero et al.9 found the same diagnostic disagreement between WA and BMIa in their study. At the same time, BMIa and WHI correlated highly with most of the fat mass indicators, except for TSF, which had moderate correlation. A similar result was found in youngsters from the USA with DS, where BMI was shown to be a good predictor of fat behaviour (71% sensitivity and 96% specificity).8 We feel that these results are important because they make it possible to suggest that, for children and adolescents with DS, an assessment that includes all these indicators of overall nutritional status and fat compartment should be performed to identify children with DS with excess body fat.
We consider that our study had the following limitations: sample size that limited subgroup analysis, use of fat mass indicators through anthropometry instead of more sophisticated techniques, use of children without DS to estimate FM%, use of cut-off points for FM% and WC classification in populations not having DS and, lastly, use of only the CDC/NCHS references for all the age groups.
In conclusion, we can establish high correlation between nutritional diagnosis (BMIa and WHI) with visceral fat (WC) and subcutaneous fat indicators (SFM%, WDFM% and MUAFA) in children with DS. Greater agreement was found between the BMIa and WHI indicators, suggesting that these are ideal for assessing nutritional status.
FundingThere is no funding of any type granted for this publication.
Conflict of interestsThe authors have no conflicts of interest to declare.
Instituto Down de Concepción (Chile).