


Study of anthropometric values in the medical records of a representative group of paediatric patients with Down syndrome, from the Down syndrome Unit of the Paediatric Department of Valencia's Hospital Clínico Universitario, from 2000 to 2014.
Patients and methodsDescriptive observational study in a group of 140 patients between 1 and 13 years. The group was configured based on the inclusion and exclusion criteria. We extracted data about birth from their first visit, and subsequently patient data at the time of each visit (643 measurements).
Results103 patients with regular trisomy of Down syndrome were recorded and studied. There were 59 (57%) boys and 44 (43%) girls. The records were then analysed and percentiles were calculated.
DiscussionThe median was compared to that of percentiles from the Catalan Down Syndrome Foundation.
ConclusionsWe present an observational study with anthropometric measurements of a group of Down syndrome children from Valencia. Measurements were lower than those of the WHO for the general population, but similar to those recorded by the Catalan Down Syndrome Foundation. The need to continue using customised Down syndrome percentiles is reaffirmed, with periodic review of these tables.
Estudio de los valores antropométricos registrados en las historias clínicas de un grupo representativo de pacientes en edad pediátrica en la Unidad de Síndrome de Down del Servicio de Pediatría del Hospital Clínico Universitario de Valencia, entre los años 2000 y 2014, inclusive.
Pacientes y métodosEstudio observacional descriptivo en una muestra de 140 pacientes de entre 1 y 13 años. La muestra se configuró a partir de los criterios de inclusión y de exclusión. Se extrajeron del informe de la primera visita, los datos relevantes referentes al nacimiento y, de las visitas sucesivas (643 mediciones), el estado del paciente en dicho momento.
ResultadosSe estudiaron 103 pacientes con síndrome de Down portadores de trisomía regular, que superaron los criterios de inclusión y exclusión, cuya distribución por sexos corresponde a 59 (57%) niños y 44 (43%) niñas. Posteriormente, se analizaron, obteniendo percentiles.
DiscusiónSe comparó la mediana con aquella de los percentiles propuestos por la Fundación Catalana Síndrome de Down.
ConclusionesPresentamos un estudio observacional con las mediciones antropométricas de una muestra de pacientes menores con síndrome de Down de la población valenciana.
Las medidas han sido inferiores a las de la población general, pero similares a las de los pacientes del estudio de la Fundación Catalana Síndrome de Down. Se reafirma la necesidad de continuar empleando unas tablas percentiladas propias para la población con síndrome de Down, siendo necesaria una revisión periódica de dichas tablas.
Over time height and weight studies have been made for the general population using graphs that can help us to assess children's growth.1 As a result many diseases are diagnosed, and anticipated in time. Classification in percentiles has also helped to objectively compare the patient with other children of the same age. Although this classification is actually artificial, it can be very useful on occasions. Progressive percentile reduction may become one of the earliest indicators of an illness which affects the patient's growth. One health trait of a boy or a girl is that their anthropometric measurements match their age according to their gender.
The percentile graphs used in paediatric clinics in Spain are those proposed by the WHO for the European population. They appear on healthcare posters of the majority of the autonomous communities.2,3
For children with Down syndrome the American Association4 tables are used, which are far removed from the Spanish population,5 and also those from the Catalan Down Syndrome Foundation from 2003/2010.
For many years it has been observed, but not registered, that there are increasingly higher percentiles in boys and girls who attend the Down Syndrome Unit of Valencia's Hospital Clínico Universitario. This suggests that the tables used up until then did not correspond with the actual reality of Down syndrome children and it was therefore necessary to revise the standard anthropometric data for these children. Our contribution is sustained and valuable because to our knowledge there is no mention of any study in the literature which updates anthropometric data of Spanish patients with Down syndrome during the last decade, except the above-mentioned one from the Catalan Down's Syndrome Foundation.
There was a need to accurately determine anthropometric data (weight, height, cranial perimeter) of children with Down syndrome in Valencia. It was also of interest to compare the said measurements with values observed in previous studies.
Patients and methodsSample selectionThe medical records of patients with Down syndrome who were attended at the Down Syndrome clinic of Valencia's Hospital Clínico Universitario. The records of children born with Down syndrome between 2000 and 2013 were analysed and a prospective follow-up of these patients was made, to which they voluntarily agreed, throughout their visits to the Down Syndrome Unit of Valencia's Hospital Clínico Universitario.
The initial sample was a total of 140 patients.
Exclusion criteria- •
Prematurity with gestational age of 34 weeks or less.
- •
Trisomy mosaicism and translocation.
- •
Serious pathology, with heart disease or digestive disorders, which interfered with growth.
- •
Exitus.
Written data from medical records was collected in MSExcel® 2011 format, and coded to uphold patient anonymity. It was subsequently processed with the SPSS®, version 22 programme.
The gestational age, comorbidities at birth and karyotype presented by the patient were extracted from the first visit of children born between 2000 and 2013.
Information was obtained in each visit made, of the following items: height, weight, cranial perimeter and the appearance of other pathologies. With regard to cranial perimeter, this was taken into account up to 6 years of age, due to lack of measurements.
Data analysisA total of 643 measurements were taken. Height and weight were the main ones, but the recordings of cranial perimeter dropped after the age of 4. Age groups were formed by all the children in each year and up to 11.9 months of that same year. The following was obtained from gender and age: mean, standard deviation and percentiles 3, 10, 25, 50, 75, 90 and 97.
ResultsIn total, 103 patients surpassed exclusion criteria: 59 boys (57%) and 44 girls (43%).
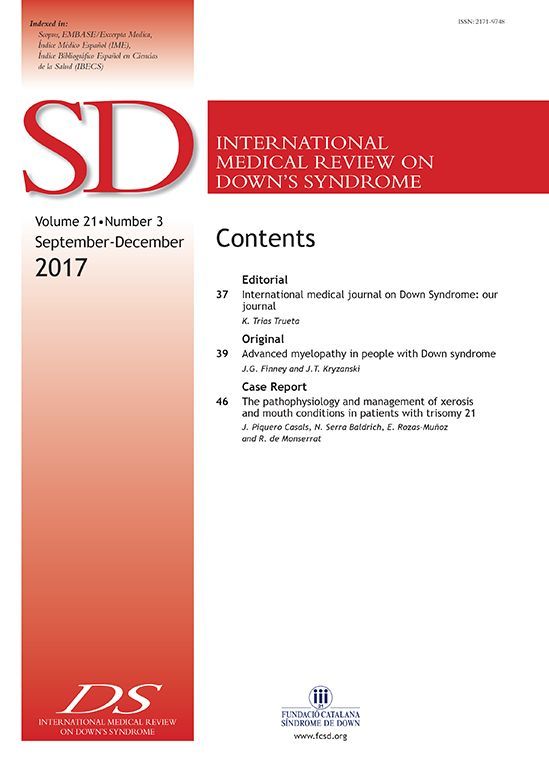
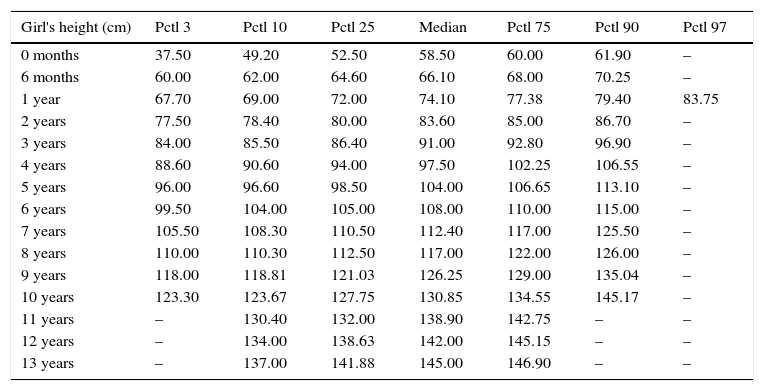
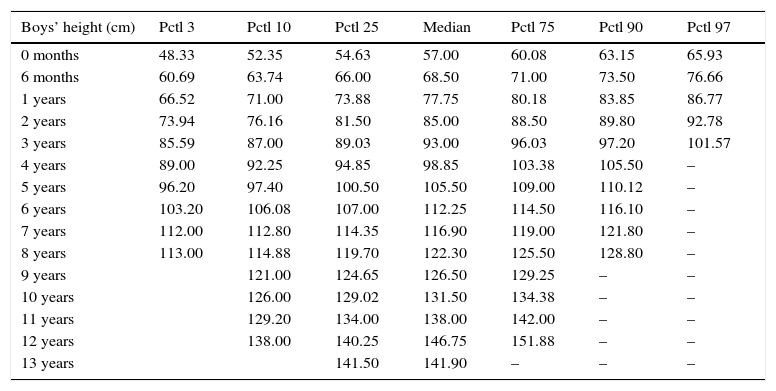
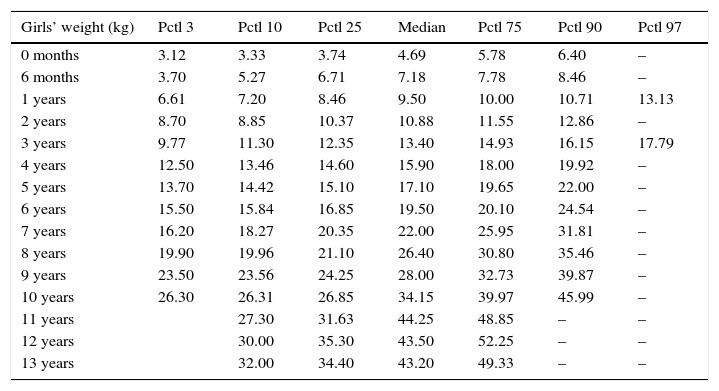
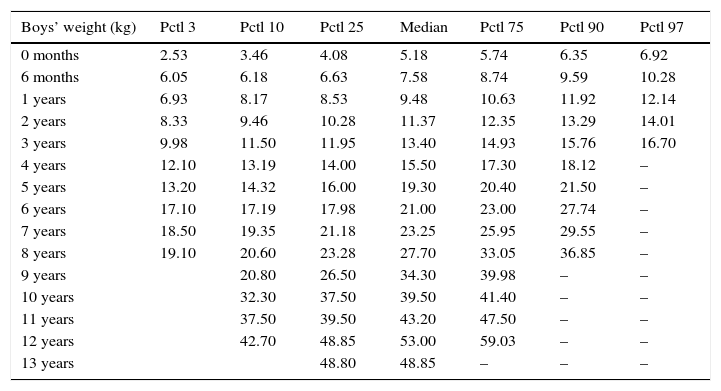
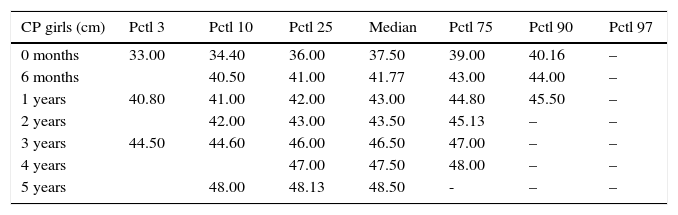
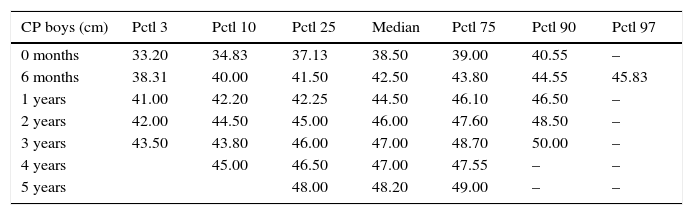
The results are presented and grouped by variables and gender. For each variable and gender the calculated percentiles are shown (Tables 1–6 and Figs. 1–6). The categories in which the number of measurements was insufficient for the estimation of all percentiles was left blank.
Percentiles of height obtained for girls with Down syndrome up to 14 years of age.
| Girl's height (cm) | Pctl 3 | Pctl 10 | Pctl 25 | Median | Pctl 75 | Pctl 90 | Pctl 97 |
|---|---|---|---|---|---|---|---|
| 0 months | 37.50 | 49.20 | 52.50 | 58.50 | 60.00 | 61.90 | – |
| 6 months | 60.00 | 62.00 | 64.60 | 66.10 | 68.00 | 70.25 | – |
| 1 year | 67.70 | 69.00 | 72.00 | 74.10 | 77.38 | 79.40 | 83.75 |
| 2 years | 77.50 | 78.40 | 80.00 | 83.60 | 85.00 | 86.70 | – |
| 3 years | 84.00 | 85.50 | 86.40 | 91.00 | 92.80 | 96.90 | – |
| 4 years | 88.60 | 90.60 | 94.00 | 97.50 | 102.25 | 106.55 | – |
| 5 years | 96.00 | 96.60 | 98.50 | 104.00 | 106.65 | 113.10 | – |
| 6 years | 99.50 | 104.00 | 105.00 | 108.00 | 110.00 | 115.00 | – |
| 7 years | 105.50 | 108.30 | 110.50 | 112.40 | 117.00 | 125.50 | – |
| 8 years | 110.00 | 110.30 | 112.50 | 117.00 | 122.00 | 126.00 | – |
| 9 years | 118.00 | 118.81 | 121.03 | 126.25 | 129.00 | 135.04 | – |
| 10 years | 123.30 | 123.67 | 127.75 | 130.85 | 134.55 | 145.17 | – |
| 11 years | – | 130.40 | 132.00 | 138.90 | 142.75 | – | – |
| 12 years | – | 134.00 | 138.63 | 142.00 | 145.15 | – | – |
| 13 years | – | 137.00 | 141.88 | 145.00 | 146.90 | – | – |
Percentiles of height obtained for boys with Down syndrome up to 14 years of age.
| Boys’ height (cm) | Pctl 3 | Pctl 10 | Pctl 25 | Median | Pctl 75 | Pctl 90 | Pctl 97 |
|---|---|---|---|---|---|---|---|
| 0 months | 48.33 | 52.35 | 54.63 | 57.00 | 60.08 | 63.15 | 65.93 |
| 6 months | 60.69 | 63.74 | 66.00 | 68.50 | 71.00 | 73.50 | 76.66 |
| 1 years | 66.52 | 71.00 | 73.88 | 77.75 | 80.18 | 83.85 | 86.77 |
| 2 years | 73.94 | 76.16 | 81.50 | 85.00 | 88.50 | 89.80 | 92.78 |
| 3 years | 85.59 | 87.00 | 89.03 | 93.00 | 96.03 | 97.20 | 101.57 |
| 4 years | 89.00 | 92.25 | 94.85 | 98.85 | 103.38 | 105.50 | – |
| 5 years | 96.20 | 97.40 | 100.50 | 105.50 | 109.00 | 110.12 | – |
| 6 years | 103.20 | 106.08 | 107.00 | 112.25 | 114.50 | 116.10 | – |
| 7 years | 112.00 | 112.80 | 114.35 | 116.90 | 119.00 | 121.80 | – |
| 8 years | 113.00 | 114.88 | 119.70 | 122.30 | 125.50 | 128.80 | – |
| 9 years | 121.00 | 124.65 | 126.50 | 129.25 | – | – | |
| 10 years | 126.00 | 129.02 | 131.50 | 134.38 | – | – | |
| 11 years | 129.20 | 134.00 | 138.00 | 142.00 | – | – | |
| 12 years | 138.00 | 140.25 | 146.75 | 151.88 | – | – | |
| 13 years | 141.50 | 141.90 | – | – | – |
Percentiles of weight obtained for girls with Down syndrome up to 14 years of age.
| Girls’ weight (kg) | Pctl 3 | Pctl 10 | Pctl 25 | Median | Pctl 75 | Pctl 90 | Pctl 97 |
|---|---|---|---|---|---|---|---|
| 0 months | 3.12 | 3.33 | 3.74 | 4.69 | 5.78 | 6.40 | – |
| 6 months | 3.70 | 5.27 | 6.71 | 7.18 | 7.78 | 8.46 | – |
| 1 years | 6.61 | 7.20 | 8.46 | 9.50 | 10.00 | 10.71 | 13.13 |
| 2 years | 8.70 | 8.85 | 10.37 | 10.88 | 11.55 | 12.86 | – |
| 3 years | 9.77 | 11.30 | 12.35 | 13.40 | 14.93 | 16.15 | 17.79 |
| 4 years | 12.50 | 13.46 | 14.60 | 15.90 | 18.00 | 19.92 | – |
| 5 years | 13.70 | 14.42 | 15.10 | 17.10 | 19.65 | 22.00 | – |
| 6 years | 15.50 | 15.84 | 16.85 | 19.50 | 20.10 | 24.54 | – |
| 7 years | 16.20 | 18.27 | 20.35 | 22.00 | 25.95 | 31.81 | – |
| 8 years | 19.90 | 19.96 | 21.10 | 26.40 | 30.80 | 35.46 | – |
| 9 years | 23.50 | 23.56 | 24.25 | 28.00 | 32.73 | 39.87 | – |
| 10 years | 26.30 | 26.31 | 26.85 | 34.15 | 39.97 | 45.99 | – |
| 11 years | 27.30 | 31.63 | 44.25 | 48.85 | – | – | |
| 12 years | 30.00 | 35.30 | 43.50 | 52.25 | – | – | |
| 13 years | 32.00 | 34.40 | 43.20 | 49.33 | – | – |
Percentiles of weight obtained for boys with Down syndrome up to 14 years of age.
| Boys’ weight (kg) | Pctl 3 | Pctl 10 | Pctl 25 | Median | Pctl 75 | Pctl 90 | Pctl 97 |
|---|---|---|---|---|---|---|---|
| 0 months | 2.53 | 3.46 | 4.08 | 5.18 | 5.74 | 6.35 | 6.92 |
| 6 months | 6.05 | 6.18 | 6.63 | 7.58 | 8.74 | 9.59 | 10.28 |
| 1 years | 6.93 | 8.17 | 8.53 | 9.48 | 10.63 | 11.92 | 12.14 |
| 2 years | 8.33 | 9.46 | 10.28 | 11.37 | 12.35 | 13.29 | 14.01 |
| 3 years | 9.98 | 11.50 | 11.95 | 13.40 | 14.93 | 15.76 | 16.70 |
| 4 years | 12.10 | 13.19 | 14.00 | 15.50 | 17.30 | 18.12 | – |
| 5 years | 13.20 | 14.32 | 16.00 | 19.30 | 20.40 | 21.50 | – |
| 6 years | 17.10 | 17.19 | 17.98 | 21.00 | 23.00 | 27.74 | – |
| 7 years | 18.50 | 19.35 | 21.18 | 23.25 | 25.95 | 29.55 | – |
| 8 years | 19.10 | 20.60 | 23.28 | 27.70 | 33.05 | 36.85 | – |
| 9 years | 20.80 | 26.50 | 34.30 | 39.98 | – | – | |
| 10 years | 32.30 | 37.50 | 39.50 | 41.40 | – | – | |
| 11 years | 37.50 | 39.50 | 43.20 | 47.50 | – | – | |
| 12 years | 42.70 | 48.85 | 53.00 | 59.03 | – | – | |
| 13 years | 48.80 | 48.85 | – | – | – |
Percentiles of cranial perimeter obtained for girls with Down syndrome up to 6 years of age.
| CP girls (cm) | Pctl 3 | Pctl 10 | Pctl 25 | Median | Pctl 75 | Pctl 90 | Pctl 97 |
|---|---|---|---|---|---|---|---|
| 0 months | 33.00 | 34.40 | 36.00 | 37.50 | 39.00 | 40.16 | – |
| 6 months | 40.50 | 41.00 | 41.77 | 43.00 | 44.00 | – | |
| 1 years | 40.80 | 41.00 | 42.00 | 43.00 | 44.80 | 45.50 | – |
| 2 years | 42.00 | 43.00 | 43.50 | 45.13 | – | – | |
| 3 years | 44.50 | 44.60 | 46.00 | 46.50 | 47.00 | – | – |
| 4 years | 47.00 | 47.50 | 48.00 | – | – | ||
| 5 years | 48.00 | 48.13 | 48.50 | - | – | – |
Percentiles of cranial perimeter obtained for boys with Down syndrome up to 6 years of age.
| CP boys (cm) | Pctl 3 | Pctl 10 | Pctl 25 | Median | Pctl 75 | Pctl 90 | Pctl 97 |
|---|---|---|---|---|---|---|---|
| 0 months | 33.20 | 34.83 | 37.13 | 38.50 | 39.00 | 40.55 | – |
| 6 months | 38.31 | 40.00 | 41.50 | 42.50 | 43.80 | 44.55 | 45.83 |
| 1 years | 41.00 | 42.20 | 42.25 | 44.50 | 46.10 | 46.50 | – |
| 2 years | 42.00 | 44.50 | 45.00 | 46.00 | 47.60 | 48.50 | – |
| 3 years | 43.50 | 43.80 | 46.00 | 47.00 | 48.70 | 50.00 | – |
| 4 years | 45.00 | 46.50 | 47.00 | 47.55 | – | – | |
| 5 years | 48.00 | 48.20 | 49.00 | – | – |


The gestational age was to term in 54 patients (52%) and preterm between 35 and 37 weeks in 48 patients (47%). There was only one post-term birth of 42 weeks (1%).
Only one patient presented with diabetes mellitus type I (1%). 63 patients (61%) presented with acquired subclinical hypothyroidism. 31 patients (30%) presented with one or several heart diseases related with defects of the heart wall. During the study period, 4 patients (4%) suffered from acute leukaemia.
DiscussionMany of the measurements were repeatedly taken for the same patient, on following a complete health programme from their initial visit to the Down Syndrome Unit. Even so, the age groups were configured mainly by under 20 measurements. As a result we find that in the same age group there are children who are 5.1 years old and those who are 5.9 years old, for example.
Growth analysis of height shows a similar pattern among boys and girls, with differences from adolescence. The girls’ growth appears to drop once puberty has been reached.6
We found that the median height of girls from 3 to 6 years of age and from 9 to 14 years of age was slightly superior to that of previous studies,6 but was within the limits of normality from the CDSF. Regarding boys, it was superior uninterruptedly from 3 to 13 years of age.
With regards to weight, we confirmed the variability and dispersion which increases with age, and particularly from school age.6 This is highly marked from 10 years of age upwards. Median weight in girls escalates at 10, with differences of several kilos compared with the literature.6 In boys, this occurs before, from 5 years of age.
With regard to cranial perimeter, we collected more recordings from boys than girls and this impeded comparisons being made between them.
The thyroid pathology is greater in our study than in that of Bull,7 and this may be due to the fact that the subclinical hypothyroidism was included as an entity within the group.
The study patients presented with fewer heart diseases,7 which could be due to the fact that patients with serious heart disease were excluded.
ConclusionThe values of measurements observed in the study were similar to those recorded in the previous morphometric study of the Catalan Down Syndrome Foundation,6 although several age groups obtained slightly larger measurements. This fact has not been able to be statistically demonstrated due to the small sample size.
The study was conducted with the aim of being a first approach towards discovering how the Down syndrome population is evolving. We are therefore continuing to use the CDSF study as a benchmark in standard practice. Our intention is not to present our measurements standard but simply to compare them to the current standards.
Conflicts of interestThe authors have no conflicts of interest to declare.