To describe the temporal evolution of inter-limb asymmetries in ankle kinematics and triceps surae muscle activation during gait following Achilles tendon repair (ATR) using the PARS-Dresden technique, assessed at 8, 12, 24, and 52 weeks post-surgery.
Clinical CaseA single patient who underwent ATR using the PARS-Dresden technique was evaluated across four post-surgical time points. Ankle kinematics and surface electromyography activity of the gastrocnemius medialis (GM), gastrocnemius lateralis (GL), and soleus (SOL) were recorded over 20 gait cycles. Inter-limb symmetry was quantified using a normalized cross-correlation coefficient (cc_n) comparing the operated (OL) and non-operated (NOL) limbs.
ResultsAnkle kinematic symmetry in the sagittal plane increased from 8 weeks (cc_n=0.58) to 12 weeks (cc_n=0.71), reaching near-complete restoration at 24 weeks (cc_n=0.97) and maintained at 52 weeks (cc_n=0.98). Plantar flexor activation followed a similar behavior, rising from 8 weeks (GM=0.65, GL=0.62, SOL=0.70) to near-complete symmetry at 24 weeks (GM=0.99, GL=1.00, SOL=0.97), sustained at 52 weeks.
ConclusionThis case showed improved symmetry between the OL and NOL in ankle kinematics and triceps surae activation during gait, achieved at 24 weeks and maintained up to one year after ATR using the PARS-Dresden technique combined with a standardized rehabilitation protocol.
Describir la evolución temporal de las asimetrías entre las extremidades inferiores en la cinemática del tobillo y en la activación muscular del tríceps sural durante la marcha, tras la reparación del tendón de Aquiles (RTA) mediante la técnica PARS-Dresden, evaluada a las 8, 12, 24 y 52 semanas postquirúrgicas.
Caso ClínicoUn paciente sometido a RTA mediante la técnica PARS-Dresden fue evaluado en cuatro momentos postquirúrgicos. Se registró la cinemática del tobillo y la actividad EMG de superficie del gastrocnemio medial (GM), gastrocnemio lateral (GL) y sóleo (SOL) durante 20 ciclos de marcha. La simetría entre miembros fue cuantificada mediante un coeficiente de correlación cruzada normalizado (cc_n) que comparó la pierna operada (PO) y la no operada (PNO).
ResultadosLa simetría cinemática del tobillo en el plano sagital aumentó desde las 8 semanas (cc_n=0,58) hasta las 12 semanas (cc_n=0,71), alcanzando una restauración casi completa a las 24 semanas (cc_n=0,97) y manteniéndose a las 52 semanas (cc_n=0,98). La activación de los flexores plantares siguió un comportamiento similar, aumentando desde las 8 semanas (GM=0,65, GL=0,62, SOL=0,70) hasta una simetría casi completa a las 24 semanas (GM=0,99, GL=1,00, SOL=0,97), manteniéndose a las 52 semanas.
ConclusiónEste caso mostró una mejora en la simetría entre PO y PNO en la cinemática del tobillo y la activación del tríceps sural durante la marcha, lograda a las 24 semanas y mantenida hasta un año después de la RTA mediante la técnica PARS-Dresden combinada con un protocolo de rehabilitación estandarizado.
The sudden rupture of the Achilles tendon, one of the largest and strongest tendons in the human body, is among the most complex injuries for an active individual or athlete1. With an incidence of approximately 31 per 100 000 persons per year, Achilles tendon ruptures (ATR) affect young athletes and middle-aged recreational sportspeople (i.e., typically men aged 30-49 and women aged 40-49)1. Men are more than three times more likely to suffer an ATR than women, although no population is entirely exempt1.
Surgical management has evolved considerably over the past few decades. While non-operative approaches remain a viable option for some patients with ATR, the demand for faster, safer, and more effective recovery in active populations has driven the development of minimally invasive surgical techniques2–4. Among these, the PARS-Dresden method stands out for its distinctive approach, which avoids dissection or reattachment of the distal tendon stump3. It minimizes surgical trauma and enables crutch removal as early as the fourth postoperative week3, a milestone that would be unthinkable with conventional repair strategies. Yet, it also raises an important and underexplored question: What happens to biomechanical variables as these patients’ gait evolves?
Walking is far more than a mechanical act. It is a finely orchestrated sequence of neuromuscular events, in which the coordinated activation of lower limb segments, particularly the plantar flexors during the stance phase, ensures propulsion, stability, and energy efficiency5,6. Nevertheless, when the Achilles tendon is disrupted, so too is the primary mechanism driving push-off: the gastrocnemius and soleus complex loses its ability to generate the forces necessary for normal gait7. The result is not merely gait claudication but a cascade of biomechanical compensations that can affect the lower limb7, including reduced plantar flexor strength, ankle power, and push-off impulse, may persist beyond 12 months following ATR8,9. Furthermore, tendon elongation and delayed or failed healing may further impair function and increase the risk of chronic deficits or re-rupture10,11.
Gait symmetry, broadly defined as the absence of significant bilateral biomechanical differences, serves as a practical benchmark for functional recovery12. Yet perfect symmetry is rarely observed even in healthy individuals. Asymmetries of 10–15% are generally considered within the normal range, though what constitutes an acceptable threshold depends on the variable assessed and remains a matter of ongoing debate13–15. In ATR rehabilitation, achieving acceptable gait symmetry is both a therapeutic goal and a clinical marker; the closer a patient moves toward a symmetrical gait, the closer they are to full functional restoration12. Lower-limb asymmetries are important because they may reveal unequal strength, altered motor control, or functional capacity between limbs15,16. During and after rehabilitation, persistent asymmetries may indicate incomplete functional recovery and affect performance or return-to-sport readiness, particularly during high-demand tasks involving change of direction, rapid deceleration, and drop-jump landing16,17. Kinematic and electromyographic (EMG) gait analyses at different stages may therefore provide invaluable insight into the functional status of the operated limb (OL) versus the non-operated limb (NOL) and the extent to which rehabilitation is progressing as expected. Therefore, this case report aimed to describe the temporal evolution of inter-limb asymmetries in ankle kinematics and triceps surae muscle activation during gait following ATR using the PARS-Dresden technique, assessed at 8, 12, 24, and 52 weeks post-surgery.
Materials and methodsThe study was a case report describing the results of a relatively new technique (PARS-Dresden) in a patient who underwent surgery with it. The volunteer signed an informed consent, approved by a local ethics committee (Universidad de los Andes, Chile) in accordance with the Declaration of Helsinki.
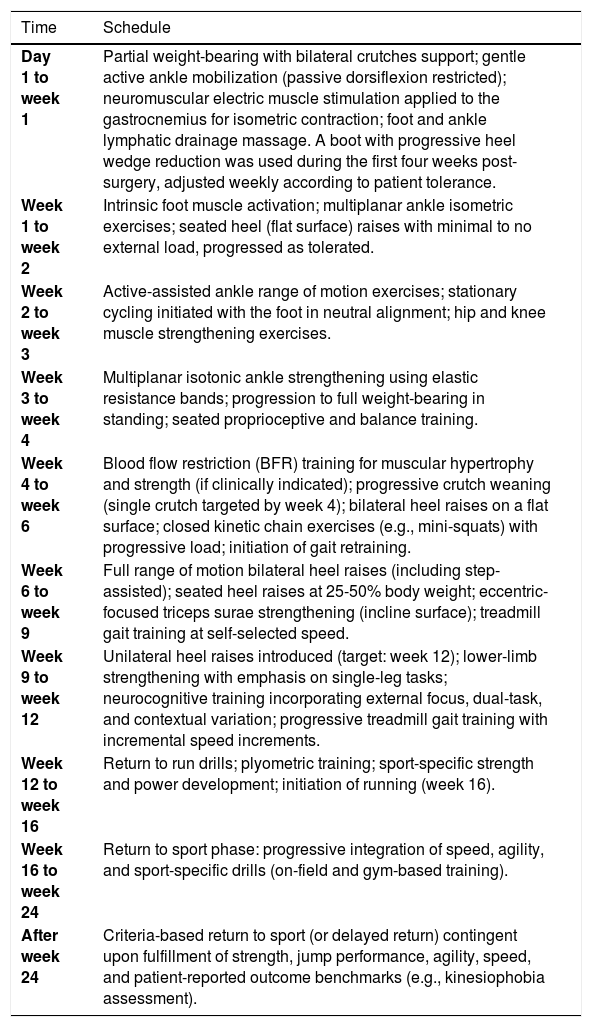
This case report describes a 36-year-old male who sustained a left ATR during an amateur soccer match, with no prior comorbidities or lower limb injuries, treated using the minimally invasive PARS-Dresden technique. His anthropometric data were as follows: height 1.68 m, weight 71kg, and body mass index 25.18kg/m2. He trained 3–5 times weekly before the injury. A six-month rehabilitation protocol, based on Pellegrini et al.3, was applied, with staged exercises aligned with his progression (see Table 1).
PARS-Dresden postoperative rehabilitation program, considering from the first day until twenty-four weeks. This protocol was modified from prior research (Pellegrini et al., 2019)3
| Time | Schedule |
|---|---|
| Day 1 to week 1 | Partial weight-bearing with bilateral crutches support; gentle active ankle mobilization (passive dorsiflexion restricted); neuromuscular electric muscle stimulation applied to the gastrocnemius for isometric contraction; foot and ankle lymphatic drainage massage. A boot with progressive heel wedge reduction was used during the first four weeks post-surgery, adjusted weekly according to patient tolerance. |
| Week 1 to week 2 | Intrinsic foot muscle activation; multiplanar ankle isometric exercises; seated heel (flat surface) raises with minimal to no external load, progressed as tolerated. |
| Week 2 to week 3 | Active-assisted ankle range of motion exercises; stationary cycling initiated with the foot in neutral alignment; hip and knee muscle strengthening exercises. |
| Week 3 to week 4 | Multiplanar isotonic ankle strengthening using elastic resistance bands; progression to full weight-bearing in standing; seated proprioceptive and balance training. |
| Week 4 to week 6 | Blood flow restriction (BFR) training for muscular hypertrophy and strength (if clinically indicated); progressive crutch weaning (single crutch targeted by week 4); bilateral heel raises on a flat surface; closed kinetic chain exercises (e.g., mini-squats) with progressive load; initiation of gait retraining. |
| Week 6 to week 9 | Full range of motion bilateral heel raises (including step-assisted); seated heel raises at 25-50% body weight; eccentric-focused triceps surae strengthening (incline surface); treadmill gait training at self-selected speed. |
| Week 9 to week 12 | Unilateral heel raises introduced (target: week 12); lower-limb strengthening with emphasis on single-leg tasks; neurocognitive training incorporating external focus, dual-task, and contextual variation; progressive treadmill gait training with incremental speed increments. |
| Week 12 to week 16 | Return to run drills; plyometric training; sport-specific strength and power development; initiation of running (week 16). |
| Week 16 to week 24 | Return to sport phase: progressive integration of speed, agility, and sport-specific drills (on-field and gym-based training). |
| After week 24 | Criteria-based return to sport (or delayed return) contingent upon fulfillment of strength, jump performance, agility, speed, and patient-reported outcome benchmarks (e.g., kinesiophobia assessment). |
The patient attended wearing athletic sportswear and walked barefoot on the treadmill (H/P/Cosmos®, Model LE200CE, Germany). Self-selected walking speed was determined by gradually increasing velocity with the display concealed until the patient confirmed comfort, yielding 2.2km/h. Following a five-minute familiarization period, twenty consecutive gait cycles were recorded per limb (OL and NOL) at 8 (8W), 12 (12W), 24 (24W), and 52 (52W) weeks post-surgery, at the same self-selected walking speed used across all sessions.
Prior to gait recording, anthropometric measurements of each limb segment (lengths and widths) were taken to construct a 3D biomechanical model using 20 retroreflective markers (14mm diameter) placed at standardized anatomical landmarks according to the OSSCA model18 (including the anterior superior iliac spines, posterior superior iliac spines, anterior and lateral surface of each thigh, femoral epicondyles, anterior and lateral surface of each shank, lateral malleoli, posterior aspect of the calcaneus, and second metatarsal head bilaterally), which was used to define the hip joint center and knee flexion-extension axis, with a soft tissue artifact minimized using optimal common shape technique18 (integrated in Vicon®). Kinematic data were captured using eight infrared cameras and Nexus software (T-Series, Vicon Motion System, Oxford, UK) at a sampling frequency of 100Hz. Marker trajectories were filtered utilized a fourth-order low-pass Butterworth filter with a cut-off frequency of 6Hz.
Bilateral surface EMG signals were recorded from three muscles per limb, gastrocnemius medialis (GM), gastrocnemius lateralis (GL), and soleus (SOL), using a Bagnoli 16-channel system (Delsys® Inc., Boston, MA, USA) at a sampling frequency of 1000Hz, with a bandpass filter of 20–450Hz and a gain of 1000. Bipolar Ag/AgCl surface electrodes with an inter-electrode distance of 10mm were placed over the muscle bellies according to SENIAM recommendations19 (https://seniam.org/). EMG signals were synchronized with kinematic data within Nexus software (Vicon®).
Data processingKinematic data were segmented into 20 gait cycles, with each segment time-normalized to 101 data points, representing 0-100% of the gait cycle, as follows. Surface EMG signals were processed by first removing the signal offset. A 50Hz Butterworth band-stop filter was then applied to reduce power-line interference. The filtered signals were subsequently rectified and low-pass filtered at 20Hz using a fourth-order Butterworth filter to obtain the linear envelope. For each muscle, surface EMG amplitude was normalized to the maximum value obtained from the corresponding muscle across the 20 gait cycles for each assessment week. After normalization, each signal was cut into 20 gait cycles, and each cycle was time-normalized to 101 data points per cycle. Finally, EMG activity and ankle kinematics were expressed with the mean and standard deviation of the 20 recorded gait cycles for each assessment time point (8W, 12W, 24W, and 52W).
Statistical AnalysisSide-to-side asymmetry was quantified using the normalized cross-correlation coefficient (cc_n). This method has been previously used by Ogihara et al. to assess the temporal relationship and similarity between two biomechanical waveforms20. The cc_n was calculated to determine the degree of correspondence between paired signals, using the following equation:

where N represents the 101 data points within each time-normalized cycle and k represents the time lag between the OL and NOL signals. This time-normalized dataset represents 0-100% of the gait cycle. Subsequently, the autocorrelation of both OL (AuOL) and NOL (AuNOL) was calculated utilizing the following equations20:


Finally, cc_n was calculated as20:
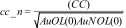
The cc_n value was used to quantify gait asymmetry between the OL and NOL. The analysis included the ankle kinematics and electromyographic activity of the GM, GL, and SOL. Values of cc_n approaching 1 indicated greater similarity between lower-limb waveforms (i.e., within a range from 0 to 1) and, consequently, higher inter-limb symmetry. To explore waveform morphology, cc_n values were interpreted as follows: ≤0.35 low, 0.36 - 0.67 moderate, and 0.68 - 1.00 high21. Furthermore, the percentage change in cc_n between consecutive time points was calculated using the following equation: ((cc_n final−cc_n initial)/cc_n initial)×100. All analyses were performed using Python 3.5 software.
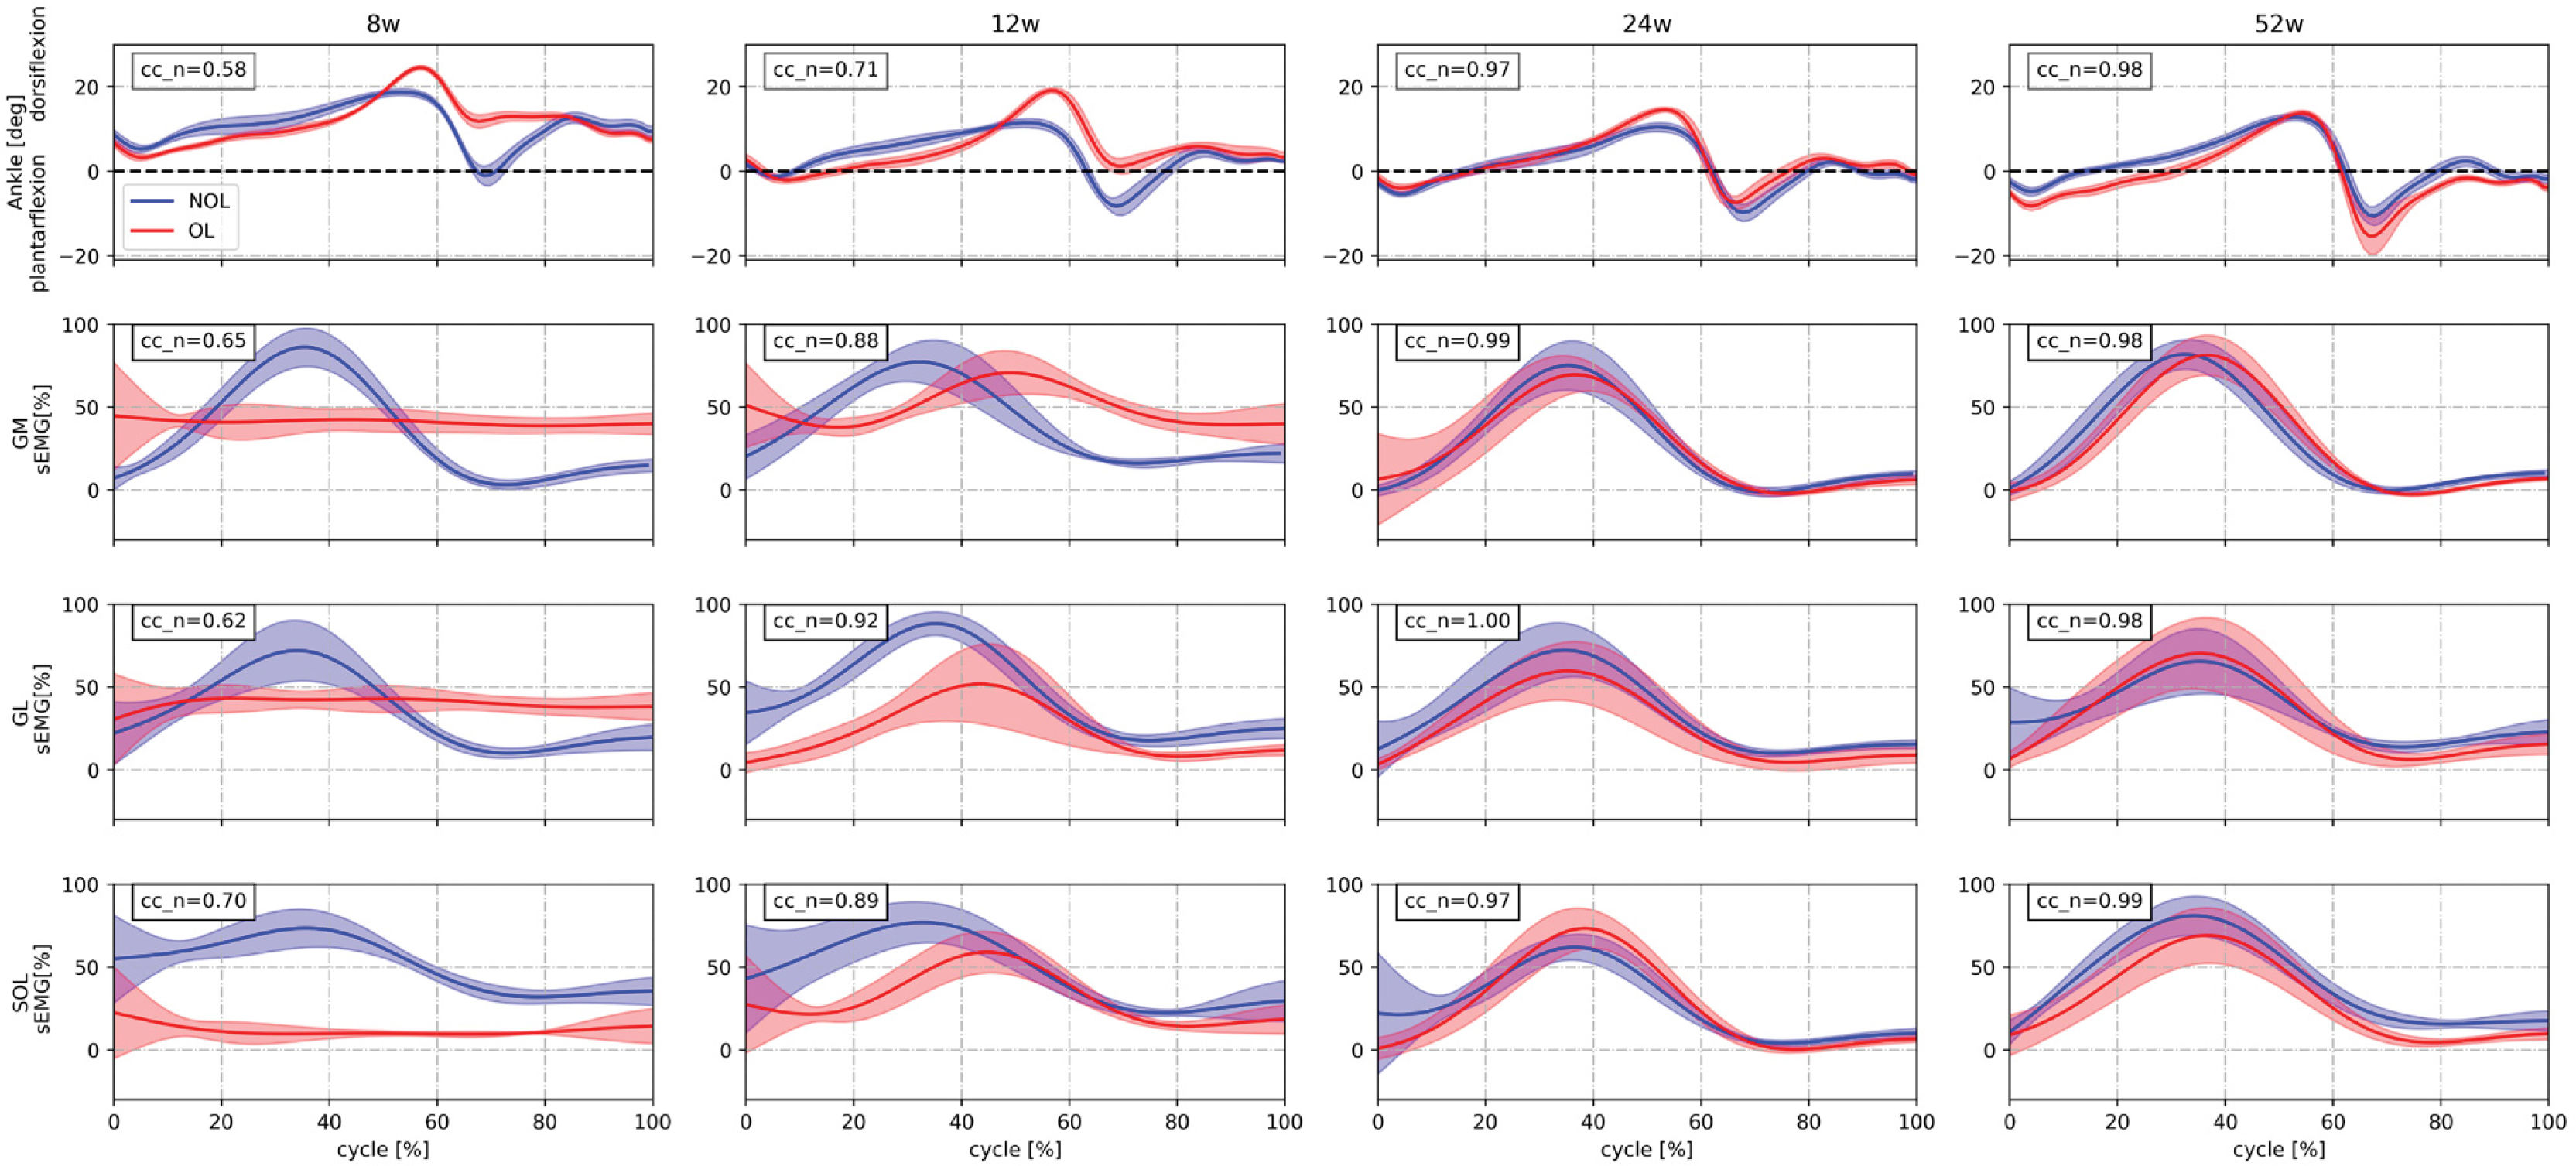
ResultsGait asymmetry outcome values for ankle kinematics and plantar flexor muscle activation are visualized in Figure 1, each representing the average and standard deviation of 20 gait cycles. Both measures demonstrated a consistent and progressive improvement in inter-limb symmetry across all follow-up time points.
Ankle kinematics and triceps surae surface electromyographic (sEMG) activity during the gait cycle at 8, 12, 24, and 52 weeks post-surgery. Each column represents a time point, and each row displays a different variable: ankle sagittal plane motion (dorsiflexion/plantarflexion, top row), and sEMG activity of the gastrocnemius medialis (GM), gastrocnemius lateralis (GL), and soleus (SOL) (rows 2–4, respectively). Waveforms are expressed as mean±standard deviation across 20 gait cycles for the operated limb (OL, red) and non-operated limb (NOL, blue). Inter-limb symmetry was quantified using a normalized cross-correlation coefficient (cc_n), displayed in the upper left corner of each image.
Ankle kinematics showed marked asymmetry at 8W (cc_n=0.58, moderate), with notable differences in range of motion waveform between the NOL and OL limbs. Symmetry improved moderately by 12W (cc_n=0.71, high) and was largely restored by 24W (cc_n=0.97, high), with both waveforms nearly overlapping. This level of symmetry was maintained at 52W (cc_n=0.98, high). The percentage change in cc_n between consecutive time points revealed a 22.41% improvement from 8W to 12W, a further 36.62% increase from 12W to 24W, and a minimal change of 1.03% from 24W to 52W, confirming stable bilateral ankle kinematics at long-term follow-up.
A similar trajectory was observed in surface EMG activity of the three plantar flexor muscles. At 8W, cc_n values were lowest across all muscles (GM=0.65, moderate; GL=0.62, moderate; SOL=0.70, high), reflecting substantial inter-limb activation asymmetry. Improved interaction between curves was observed by 12W (GM=0.88, high; GL=0.92, high; SOL=0.89, high), with near-complete symmetry achieved by 24W (GM=0.99, high; GL=1.00, high, SOL=0.97, high). These values were sustained at 52W (GM=0.98, high; GL=1.00, high; SOL=0.99, high), confirming stable and symmetric muscle activation at long-term follow-up.
Regarding percentage changes between consecutive time points, consistent improvements were observed across all muscles from 8W to 12W (GM=35.38%; GL=48.39%; SOL=27.14%), with further increases from 12W to 24W (GM=12.50%; GL=8.70%; SOL=9.00%), and minor changes from 24W to 52W (GM=−1.01%; GL=0.00%; SOL=2.06%).
DiscussionThe primary aim of this study was to describe asymmetries in the joint kinematics and EMG activity during gait in a patient who underwent ATR repair using the PARS-Dresden technique, assessed across multiple time points from 8 to 52 weeks post-surgery. A key finding was the progressive restoration of gait symmetry, as reflected by the cc_n values, with the greatest symmetry achieved at 24W, a level maintained through 52W, particularly in ankle plantarflexion/dorsiflexion motion and triceps surae activation during the gait. Notably, the largest percentage changes in triceps surae muscle activation between consecutive time points occurred from 8 to 12 weeks (GM: 35.38%; GL: 48.39%; SOL: 27.14%), whereas the greatest improvement in ankle kinematics was observed between 12 and 24 weeks.
This 24W time point is consistent with the convergence between mechanical recovery and gait pattern normalization described in the ATR literature, encompassing improvements in plantarflexor strength, ankle range of motion, and tendon stiffness11,22. Prior to this window, significant alterations in stance time, loading response, and pre-swing phase have been reported22, which may account for the greater cc_n asymmetry between the OL and NOL observed at earlier time points in the present study. Apparently, ankle sagittal plane kinematics represent the most sensitive domain for detecting inter-limb asymmetry following ATR. For example, at both 8W and 12W a lower significant plantarflexion between OL and NOL in late stance has been reported11, reflecting kinematic asymmetries consistent with our early time point (8W cc_n=0.58 and 12W cc_n=0.71, percentage change=22.41%). These deficits appear to diminish progressively, with a gradual restoration of gait symmetry observed at 24W in the present case report (percentage change=36.62%). Nevertheless, another study by Manegold et al. reported significantly higher peak dorsiflexion and reduced peak plantarflexion on the OL compared to the contralateral side at 27-82 months following percutaneous repair23, suggesting that residual sagittal plane asymmetries may persist well beyond the first year of recovery. Similar findings have been reported in non-surgically managed cohorts, where a more dorsiflexed foot position and delayed sagittal plane movement events during late stance were observed on the OL24. However, the cc_n values observed in the present case report suggest similar waveform behavior between the lower limbs at 24W and 52W (percentage change=1.03%). This finding may represent a valuable feature for describing the rehabilitation progression of this patient type, particularly in the weeks preceding 24W. However, although high interlimb symmetry was observed in ankle joint angles at 24W, symmetry alone does not necessarily indicate complete biomechanical recovery. These results should therefore not be interpreted as definitive evidence, particularly given the single-case nature of this report.
A similar behavior was observed in the surface EMG of the triceps surae, where at 8W and 12W the cc_n values were lower, indicating low symmetry between OL and NOL, yet with the largest percentage changes observed across all muscles during this interval (GM: 35.38%; GL: 48.39%; SOL: 27.14%). By 24 weeks, cc_n values also increased across all muscles, showing high inter-limb symmetry and more symmetrical waveform curves of the GL, GM and SOL during gait. The progressive increase in cc_n values across the plantar flexor muscles between 8W and 24W post-surgery could reflect a gradual restoration of neuromuscular coordination in the OL, likely associated with the combined influence of the surgical technique and the structured rehabilitation protocol. The marked inter-limb asymmetry observed at both temporal windows is consistent with altered motor recruitment strategies documented in the early post-surgical phase following ATR, where modified activation patterns of the triceps surae might be adopted in response to mechanical changes in the healing tendon25,26. These adaptations result in divergent EMG waveform morphology between the OL and NOL, as the neuromuscular system adjusts recruitment demands to accommodate reduced tendon load-bearing capacity. The near-complete bilateral symmetry achieved across GM, GL, and SOL at 24W suggests restoration of coordinated triceps surae activation during gait. This finding is particularly relevant given that neuromuscular alterations following ATR repair have been reported to persist for 3.5 years or more post-surgery in some patients27, manifesting as altered recruitment patterns (as reflected by co-contraction index, muscle activation, and electromyographic frequency) and increased muscle activation demands in the OL during functional tasks. In this context, the early restoration of inter-limb EMG symmetry observed at 24W, sustained through 52W, could represent a clinically meaningful outcome and may suggest a favorable neuromuscular recovery trajectory associated with the PARS-Dresden technique and the rehabilitation process. Because the EMG signals were amplitude-normalized and cc_n is invariant to signal amplitude, the reported symmetry reflects the shape and timing of muscle activation rather than its magnitude. Between-limb differences in activation amplitude therefore cannot be excluded. However, future studies should analyze how changes in amplitude and temporal patterns occur throughout the rehabilitation process in this patient population.
Finally, the main limitation of this study should be acknowledged: it is a single case report with a 1-year follow-up after Achilles tendon rupture. Moreover, the findings are limited to descriptions of ankle kinematics and calf muscle activity following PARS-Dresden Achilles tendon repair.
ConclusionThis case report documents a progressive restoration of inter-limb symmetry in ankle kinematics and triceps surae activation during gait, achieved by 24W and maintained through 52W following ATR repair using the PARS-Dresden technique combined with a standardized rehabilitation protocol. However, further studies with larger sample sizes are needed to confirm these outcomes.
Conflict of interestThe authors state no conflict of interest.
The authors would like to thank the “Clínica Universidad de los Andes” and Grant BASAL CIA250006.