


The Coronavirus Anxiety Scale (CAS) is an instrument that measures the severity of anxiety due to COVID-19 or coronaphobia. In the context of the COVID-19 pandemic, older adults are the most vulnerable age group; therefore, the aim of the study was to evaluate the psychometric properties of the CAS in this group.
Materials and method274 Peruvian older adults participated (Mage=67.86; SD=6.34, 64.6% women). In addition to the CAS, the 2-item Patient Health Questionnaire (PHQ-2), and 2-item Generalized Anxiety Disorder Scale (GAD-2) were applied. Confirmatory Factor Analysis (CFA) was used to assess the factor structure of the CAS and Item Response Theory was used to analyze item characteristics. A sequence of hierarchical variance models was used to evaluate the measurement invariance of the CAS according to age. To assess reliability, Cronbach's alpha coefficient (α) and the omega coefficient (ω) were used. The correlations between the CAS score and the scores of the PHQ-2 and GAD-2 scales were calculated with Pearson's correlation coefficient (r).
ResultsThe results of the CFA indicated that the unidimensional model of the CAS fitted the data adequately and showed very good reliability (α and ω≥.83). Likewise, all items provided high information and adequate discrimination, which allowed for better detection of average and high levels of coronaphobia in the older adult population. However, the CAS did not show evidence of being strictly invariant between older adults aged 60–65 years and 66–86 years. The CAS showed significant correlations with anxiety (r=.72; [95%CI: .66, .87] p<.01) and depression (r=.53; [95%CI: .43, .76] p<.01).
ConclusionThe CAS in Spanish shows evidence of validity based on internal structure, convergent and divergent validity, as well as an adequate reliability estimate to assess coronaphobia in older adults. The CAS can be used to detect average and high levels of coronaphobia in the older adult population.
La Coronavirus Anxiety Scale (CAS) es un instrumento que mide la severidad de la ansiedad por la COVID-19 o coronafobia. En el contexto de la pandemia de la COVID-19, los adultos mayores son el grupo de edad más vulnerable; por lo tanto, el objetivo del estudio fue evaluar las propiedades psicométricas del CAS en este grupo.
Materiales y métodoParticiparon 274 adultos mayores peruanos (Medad=67.86; DE=6.34, 64.6% mujeres). Además del CAS, se aplicaron el 2-item Patient Health Questionnaire (PHQ-2) y el 2-item Generalized Anxiety Disorder Scale (GAD-2). Se utilizó un Análisis Factorial Confirmatorio (AFC), para evaluar la estructura factorial del CAS y la Teoría de Respuesta al Ítem, para analizar las características de los ítems. Se utilizó una secuencia de modelos de varianza jerárquicos para evaluar la invarianza de medición del CAS según edad. Para evaluar la confiabilidad, se utilizó el coeficiente alfa de Cronbach (α) y el coeficiente omega (ω). Las correlaciones entre el puntaje del CAS, los puntajes de las escalas PHQ-2 y GAD-2, se calcularon con el coeficiente de correlación de Pearson (r).
ResultadosLos resultados del AFC indicaron que el modelo unidimensional del CAS ajustó adecuadamente a los datos y mostró una muy buena confiabilidad (α y ω ≥ .83). Asimismo, todos los ítems brindaron una alta información y adecuada discriminación; lo que permitió detectar mejor los niveles promedio y alto de coronafobia en la población de adulta mayor. Sin embargo, el CAS no mostró ser estrictamente invariante entre adultos mayores de 60 a 65 años y 66 a 86 años. El CAS mostró correlaciones significativas con la ansiedad (r=.72; [IC95%: .66, .87] p<.01) y depresión (r=.53; [IC95%: .43, .76] p<.01).
ConclusiónSe concluye que el CAS en español muestra evidencias de validez basado en la estructura interna, validez convergente y divergente, así como, una estimación de la fiabilidad adecuada para evaluar la coronafobia en adultos mayores. El CAS se puede utilizar para detectar niveles medios y altos de coronafobia en la población adulta mayor.
Older adults are the age group which is most vulnerable to the COVID-19 pandemic, with a mortality rate of about 3.6%, between 60 and 69 years of age, increasing to 18% in people over 80 years of age.1 In Peru, people older than 60 years of age account for about 60% of all confirmed cases and more than 70% of all deaths related to COVID-19.2 Although younger people exhibit greater mental health problems,3 the high mortality rate of COVID-19 and its rapid transmission exacerbate pre-existing psychiatric problems in older adults and increase the risk of negative consequences for their mental health.4
A recent review study, which included the analysis of 41 studies totaling a sample of 20,069 individuals from Asia, Europe and America, indicated that the mental health of older adults was negatively affected by the COVID-19 pandemic, due to increased psychological distress and loneliness, as well as an increased presence of symptoms of anxiety, depression and poor sleep quality.5 Thus, for example, recent evidence shows an increase in the prevalence rates of anxiety, which before the pandemic ranged between 1.2% and 15%4 but have increased during the pandemic by between 8.3% and 49.7%,6 reaching, according to other studies, 84.5% of moderate to severe levels.7 In Peru, recent studies reported an increase in anxiety in older adults during the first months of the pandemic.8,9 In this regard, a recent study indicated that 13.5% of older adults have coronophobia.8 Thus it is important for health care professionals and researchers to conduct assessments to identify older adults with COVID-19 anxiety.
To this end, the Coronavirus Anxiety Scale (CAS)10 has recently been created as a measure of anxiety related to COVID-19, also known as coronaphobia. Coronaphobia affects people's behavior and psychological well-being, generating excessive worry about health, increased levels of stress, depression, anxiety, loneliness and suicidal ideation, an increase in safety-seeking behaviors, and impaired resilience and functioning during daily life.5,11 The CAS was originally developed and validated in English,10 but it has been adapted and its psychometric properties have been evaluated in different languages such as Turkish,12 Bengali,13 Korean,14 Portuguese15 and Spanish.16 In addition, it has been suggested that the unidimensional structure of the CAS is invariant across gender and age groups.10,11,16 However, to date, the psychometric properties of the Spanish version have not been evaluated in the older adult population.
Psychometric studies have determined that the CAS has a undimensional structure, reliability coefficient values above .80 and significant relationships with variables such as anxiety, depression, fear of COVID-19, self-perception of health quality, and obsession with COVID-19, among others.10–16 Most studies have evaluated the psychometric properties based on Classical Test Theory (CTT); whereas, only one has done so from a dual perspective: CTT and Item Response Theory (IRT).16
CTT emphasizes the assessment of internal consistency and construct validity, but when used to evaluate the CAS it does not accurately assess symptomatology at different points in the anxiety severity range nor does it distinguish item difficulty levels. IRT models overcome the various limitations of CTT and are suitable for data derived from dichotomous or polytomous response scales, such as Likert-type scales.17 IRT models are probabilistic in nature and allow for estimating unobservable traits (also called latent traits or ability) from observed variables (the response that a person offers to a question or test). Likewise, IRT models also relate item characteristics, such as discrimination (parameter a, which measures the ability of the item to discriminate between individuals with different levels of ability or latent trait) and difficulty (expresses the difficulty level of the item and is defined as the level of ability at which an individual has a 50% probability of answering the item correctly), to the probability of selecting different response options for an item. For example, a person with high level of the anxiety related to COVID-19 trait will have a higher probability of scoring high on a moderately relevant item, compared to a person with s lower anxiety level. This helps assure that an individual's responses to the items express his or her level of ability in the trait being measured.18 IRT models evaluate the precision of the measurement at the item level, in addition to providing information on the difficulty and discrimination capacity of the items, independently of the characteristics of the sample.18
In recent years, there has been an increase in the number of studies that have used CTT and IRT models to gain a better understanding of the psychometric properties of anxiety measures.19 For this study, it is crucial that older adults who may be mentally affected by the COVID-19 pandemic be assessed efficiently and effectively for timely psychological support. Thus it is important to have instruments with evidence of validity and reliability to measure indicators of mental health. Therefore, the aim of this study was to evaluate the psychometric evidence of the Spanish version of the CAS in a sample of Peruvian older adults. Specifically, evidence of validity was generated based on internal structure, by means of a CFA, convergent validity, invariance according to different age groups, estimation of the reliability of the scores, as well as evaluation of the discrimination and difficulty of the items from IRT models.
MethodParticipantsA total of 274 older adults (Mage=67.86; SD=6.34) from the city of Lima, Peru participated in the study. The number of participants was determined using Soper's20 software for structural equation modeling (SEM), based on the number of observed (five items) and latent (one variable) variables in the model, the anticipated effect size (lambda=0.1), the desired probability (.05), and the statistical power (.90). The final sample was much larger than that recommended by Soper. All participants were over 60 years of age. Non-probability snowball sampling was used. Once a person was identified as being over the age of 60, he or she was asked to suggest others who might be interested in participating in the study. Individuals’ telephone numbers were used as a means of initial contact. If the person met the established criteria and agreed to participate, their e-mail address or that of a close relative was requested to send the survey online. It is worth mentioning that snowball sampling, used in online studies, is considered to be effective in collecting information from participants from diverse locations and allows for a higher response rate than other strategies.
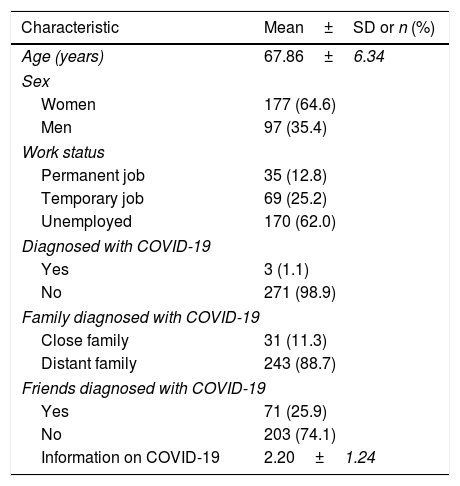
Table 1 shows the sociodemographic profile of the participants, where the majority were women (64.6%). Also, most of the respondents were unemployed (62%), had no COVID-19 diagnosis (98.9%), and no friends diagnosed with the disease (74.1%). However, 100% reported close or distant relatives diagnosed with the disease. Finally, participants indicated that they were exposed to information about COVID-19 for an average of 2.20h (SD=1.24) per week.
Descriptive characteristics of the sample.
| Characteristic | Mean±SD or n (%) |
|---|---|
| Age (years) | 67.86±6.34 |
| Sex | |
| Women | 177 (64.6) |
| Men | 97 (35.4) |
| Work status | |
| Permanent job | 35 (12.8) |
| Temporary job | 69 (25.2) |
| Unemployed | 170 (62.0) |
| Diagnosed with COVID-19 | |
| Yes | 3 (1.1) |
| No | 271 (98.9) |
| Family diagnosed with COVID-19 | |
| Close family | 31 (11.3) |
| Distant family | 243 (88.7) |
| Friends diagnosed with COVID-19 | |
| Yes | 71 (25.9) |
| No | 203 (74.1) |
| Information on COVID-19 | 2.20±1.24 |
Coronavirus Anxiety Scale (CAS).10 The CAS is a brief, unidimensional measure that assesses physiological reactions to anxiety related to the COVID-19 pandemic or coronaphobia. It is comprised of 5 items (e.g., “I had trouble falling asleep because I was thinking about thecoronavirus”) that have five response options (0=not at all to 4=almost every day for the past 2 weeks). The sum of the scores for each item provides a total CAS score ranging from 0 to 20, where a higher value expresses greater physiological reactions of coronaphobia. In the present study, we used the Spanish version adapted and validated for the general population in Peru.16 Prior to its application, a focus group was conducted with 15 older adults (56.8% women, mean age=66.87 [SD=5.67]) to assess their understanding of the items. The results indicated that the participants understood all the items of the Spanish version of the CAS.
2-item Patient Health Questionnaire (PHQ-2)21 and 2-item Generalized Anxiety Disorder Scale (GAD-2).22 The PHQ-2 and GAD-2 are ultra-brief instruments, each consisting of two items, to detect symptoms of depression and anxiety respectively, which are useful in epidemiological studies. Specifically, the PHQ-2 assesses the frequency of feeling “discouraged, depressed, or hopeless” and with “little interest or pleasure in doing things” during the past 2 weeks; whereas, the GAD-2 assesses the frequency of “feeling nervous, anxious, or on edge” and “unable to stop worrying or unable to control worry” during the past 2 weeks. Both the GAD-2 and the PHQ-2 require participants to answer each question based on 4 response options (0=not at all to 3=almost every day). The total scores of the PHQ-2 and GAD-2 are obtained by summing the scores of the two items, resulting in scores ranging from 0 to 6 for each instrument, where a higher score indicates a higher frequency of depressive and anxiety symptoms. The PHQ-2 and GAD-2 have recently been used in a study on the mental health of Peruvian older adults in the context of the COVID-19 pandemic.9 In the present study, both the PHQ-2 (α=.76) and the GAD-2 (α=.84) have an acceptable estimate of reliability.23
ProcedureData collection was performed after approval of the project by the Ethics Committee of the Universidad Privada del Norte (Registration number: 20203001). Data were collected between August 3 and 31, 2020. During this period, the number of cases diagnosed by COVID-19 in Peru was 647,166, while the number of deaths reached 28,788. Likewise, up to that date, 12,364 patients were hospitalized for COVID-19, of whom 1,514 were in the ICU with mechanical ventilation. Furthermore, in this period, 69.3% of deaths due to COVID-19 were among older adults, and the lethality of the disease in this population group was 7.6 times that of younger adults.2 The data for this instrumental study are from a larger project aimed at understanding the impact of the COVID-19 pandemic on the mental health of older adults in Peru. A survey was developed and administered using a Google form, ensuring greater accessibility. Once the older adults who agreed to participate were identified, according to the sampling process described above, the URL of the online form was shared with them so that they could provide informed consent and answer the questions. In the online form, the objective of the study, the absence of risks, the confidential treatment of the data, and the option to withdraw from the study at any time were presented. Each participant completed the online questionnaire in approximately 20minutes, on average.
Data analysisFirst, descriptive statistics (mean, standard deviation, skewness and kurtosis) were calculated. An a priori CFA was used to evaluate the one-factor model of the CAS. The Diagonally Weighted Least Squares with Mean and Variance corrected (WLSMV) estimator was used due to the ordinal nature of the CAS items.24 Model fit was assessed based on the chi-square test (χ2), and the RMSEA and SRMR indices, where values less than .05 indicate good fit, and between .05 and .08 is considered an acceptable fit.25 In addition, the CFI and TLI indices were used, where values greater than .95 indicate a good fit; while values greater than .90 express an acceptable fit.26 To evaluate the reliability, through the internal consistency method, of the CAS, Cronbach's alpha coefficient (α) and the omega coefficient (ω) were used, where a value of α and ω>.80 is adequate.
To evaluate the measurement invariance of the CAS according to the age of the participants, a sequence of hierarchical variance models was used. First, configural invariance (reference model) was evaluated, followed by metric invariance (equality of factor loadings), scalar invariance (equality of factor loadings and intercepts) and finally strict invariance (equality of factor loadings, intercepts and residuals) was tested. To compare the sequence of models, we first employed a formal statistical test, such as the chi-square difference (Δχ2) where nonsignificant values (p>.05) suggest invariance between groups. Second, a modeling strategy was employed, for which the differences in CFI (ΔCFI) was used where values less than<.010 evidence model measurement invariance between groups.26 The difference in RMSEA (ΔRMSEA) was also used, where values less than<.015 show the measurement invariance of the model between groups.26
In relation to the IRT-based analysis, a Graded Response Model (GRM) was used, specifically an extension of the 2-parameter logistic model (2-PLM) for ordered polytomous items.27 The M2 test developed for ordinal items was used to estimate the model fit and the following fit criteria were used: RMSEA≤.05 and SRMSR≤.05.28 CFI and TLI values were also taken into account using the same fit criterion (≥.95) employed in SEM models.29 For each item, two types of parameters were estimated: discrimination (a) and difficulty (b). Parameter a determines the slope of variation of item responses as a function of the level in the latent trait; whereas, parameter b determines the amount of the latent trait that the item needs to be answered. Given that the CAS has five response categories, there are four b-parameter estimates, one per threshold. The estimates for these four thresholds indicate the level of the latent variable at which an individual has a 50% chance of scoring at or above a particular response category. Also, item information curves (IIC) and test information curve (TIC) were calculated. Finally, correlations between the CAS score, PHQ-2 and GAD-2 were calculated with Pearson's correlation coefficient (r) and their 95%CIs. Values of r≥0.2, r≥0.5 and r≥0.8 express minimal, moderate and strong effect size, respectively.30
All statistical analyses were performed using the RStudio environment for R. Specifically, the “lavaan” package31 was used for the CFA, the “semTools” package32 for the calculation of measurement invariance, and the “mirt” package for the GRM.33
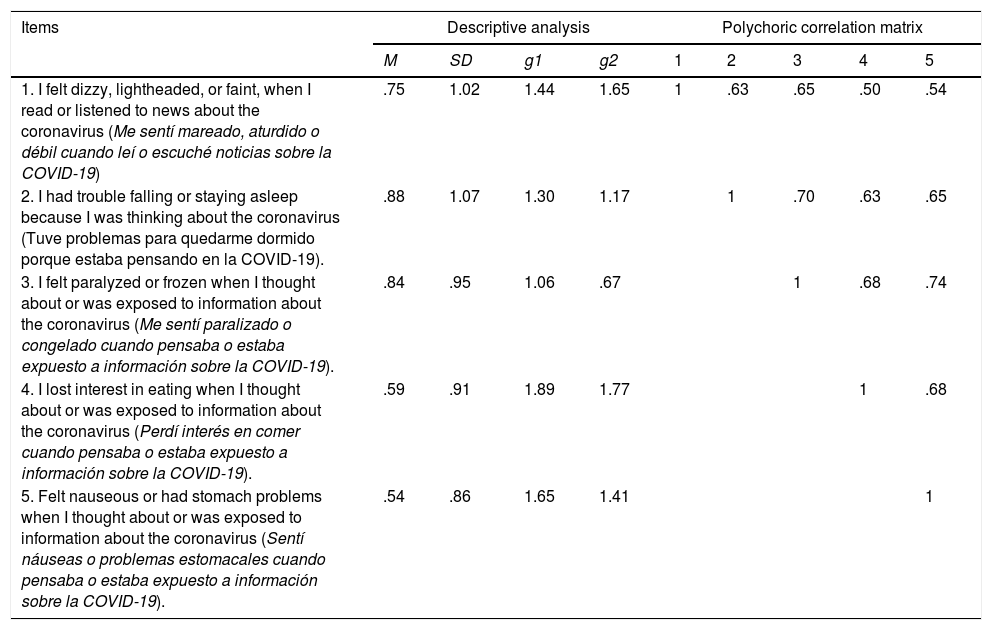
ResultsDescriptive analysisTable 2 shows that item 2 (“I had trouble falling asleep because I was thinking about COVID-19”) presented the highest mean score in the sample (M=.88); while item 5 (“I felt nausea or stomach problems when I was thinking about or exposed to information about COVID-19”) presented the lowest mean score (M=.54). In addition, the polychoric correlation matrix showed that all items have a moderate to high correlation coefficient. Also, adequate g1 and g2 indices were observed (g1<±2; g2<±2).
Descriptive analysis of the items and the polychoric correlation matrix.
| Items | Descriptive analysis | Polychoric correlation matrix | |||||||
|---|---|---|---|---|---|---|---|---|---|
| M | SD | g1 | g2 | 1 | 2 | 3 | 4 | 5 | |
| 1. I felt dizzy, lightheaded, or faint, when I read or listened to news about the coronavirus (Me sentí mareado, aturdido o débil cuando leí o escuché noticias sobre la COVID-19) | .75 | 1.02 | 1.44 | 1.65 | 1 | .63 | .65 | .50 | .54 |
| 2. I had trouble falling or staying asleep because I was thinking about the coronavirus (Tuve problemas para quedarme dormido porque estaba pensando en la COVID-19). | .88 | 1.07 | 1.30 | 1.17 | 1 | .70 | .63 | .65 | |
| 3. I felt paralyzed or frozen when I thought about or was exposed to information about the coronavirus (Me sentí paralizado o congelado cuando pensaba o estaba expuesto a información sobre la COVID-19). | .84 | .95 | 1.06 | .67 | 1 | .68 | .74 | ||
| 4. I lost interest in eating when I thought about or was exposed to information about the coronavirus (Perdí interés en comer cuando pensaba o estaba expuesto a información sobre la COVID-19). | .59 | .91 | 1.89 | 1.77 | 1 | .68 | |||
| 5. Felt nauseous or had stomach problems when I thought about or was exposed to information about the coronavirus (Sentí náuseas o problemas estomacales cuando pensaba o estaba expuesto a información sobre la COVID-19). | .54 | .86 | 1.65 | 1.41 | 1 | ||||
Note. M=Mean; SD=standard deviation; g1=Skewness; g2=Kurtosis.
The unidimensional model presented adequate fit indices in the total sample of participants (χ2=13.71; gl=5; p=.018; RMSEA=.080 [CI90% .031–.132]; SRMR=.026; CFI=.99; TLI=.99). In addition, the CAS showed adequate reliability indices (α=.89; ω=.86). Also, the factor loadings of the CAS were above .70 (item 1=.71; item 2=.81; item 3=.88; item 4=.77; item 5=.82), with an average loading of .79. In addition, all communalities were above .60.
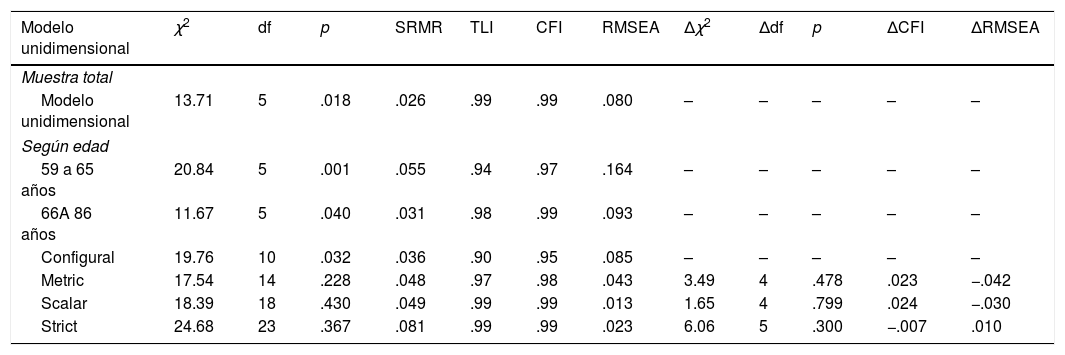
Factorial invariance by ageThe factor structure of the CAS did not show evidence of being strictly invariant for the group of older adults aged 60–65 years and 66 to 86 years in the sequence of invariance models posed: metric (ΔCFI=.017; ΔRMSEA=−.050), scalar (ΔCFI=.000; ΔRMSEA=.000) and strict (ΔCFI=.000; ΔRMSEA=−.000) invariance. The results can be seen in Table 3.
Fit index of the related two-dimensional model and invariance models according to sex and age.
| Modelo unidimensional | χ2 | df | p | SRMR | TLI | CFI | RMSEA | Δχ2 | Δdf | p | ΔCFI | ΔRMSEA |
|---|---|---|---|---|---|---|---|---|---|---|---|---|
| Muestra total | ||||||||||||
| Modelo unidimensional | 13.71 | 5 | .018 | .026 | .99 | .99 | .080 | – | – | – | – | – |
| Según edad | ||||||||||||
| 59 a 65 años | 20.84 | 5 | .001 | .055 | .94 | .97 | .164 | – | – | – | – | – |
| 66A 86 años | 11.67 | 5 | .040 | .031 | .98 | .99 | .093 | – | – | – | – | – |
| Configural | 19.76 | 10 | .032 | .036 | .90 | .95 | .085 | – | – | – | – | – |
| Metric | 17.54 | 14 | .228 | .048 | .97 | .98 | .043 | 3.49 | 4 | .478 | .023 | −.042 |
| Scalar | 18.39 | 18 | .430 | .049 | .99 | .99 | .013 | 1.65 | 4 | .799 | .024 | −.030 |
| Strict | 24.68 | 23 | .367 | .081 | .99 | .99 | .023 | 6.06 | 5 | .300 | −.007 | .010 |
Note: χ2=Chi square; df=degrees of freedom; SRMR: Standardized Root Mean Square Residual; TLI=Tucker-Lewis Index; CFI=Comparative Fit Index; RMSEA=Root Mean Square Error of Approximation; Δχ2=Differences in Chi square; Δdf=Differences in degrees of freedom; ΔRMSEA=Change in Root Mean Square Error of Approximation; ΔCFI=Change in Comparative Fix Index.
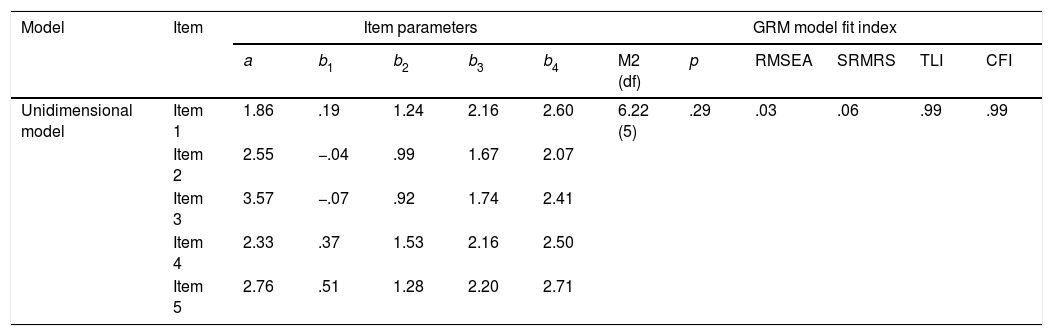
The results found in the CFA meet the two main assumptions of IRT: the presence of unidimensionality and local independence. Therefore, a Graded Response Model (GRM) was used, specifically an extension of the 2-parameter logistic model (2-PLM) for ordered polytomous items. Table 4 shows that the GRM model has adequate fit indices (M2[df]=6.22[5]; p=.29; RMSEA=.03; SRMRS=.06; TLI=.99; CFI=.99). Table 3 shows that all a parameters of the items were above the value of 1, considered as good discrimination (Hambleton, van der Linden & Wells, 2010). Regarding the b parameters, all threshold estimators increased monotonically, fluctuating from -.07 in the first category to 2.71 logits in the last response category.
GRM model fit indices, discrimination and difficulty parameters for scale items.
| Model | Item | Item parameters | GRM model fit index | |||||||||
|---|---|---|---|---|---|---|---|---|---|---|---|---|
| a | b1 | b2 | b3 | b4 | M2 (df) | p | RMSEA | SRMRS | TLI | CFI | ||
| Unidimensional model | Item 1 | 1.86 | .19 | 1.24 | 2.16 | 2.60 | 6.22 (5) | .29 | .03 | .06 | .99 | .99 |
| Item 2 | 2.55 | −.04 | .99 | 1.67 | 2.07 | |||||||
| Item 3 | 3.57 | −.07 | .92 | 1.74 | 2.41 | |||||||
| Item 4 | 2.33 | .37 | 1.53 | 2.16 | 2.50 | |||||||
| Item 5 | 2.76 | .51 | 1.28 | 2.20 | 2.71 | |||||||
Note.a=discrimination parameters; b=difficulty parameters.
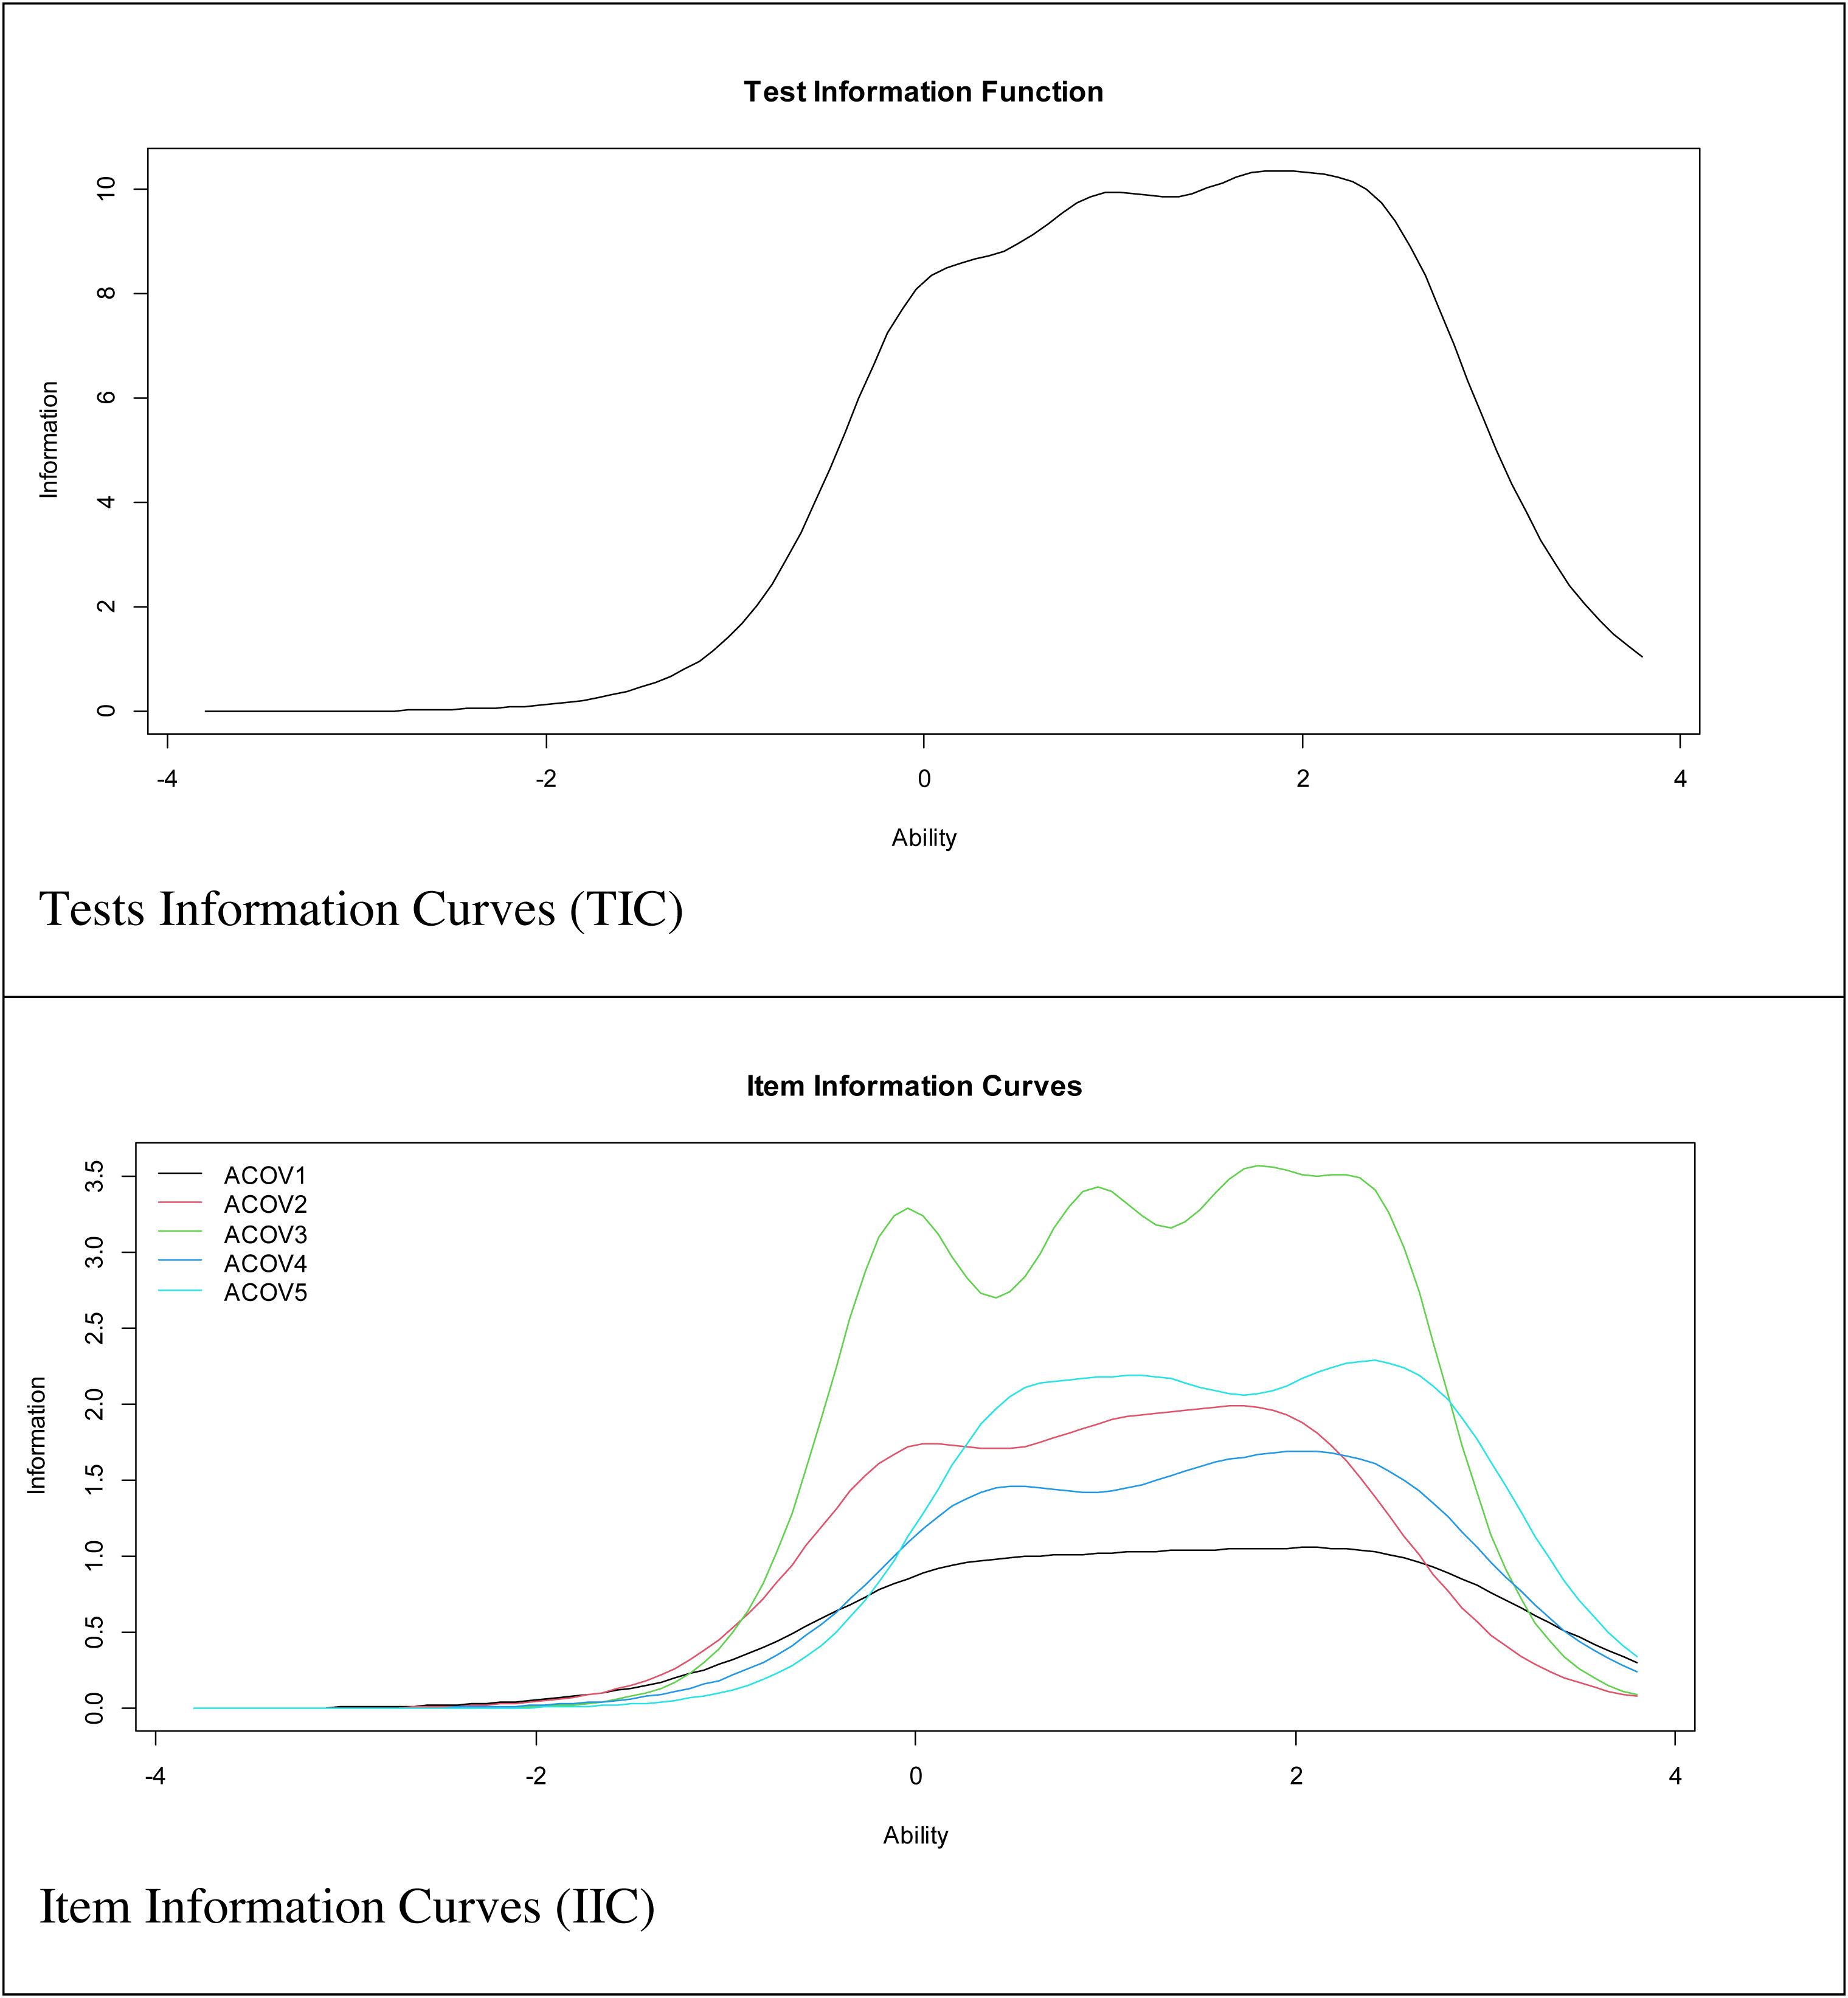
Fig. 1 shows the IIC and TIC. The IIC showed that items 2, 3, and 5 are the most accurate items of the scale for assessing the latent trait. In addition, the TIC showed that the test is more reliable (accurate) in the range of the scale between −0.5 and 3.
Convergent validity
The mean CAS score showed significant correlations with all other constructs which were included in the study. Specifically, the CAS showed positive, statistically significant, moderate effect size correlations with anxiety (r=.72; [95%CI: .66, .87] p<.01) and depression (r=.53; [95%CI: .43, .76] p<.01).
DiscussionThe pandemic caused by COVID-19 has immediate and future consequences on people's mental health. Therefore, having a specific measure such as the CAS could help to identify individuals at risk of experiencing negative emotional reactions during and after the pandemic. In this sense, this study aimed to evaluate the psychometric evidence of the Spanish version of the CAS in a sample of Peruvian older adults, based on structural equation modeling and IRT.
The results indicated that the 5 items of the CAS are grouped in a unidimensional structure, with factor loadings ranging from .71 to .88, in the total sample. The CAS also presents adequate internal consistency reliability, assessed by Cronbach's alpha and omega coefficients. These findings are consistent with previous psychometric studies that used the Spanish and other language versions.10–16 Understanding anxiety as a unidimensional construct is recurrent in the psychological literature34 and having a short, unidimensional scale such as the CAS allows for the assessment of a broad set of psychological constructs in clinical and non-clinical contexts. This type of instrument reduces assessment time and related costs, increases study participation rates, and decreases fatigue and other negative participant reactions that might be related to lower data quality. Although, there are criticisms about the psychometric quality of short scales, these do not seem to be justified.35 Moreover, the results are consistent with other studies which consider anxiety as excessive worry expressed in physical symptoms, such as appetite problems, dizziness, insomnia, tension, and others.36 However, older adults are likely to experience anxious symptoms in different ways. It has been suggested that older adults experience fewer anxiety symptoms than younger adults when their physical health is not threatened (e.g., in some social activity, such as giving a speech); however, this difference would decrease in stressful situations that threaten their physical health. Concern for physical health may generate greater sensitivity to perceived threats. In this sense, because older adults tend to experience more physical illnesses, such as cardiovascular disease, and worry more about bodily sensations, they tend to be more reactive to anxiety symptoms related to these same bodily sensations.37 Therefore, the CAS items may not consider all the ways in which COVID-19 anxiety manifests itself; thus, adding other items may be warranted.
Assessment of measurement invariance supported the presence of configural invariance, confirming that a single latent factor is similar in older adults aged 60–65 years and 66–86 years. This suggests that older adults in both age groups conceptualize COVID-19 anxiety similarly. However, there is an absence of metric invariance, since differences in factor loadings were observed between the age groups. This absence indicates that the five CAS items measure COVID-19 anxiety behaviors differently in the two groups. Thus, there is no empirical support for comparing between-group relationships of COVID-19 anxiety with other latent constructs. Finally, the absence of scalar invariance does not allow for meaningful comparisons of COVID-19 anxiety means between groups. In this sense, the identification of non-invariance according to age would indicate the sensitivity of one of the groups to some aspect of the COVID-19 anxiety construct, which may guide some later modifications in the scale or suggest differences in how older adults in both groups interpret the construct. The presence of partial invariance was not assessed, since it can potentially alter the construct being measured, generating an underrepresentation of the construct.
Likewise, the results of the present study, as well as the one conducted in the general population of Peru based on IRT models,16 highlight that the data adequately fit the GRM model. At a practical level, a high discrimination value indicates that the person has a greater facility to differentiate the choice of a response alternative in the items, depending on the presence of coronaphobia. Thus, even in people who might have similar levels of coronaphobia, specific response patterns can be observed that allow for a more accurate measure of the construct in the population. The difficulty parameter for each item threshold is related to the level of the trait that people must have in order to choose one of the response alternatives. Virtually all items have a difficulty value at the first threshold equal to or greater than 0, so for an older adult to have an average probability of choosing a response alternative 1, 2, 3 or 4, he or she must have at least an average trait level of coronavirus anxiety.27 The TIC indicates that the CAS can be used to detect average and high levels of coronaphobia in the general adult population.
When analyzing each information curve (IIC), we observe an excellent performance for items 3, 5 and 2, while the fourth and first items do not seem to be collecting information about the construct as directly as the rest. This may occur when the situations posed in the items are more particular and/or infrequent in the participants evaluated. Likewise, these items (1 and 4) are the ones that present the lowest discrimination index values. It is important to note that, although the information curve of item 3 (which is the most important item) is very similar to that of the entire scale (TIC), it cannot collect the same amount of information as the 5 items at the same time.
Additionally, evidence of convergent validity of the CAS was evaluated. First, the positive relationship between coronaphobia and anxiety suggests that anxiety generated by COVID-19 seems to be associated with the presence of general anxiety symptoms. This is to be expected, since many of the physiological symptoms measured by the CAS items (such as the presence of dizziness, sleep disturbances, nausea, and abdominal discomfort) are also associated with anxiety disorder.10,11 Second, coronaphobia shows a close relationship with the presence of depressive symptomatology. The fact that the correlation between coronaphobia and depression has a lower value, compared to that observed with anxiety, would allow for measuring anxiety-specific symptomatology. This is consistent with previous studies which reported that increased anxiety and depression during the COVID-19 pandemic indicate a clinically significant deterioration in mental health.11,13 Constant exposure to negative information about COVID-19 and worry about becoming infected appears to generate anxiety and depression, the levels of which may increase as confinement is extended.38
The study has some limitations. First, the participants were selected by snowball sampling. This could generate the appearance of a possible selection bias that limits the generalizability of the results. In this regard, future studies should use stratified sampling to obtain a representative sample of older adults. Additionally, it would be important for future studies to replicate the findings in larger samples of older adults. Despite the sample size, it has been shown that if a factor has four or more factor loadings greater than .60, as in the present study, the measure is reliable regardless of sample size.39 Moreover, the fact that the communalities in this study were greater than .60 justifies using a sample size of 100.40 Second, the participants were mainly healthy, mostly female, non-institutionalized older adults from the city of Lima. Therefore, the psychometric properties of the CAS should be evaluated in samples of older adults with clinical characteristics and residing in other regions of Peru. For example, future studies could evaluate older adults with medical problems related to a higher risk of death from COVID-19 (such as older adults with diabetes, hypertension, or coronary heart disease) who may experience higher levels of anxiety related to COVID-19. Third, due to the restrictions implemented by the Peruvian government during the COVID-19 pandemic, data were only collected through an online survey. This meant that older adults with limited Internet access were not represented. Fourth, the questionnaires used were self-administered, which could cause social desirability bias. Fifth, the study had a cross-sectional design that does not permit a causal interpretation of the relationships between coronaphobia, anxiety and depression. Because the pandemic is not fully controlled worldwide, different peaks of anxiety may appear due to COVID-19. Therefore, longitudinal studies assessing the evolution of COVID-19 anxiety are recommended.
Despite these limitations, the results provide empirical support to expand the growing body of research on coronaphobia. Furthermore, to our knowledge, this is the first study to evaluate the psychometric properties of the Spanish version of the CAS specifically in a sample of older adults. Previous studies with the Spanish version of the CAS only had a small percentage of older adults.16 In addition, the use of modern psychometric techniques is an important strength of the present study, only found elsewhere in the one conducted in the general population of Peru.16 Likewise, although the CAS was constructed and validated for use in the current context of the COVID-19 pandemic, it could also be used to assess anxiety related to other health pandemics that may appear in the future. To this end, the wording of the items could be modified, replacing the term “COVID-19” with a specific term related to another pandemic, and then undergo the corresponding validation process prior to its formal use.
In conclusion, this study reports that the Spanish version of the CAS applied to Peruvian older adults is a unidimensional instrument, with adequate reliability, and that it is significantly related to anxiety, depression, psychological well-being and psychological distress. In this sense, the Spanish version of the CAS has potential as a brief measure which could be useful in large-scale epidemiological studies, as well as for detecting the presence and magnitude of coronaphobia in the older adult population. However, more studies are needed to better understand the usefulness of the Spanish CAS as an outcome measure that is sensitive for detecting changes produced by the implementation of coronaphobia prevention or intervention programs. These future studies are important, because currently, instruments with adequate psychometric properties are needed to assess changes and/or improvements produced by mental health interventions during the current COVID-19 pandemic.
Conflict of interestsThe authors declared no potential conflicts of interest with respect to the research, authorship, and/or publication of this article.
The following are the supplementary data to this article:
