


The aim of this study is to evaluate the O-POSSUM score capacity to predict the morbidity and mortality of patients undergoing hip fracture surgery.
Material and methodsWe retrospectively reviewed the clinical records of patients older than 65years old, operated on for hip fractures between January 2012 and December 2013. Of 229 patients, the mean age was 82.3years and 170 were women. We collected comorbidities, type of surgery, and expected morbidity and mortality O-POSSUM values.
ResultsAfter a minimum follow up of one year, 38 deaths were reported and 77 patients had complications. The expected mortality according to the O-POSSUM was 35 patients and expected morbidity 132.
ConclusionBy comparing the observed results with those predicted, the O-POSSUM scale is reliable in predicting mortality and overestimates morbidity.
Valorar la capacidad del índice O-POSSUM de predecir la morbimortalidad de los pacientes intervenidos por fractura de la cadera.
Material y métodoSe revisaron retrospectivamente las historias clínicas de todos los pacientes mayores de 65años intervenidos de fracturas de la cadera entre enero de 2012 y diciembre de 2013. Se incluyó a 229 pacientes, la edad media fue de 82,3años y 170 fueron mujeres. Se recogieron patologías asociadas, tipo de cirugía y valores esperados de morbimortalidad O-POSSUM.
ResultadosTras un seguimiento mínimo de un año se registraron 38 fallecimientos, y 77 pacientes tuvieron alguna complicación. La mortalidad esperada, según el O-POSSUM, fue de 36 pacientes, y la morbilidad, de 132.
ConclusiónComparando los resultados observados con los predichos por el sistema, la escala O-POSSUM aplicada a fracturas de la cadera es más fiable en la predicción de mortalidad y sobreestima la morbilidad.
Fractures of the hip or the proximal end of the femur are one of the main health problems in the elderly population, and they give rise to a high level of morbimortality.1
Their incidence is variable and is influenced by demographic, geographic, seasonal, social and economic factors. Given the demographic trends and ageing of the population in Europe, this incidence can be foreseen to increase, reaching two million cases per year.1–3
These fractures are a frequent pathology in elderly patients, and their average annual incidence in Spain stands at 700 cases per 100,000 inhabitants, while they are more frequent in the age range from 85 to 90 years old and in women.1,3,4 Moreover, the patients who survive an episode suffer major functional deterioration, so that only 40–50% recover their condition prior to the fracture. The overall rate of hospital mortality is 5%, and this reaches 30% after follow-up of one year.5,6
Morbimortality scales or indexes have been proposed to make it possible to estimate the level of morbimortality in patients who are going to be subjected to surgery. These scales include the index of the American Society of Anaesthesiologists (ASA), which has been in use since 1963. Several studies prove the relationship between the ASA index and mortality, postoperative complications and hospitalisation. Maxwell et al.7 state that this index is not applicable to patients with a hip fracture as approximately 50% of the patients included in the study are ASA III patients.
The scale studied here is the Physiological and Operative Severity Score for the enUmeration of Mortality and Morbidity (POSSUM), which was developed by Copeland in 1991 to predict the risk of surgical morbimortality. This scale has been used for a wide range of surgical procedures.8–10 This scale has been proven to be an appropriate means of comparing the activity and results of surgeons within a single unit as well as in different specialities.11 In 2002 Mohamed et al.12 adapted the scale and validated it for use in orthopaedic and trauma surgery, mainly by adapting the surgical variables (O-POSSUM).
Together with the Barthel scale the O-POSSUM index is part of the hip fracture patient evaluation protocol prior to surgery in our hospital. It is used to estimate the risk of morbidity and mortality for each patient.
The aim of this study is to evaluate the capacity of the O-POSSUM index to predict the morbimortality of patients operated for hip fracture.
Material and methodStudy design, scope and patientsWe design a non-interventionist longitudinal retrospective prognostic observational study of a cohort of patients over the age of 65 years old with hip fracture, operated using arthroplasty or osteosynthesis in our hospital department from January 2012 to December 2013. 25 patients were excluded from a total of 259 patients with hip fracture, as they fulfilled exclusion criteria: 14 were younger than 65 years old, 10 had been operated using cannulated screws, and one was excluded for both reasons. Patients in which cannulated screws were used for repair were excluded to make the series uniform and eliminate possible distortion when evaluating the predictive power of the O-POSSUM, given that these younger patients (with an average age of 66 years old) would have morbimortality values in the O-POSSUM far lower than the average.
Study variablesThe clinical histories of the patients were reviewed and a database was designed to contain their demographic values (sex and age), Barthel scale values, the O-POSSUM index, the type of fracture (subcapital, pertrochanter or subtrochanter), type of reduction (open or closed) and the procedure used (osteosynthesis or arthroplasty). Local or general complications immediately after the operation and during follow-up were also recorded, as was survival during the 12 month period after surgery.
Data analysisAnalysis of quantitative and qualitative variables that predict morbimortalityThe patients were divided into two groups according to the appearance of adverse events (complications or death). The possible predictive variables of these events were then compared:
For quantitative variables averages were compared using the Student t-test, including variables such as age, estimated Barthel scale score prior to the fracture and mortality (MT) values y morbidity (MB) values on the O-POSSUM index.
For qualitative variables proportions were compared using contingency tables, and statistical significance was tested using Pearson's chi-squared test. The variables here were the type of fracture, ASA scale score, admission to the intensive care unit (ICU) after surgery and the need for open reduction.
The Student t-test was used to compare the average MB and MT values of the O-POSSUM index of the patients with ASA III or higher.
Evaluation of the discrimination of the test by preparing morbimortality ROC curvesTo evaluate the utility of the diagnostic test the degree to which it is exact must be known. In our case this involved knowing whether the test truly classified patients according to their risk index. Although we express exactitude in terms of sensitivity and specificity, risk scales that use measurements in continuous or discrete nominal scales exclude expressing validity using sensitivity and specificity. This is why we use levels that make it possible to estimate a dichotomised classification of the values.
In this procedure we find Receiver Operating Characteristic (ROC)6 analysis. This was introduced in medicine by Swets and Pickett to measure the results of radiological tests. To obtain the ROC curve an S and an E are calculated for each one of the values and are shown in a graph where S is the ordinate axis and 1−E is the abscissa axis.
We use this to calculate the area under the ROC curve for morbimortality with its respective intervals of confidence at 95% (CI 95%), so that the highest value of the area under the ROC curve corresponds with the highest discriminatory power. An area of from 0.70 to 0.79 is considered to be acceptable, while one from 0.80 to 0.89 is good and 0.90 or more is excellent.
All statistical analyses were performed using the SPSS Statistics computer program.
ResultsPatients and study scopeThe clinical histories of 229 patients operated for hip fracture were reviewed retrospectively. Their average age was 82.3 years old (ranging from 65 to 97 years old). One hundred and seventy were women (74.4%) and 59 were men (25.76%), with a men/women ratio of 1:2.88.
The Barthel index score was calculated at admission for all of the patients, as was their morbimortality score on the O-POSSUM index. The average score on the Barthel scale was 84 (ranging from 100 to 25) and the average O-POSSUM morbimortality score was 57.84% (ranging from 13% to 93%) and the average mortality on the O-POSSUM scale was 16.59% (ranging from 1% to 87%).
Regarding fracture type, there were 76 capsular (subcapital) fractures and 133 extracapsular fractures (127 pertrochanter and 26 subtrochanter fractures). All of the capsular fractures were treated by partial hip arthroplasty (PHA), except for 15 that were treated by total hip arthroplasty (THA). 121 of the extracapsular fractures were treated using nails, 29 by DHS and 3 by PHA. Twenty patients required admission to the ICU during the immediate postoperative period.
There were 43 general complications, including 17 cardiovascular complications (new onset atrial fibrillation, one episode of heart failure, SCASEST), 7 episodes of pneumonia and respiratory failure, 5 episodes of renal and urological complications (UTI, acute kidney failure), 5 episodes of digestive complications (intestinal obstruction, fecaloma, billiary colic), 4 episodes of neurological complications, 2 patients with episodes of sacral ulcer infection, 2 episodes of deep vein thrombosis and one episode of pulmonary thromboembolism. There were 32 complications associated with the surgical wound, including 25 patients with surgical wound exudate but without objective evidence of infection, 5 infections (exudate with positive cultures) and 2 seromas. 38 deaths were recorded during the first year after the operation.
Analysis of the quantitative and qualitative variables that predict morbimortalityThe patients were divided into two groups, depending on the appearance of adverse events (complications or death), and the possible predictive variables of the said events were compared:
- -
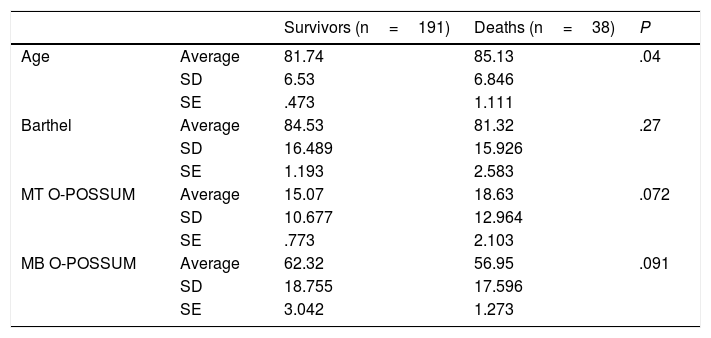
For the quantitative variables averages were compared using the Student t-test, and the following variables were included: age, estimated Barthel scale score prior to the fracture and MT and MB scores on the O-POSSUM index (Tables 1 and 2).
Table 1.Comparison of quantitative variables in deaths.
Survivors (n=191) Deaths (n=38) P Age Average 81.74 85.13 .04 SD 6.53 6.846 SE .473 1.111 Barthel Average 84.53 81.32 .27 SD 16.489 15.926 SE 1.193 2.583 MT O-POSSUM Average 15.07 18.63 .072 SD 10.677 12.964 SE .773 2.103 MB O-POSSUM Average 62.32 56.95 .091 SD 18.755 17.596 SE 3.042 1.273 SD: standard deviation; SE: standard error; MB: morbidity; MT: mortality.
Table 2.Comparison of quantitative variables in patients with complications.
No complications (n=151) With complications (n=77) P Age Average 81.61 83.73 .024 SD 6.722 6.456 SE .547 0.736 Barthel Average 85.30 81.23 .076 SD 15.430 17.976 SE 1.256 2.049 MT O-POSSUM Average 15.15 16.77 .3 SD 11.207 11.030 SE .912 1.257 MB O-POSSUM Average 56.75 60.21 .16 SD 18.091 17.309 SE 1.472 1.972 SD: standard deviation; SE: standard error; MB: morbidity; MT: mortality.
- -
When the patients who had a complication or died were analysed, together with those who suffered no adverse event, there were no statistically significant differences in connection with the morbidity or mortality scores predicted by the O-POSSUM system.
- -
Statistically significant differences were found for age, and the average age of those patients who suffered complications or died was higher (P<.05).
- -
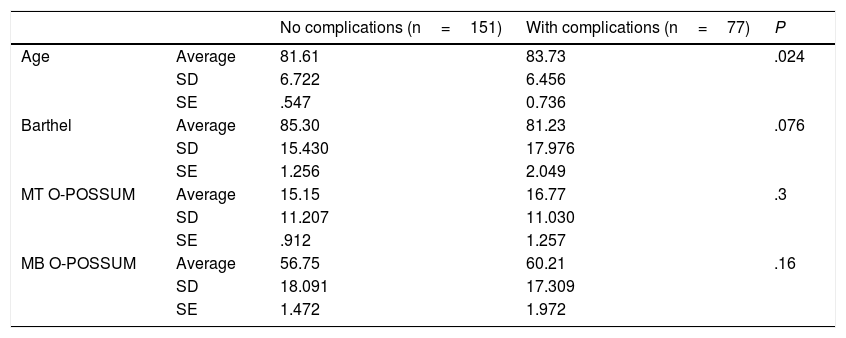
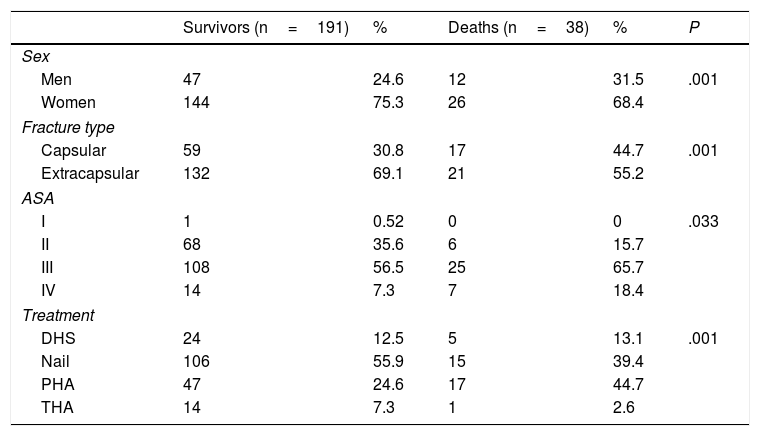
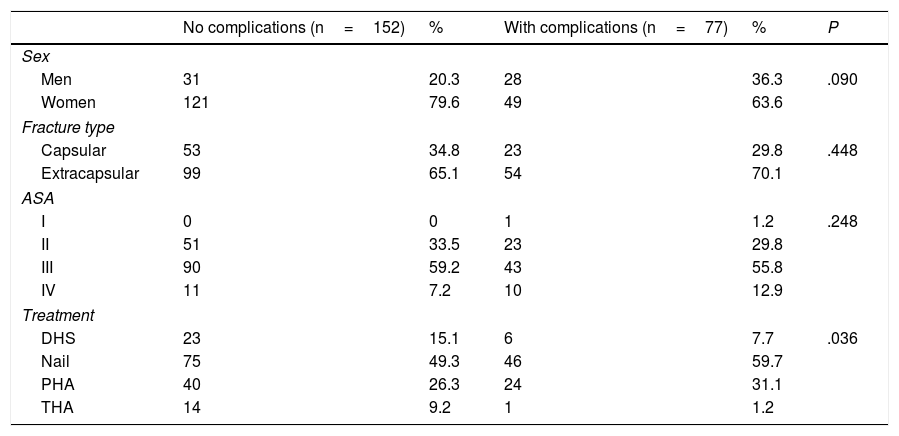
For the qualitative variables proportions were compared using contingency tables, and statistical significance was tested using Pearson's chi-squared test for the following variables: sex, fracture type, ASA index score, admission to the ICU after surgery and the need for open reduction (Tables 3 and 4).
Table 3.Comparison of qualitative variables in deaths.
Survivors (n=191) % Deaths (n=38) % P Sex Men 47 24.6 12 31.5 .001 Women 144 75.3 26 68.4 Fracture type Capsular 59 30.8 17 44.7 .001 Extracapsular 132 69.1 21 55.2 ASA I 1 0.52 0 0 .033 II 68 35.6 6 15.7 III 108 56.5 25 65.7 IV 14 7.3 7 18.4 Treatment DHS 24 12.5 5 13.1 .001 Nail 106 55.9 15 39.4 PHA 47 24.6 17 44.7 THA 14 7.3 1 2.6 Table 4.Comparison of qualitative variables in patients with complications.
No complications (n=152) % With complications (n=77) % P Sex Men 31 20.3 28 36.3 .090 Women 121 79.6 49 63.6 Fracture type Capsular 53 34.8 23 29.8 .448 Extracapsular 99 65.1 54 70.1 ASA I 0 0 1 1.2 .248 II 51 33.5 23 29.8 III 90 59.2 43 55.8 IV 11 7.2 10 12.9 Treatment DHS 23 15.1 6 7.7 .036 Nail 75 49.3 46 59.7 PHA 40 26.3 24 31.1 THA 14 9.2 1 1.2 - -
When the patients who had a complication or died are examined and compared with those who had no adverse event, male sex, fracture type (subcapital), ASA IV prior to surgery and PHA as treatment are associated more frequently with death in a way that is statistically significant, although this is not the case for complications. Admission to the ICU after surgery and the need for open reduction are not associated with a higher frequency of complications or death.
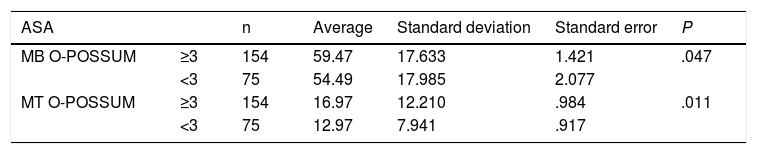
An ASA score higher or equal to III is correlated with higher morbimortality scores on the O-POSSUM index (Table 5).
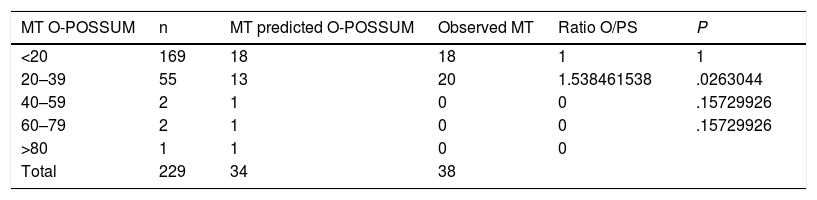
Graphic analysisFor a better comparative study of the number of deaths observed vs the number of deaths predicted by the system, and of the number of complications observed vs the number of complications predicted by the system, 5 risk groups were considered with increasing morbimortality according to O-POSSUM system score. These comparisons are shown in graphic format in Tables 6 and 7.
- -
Regarding mortality, in the under 20% and over 40% risk subgroups a good correlation was found between real/observed events and those predicted by the O-POSSUM system. Nevertheless, in the 20–39% mortality group observed mortality was higher than the level predicted by the system, and there were no deaths in the other groups (Fig. 1).
- -
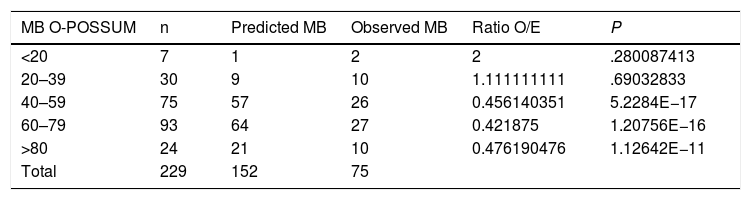
Regarding morbidity, no good correlation was found between real/observed events and those predicted by the O-POSSUM system in the risk groups above 20%, and the system always tended to overestimate morbidity (Fig. 2).


Morbidity according to observed and predicted risk subgroups.
| MB O-POSSUM | n | Predicted MB | Observed MB | Ratio O/E | P |
|---|---|---|---|---|---|
| <20 | 7 | 1 | 2 | 2 | .280087413 |
| 20–39 | 30 | 9 | 10 | 1.111111111 | .69032833 |
| 40–59 | 75 | 57 | 26 | 0.456140351 | 5.2284E−17 |
| 60–79 | 93 | 64 | 27 | 0.421875 | 1.20756E−16 |
| >80 | 24 | 21 | 10 | 0.476190476 | 1.12642E−11 |
| Total | 229 | 152 | 75 |
The capacity of the index to differentiate between patients who survived and those who died or who suffered general or local complications was calculated by measuring the area under the diagnostic performance curve (the ROC curve).
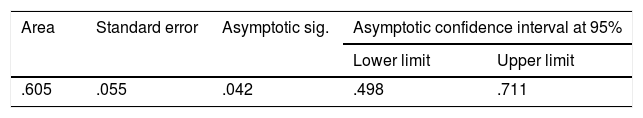
Regarding mortality, there were 38 deaths. When these are shown in the graph the area under the curve can be seen to be 0.605 (CI 95%: .498–.711). The highest value of the area under the ROC curve corresponds to the greatest discriminatory power; an area of .70–.79 is considered acceptable, while from .80–.89 is good and .90 or more is excellent (Table 8, Fig. 3).

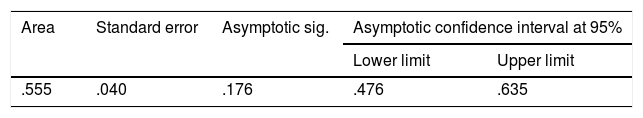
In the case of morbidity, 77 patients had complications, and when the data are shown over the curve a ROC curve is calculated with an area under it is .55, with a CI of 95% and from .476 to .635 (Fig. 4, Table 9).
DiscussionInterpretation, applicability and uses of the results
Hip fractures are associated with a high level of postoperative morbimortality. Ethical, juridical and economic considerations come into play when evaluating elderly patients with hip fracture, as well as purely medical ones. Exact knowledge of expected mortality is an important part of the decision-making process.13
There is increasing interest in the benefits that a multidisciplinary approach offers for elderly patients with hip fracture. A range of methods are currently used to help lead to better evaluation prior to anaesthesia, less invasive orthopaedic surgery and the inclusion of internal medicine specialists with an orthogeriatric approach from the moment of admission to hospital. In some hospitals all hip fracture patients are evaluated by the anaesthesiology team at admission and once again before surgery, if this takes place after 48h.
Other hospitals use “preoperative optimisation centres” for all hip fracture patients. Admission to these areas makes it possible to optimise their liquid and electrolyte balances, analgesia and the correction of arrhythmias with assessment by the anaesthesia team and/or intensive medicine specialists. This approach may lead to more effective planning of surgery, with fewer cancellations of operations and better postoperative results.
Within this context, morbimortality prognostic indexes have been designed to estimate the severity of hospitalised patients, although they also permit the evaluation of the medical quality of the treatment used by comparing actual mortality with expected mortality. These scales are also used to stratify patients in clinical studies, and they may form a part of clinical treatment guides.
The ASA classification has been used as a tool to evaluate patients prior to surgery for more than 50 years. It has been shown to correlate with mortality after hip fracture surgery.14 Other authors7 consider this index to lack validity, given that more than 50% of hip fracture patients are ASA III or IV, so that its discriminatory power is reduced. Others15 say that its correlation with functional recovery after hip surgery is poor. In our study ASA IV patients were associated with a higher level of mortality after 12 months of follow-up.
A systematic review conducted in 2012 found 7 papers from 2002 to 2010 that had the objective of identifying parameters or scales able to predict mortality in hip fracture cases. Alegre-López et al.16 observe that male sex, mental deterioration, restricted functional capacity prior to the fracture and previous institutionalisation were the most significant variables to be independently associated with mortality. In our study, male sex, subcapital fracture (treated by partial prosthesis) and age were all associated with higher levels of morbimortality 12 months after surgery.
Some studies in the bibliography support the O-POSSUM scale as a hospital morbimortality and long-term survival predictor in cases of hip fracture.17 In 2011 Van Zeeland et al.18 published a series of 272 patients with an area under the curve of 0.83 (CI 95%: 0.76–0.89). In their study Burgos et al.19 considered that the VAS – risk scale, the POSSUM scoring system and the Charlson index attained sufficient predictive value to be able to predict walking after 3 months, although none of these scales was found able to predict mortality at 90 days.
In general in our series the average rate of mortality at one year predicted by the system (15%) was close to the actual figure (16%). However, this closeness is lost when the comparison is made in risk subgroups, and the system is more reliable for mortality than it is for morbidity. Although it underestimates mortality in low risk groups, it tends to overestimate morbidity in risk groups above 40%.
However, there are studies in the literature20 which conclude that the O-POSSUM SCALE overestimates the real level of morbimortality. In 2015 Bao et al.21 published a series of 779 cases of planned orthopaedic surgery in which the “modified POSSUM” was applied, including the ejection fraction to increase its exactitude. They concluded that it overestimates morbidity, as it predicted a rate of 27.2% when the actual rate was 8.3%. This study included patients operated for a range of pathologies, in an age range of 12–96 years old. This study included the ejection fraction detected by echocardiography as a morbidity predictor. Ramanathan et al.,22 in a study of 1164 patients with hip fracture, found that the O-POSSUM scale predicted 181 (15.6%) deaths, while the observed mortality was 119 (10.2%); the area under the ROC curve was .62, indicating defective performance by the O-POSSUM equation. They conclude that the O-POSSUM index overestimates mortality in hip fracture patients, so that it should be used with precaution, as an auditing tool or as a part of preoperative triage. In our study, the area under the ROC curve was .6 for mortality and .55 for morbidity, including .5 in both cases in the 95% CI.
Maxwell et al.7 worked in the same group as Ramanathan. In their study they develop a scoring system that combines the Nottingham Hip Fracture Score with those for a series of mortality-predictive variables at 30 days. These variables are: aged (66–85 years old, or older than 86), sex (male), number of comorbidities (2 or more), score in the mini-mental test (6 or more from 10), haemoglobin concentration at admission (10 or lower), living in an institution and the presence of a malign disease. This scoring system predicts the probability of mortality at 30 days for patients after hip fracture, with an area under the curve of .71.
Difficulties and limitations of this studyIn a review of the bibliography published in 201523 that compared the applicability and restrictions of O-POSSUM, the Charlson comorbidities index (CCI) and the Nottingham Hip Fracture Score (NHS), it is pointed out that the O-POSSUM uses intraoperative data and should not be used to evaluate risk prior to surgery. Nevertheless, Bonicoli et al.24 state that if the postoperative course can be predicted before surgery, this will help to obtain the informed consent of the patient and their family, as well as to discuss treatment options depending on estimated risk. In our hospital we agree with this approach, as in the O-POSSUM presurgical data are clear, and those which are purely surgical are easily predictable, so that the O-POSSUM index has value as a prognostic factor and is included in decision-making.
In the discussion of their paper Maxwell et al.7 state that several factors may influence the validity of mortality indexes. These statistical models are developed on the basis of data collected in certain units during a specific period of time. If an index is applied to a sample of patients with different characteristics from those in the original sample then the model may not fit, so that the mortality calculated will not be reliable. On the other hand, the evolution of anaesthetic, surgical and medical care has improved the prognosis for patients. This means that an index based on data from several years ago may calculate excessive mortality for the current quality of care in orthopaedic and trauma surgery units. This is why risk prediction models must be validated before they are used in a specific population.
Another important step is to know whether the tool we use really does measure what we want to measure, and for this it is essential for the professionals who will use the tool to know how to use it. They also need to have basic knowledge about health measurement tests and risk scales, so that before using a tool they should “train” with a large number of patients with similar characteristics. This will allow them to evaluate the utility of the tool and define observer unanimity criteria, thereby minimising inter-observer variability. It is also important to evaluate whether the scale will be useful and repeatable if it is used by several observers. In our case there may be errors due to the retrospective nature of the study, as the scale was applied by different observers so that there may be inter-observer variability.
Final considerationsBased on the data we have obtained we are unable to conclude that the O-POSSUM index is a good index for estimating actual risk. Although it is one of the few scales that estimate risk and mortality simultaneously and may be applied in a wide range of interventions, it is a tool that is only suitable for surgical patients, and it does not individualise patients.
Like other morbimortality indexes, the O-POSSUM is a tool for measuring risk in a population and it does not estimate individualised risk: risk can only be extrapolated to individuals.
When the observed results are compared with the ones predicted by the system, the O-POSSUM scale in hip fracture patients is more useful for predicting mortality than it is for morbidity.
Although it was found to be a somewhat more useful system for measuring mortality than morbidity, its area under the ROC curve values are not close to .7, which is considered to be an acceptable level. We therefore consider that this index lacks acceptable discriminatory power in hip fracture patients in our environment.
Recommendations for future researchIn our experience calculating the O-POSSUM index as a means of optimising the preoperative evaluation of hip fracture patients is a task involving intermediate complexity. This is because it requires a large number of complementary tests (analysis, electrocardiogram, thoracic X-ray) which give rise to a great many variables that have to be evaluated and interpreted by specialists in areas other than trauma, all at the moment of admission.
It would be ideal to obtain a predictive index of morbimortality that made it possible to know the degree of risk for each patient that would be easy and swift to carry out and which could be calculated by the personnel who see the patient at first (nurses or interns). This would permit reliable and reproducible discrimination between patients at high and low surgical risk, to decide on surgical indications and inform the patient and their family.
Level of evidenceLevel of evidence IV.
Conflict of interestsThe authors have no conflict of interests to declare.
Please cite this article as: Blay-Domínguez E, Lajara-Marco F, Bernáldez-Silvetti PF, Veracruz-Gálvez EM, Muela-Pérez B, Palazón-Banegas MÁ, et al. Índice O-POSSUM como predictor de morbimortalidad en pacientes intervenidos de fractura de cadera. Rev Esp Cir Ortop Traumatol. 2018;62:207–215.
