


Traumatic pathology continues to represent an important socio-health problem. The aim of the study was to assess the clinical predictors of total expenditure, as well as to analyse which components of the cost are modified with each clinical parameter of the polytraumatized patient.
Material and methodsRetrospective study of 131 polytrauma patients registered prospectively. A statistical analysis was carried out to assess the relationship between clinical parameters, the total cost and the cost of various treatment components.
ResultsThe total cost of hospital admission was 3,791,879 euros. The average cost per patient was €28,945.
Age and gender were not predictors of cost. The scales ISS, NISS and PS were predictors of the total cost and of multiple treatment components.
The AIS of Skull and Thorax predicted a higher cost of admission to ICU and Total Cost. The AIS of lower limbs was associated with greater spending on facets of treatment related to surgical activity.
DiscussionThere are clinical parameters that are predictors of the treatment cost of the polytraumatized patient. The study describes how the type of trauma that the patient suffers modifies the type of expenses that will present in their hospital admission.
ConclusionsPolytraumatized patients with severe multisystem injury present increased costs in multiple components of the treatment cost. Patients with TBI or chest trauma present a higher cost for admission to ICU and those with orthopaedic trauma are associated with greater expenditure on surgical activity.
La enfermedad traumática continúa representando un importante problema socio-sanitario. El objetivo del estudio es valorar predictores clínicos del gasto total, así como analizar que componentes del coste se modifican con cada parámetro clínico del politraumatizado.
Material y métodosEstudio retrospectivo de 131 politraumatizados registrados prospectivamente. Se llevó a cabo un análisis estadístico para valorar la relación entre parámetros clínicos, el coste total y el coste de los principales componentes del tratamiento.
ResultadosEl coste total del ingreso hospitalario fue de 3.791.879 euros. El gasto medio por paciente fue de 28.945 €.
La edad y el género no fueron predictores del coste. Las escalas ISS, NISS y PS fueron predictores del coste total y del coste de diferentes facetas del tratamiento.
El AIS de cráneo y tórax predijo un mayor coste de ingreso en UCI y de coste total. El AIS de miembros inferiores se asoció exclusivamente a un mayor gasto en las facetas de tratamiento relacionadas con la actividad quirúrgica.
DiscusiónExisten parámetros clínicos que son predictores del coste de tratamiento del paciente politraumatizado. En el estudio se describe como el tipo de traumatismo que presenta el paciente modifica el tipo de gastos que presentará en su ingreso hospitalario.
ConclusionesLos pacientes politraumatizados que presentan lesión multisistémica grave presentan incremento del gasto en múltiples componentes del coste de tratamiento. Los pacientes donde predomina el TCE o traumatismo torácico presentan un mayor coste por ingreso en la UCI y los que predomina el traumatismo ortopédico asocian un mayor gasto en actividad quirúrgica.
Injuries caused by trauma are a tremendous public health problem and a great load on Orthopaedic Services, regardless of the socioeconomic level of development of a country.1,2 According to the World Health Organization, approximately 5 million people around the world died from traumatic injuries in 2000,3 with this being one of the main causes of death and disability among people under 60 years of age. In Spain, 14,903 people died in 2014 due to external causes; this is the sixth cause of mortality.4,5
Public health spending in Spain in 2014 was €66,826 million, representing 6.4% of the gross domestic product (GDP).4 The percentage of healthcare spending devoted to multiple trauma patients in Spain is unknown. Attention to these patients represents 10% of the total health expenditure in the USA and around 3%–4.3% of the GDP in countries such as South Korea and China.6–8 It is consequently clear that traumatic conditions are an important economic burden and that knowing the factors involved in the total cost, as well as the distribution of the costs to the trauma patient, would be extremely useful.
This study does not attempt to carry out a cost analysis. The objective of this study was to analyse how the characteristics of severe trauma patients and their injuries modify the overall hospital cost and the distribution of these expenses within the main treatment areas.
Material and methodsThis was a retrospective review of severe traumatised patients registered prospectively in the Traumasur database during 2008. Traumasur is a prospective register of patients older than 14 years of age having trauma injury with an Injury Severity Score (ISS) >9 that was created in our centre in 2003. Our study patients had the following inclusion criteria:
- 1.
Severe trauma with ISS >15.
- 2.
A complete record of both clinical patient data and financial data.
A total of 205 patients were treated in our centre for traumatic injuries with ISS >9 during the study period. However, 42 of these patients had incomplete clinical or demographic data, which left 163 patients. Of these, individuals with ISS >15 were selected and, finally, we identified a total of 131 patients who satisfied the inclusion criteria.
Clinical data were gathered from patient records and from the data in the Traumasur database, including age, sex and the injury severity score assessed with the following scales: ISS,9 New Injury Severity Score (NISS),10 probability of survival (PS)11,12 and Abbreviated Injury Scores (AISs) for the head, thorax, abdomen and lower limbs (LLs)13; including the stay in Intensive Care Unit (days) and the stay in hospital wards (days) as well.
Financial data were obtained from the Unit of Management Control of our hospital. The costs of attention to the patient can be estimated using 2 different methods:
- 1.
The traditional method, known as “top-bottom”, in which the total cost of a service is divided among the patients according to the complexity of each one.
- 2.
A mixed method, “bottom-top” or allocation of cost per patient, in which the costs are individually calculated for each patient, taking into consideration the actions received in a personalised manner. The advantage of the second method is that it provides more complete information about the composition of the total cost.14 This was the method used in this study.
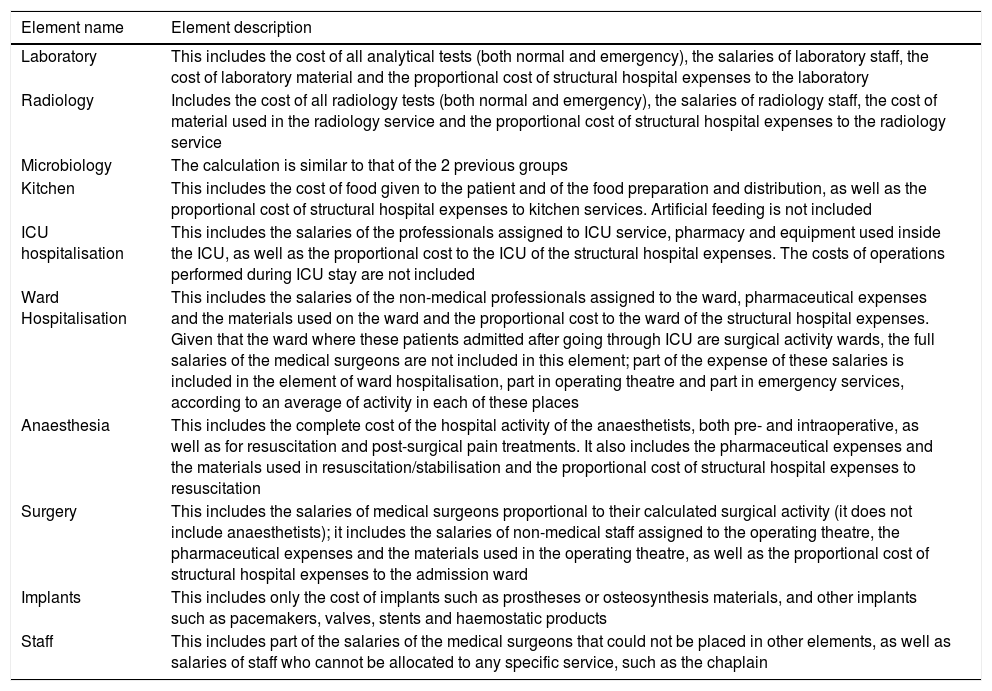
To calculate the total cost per patient all the expenses caused by the patient in any component of hospital treatment were considered. There are some main treatment components that are present in the great majority of patients, which are described in Table 1. To calculate the relationship between patients’ clinical characteristics and of their injuries on cost, we used the categories that represented the largest percentage of the total expenditure: ICU stay, ward hospitalisation, anaesthesia, operating theatre, implants and staff. The elements anaesthesia, operating theatre and implants can be understood as parts of surgical activity. Consequently, an artificial element, the sum of the 3, given the name of surgery, was created for our study comparisons.
Main expense elements and their description.
| Element name | Element description |
|---|---|
| Laboratory | This includes the cost of all analytical tests (both normal and emergency), the salaries of laboratory staff, the cost of laboratory material and the proportional cost of structural hospital expenses to the laboratory |
| Radiology | Includes the cost of all radiology tests (both normal and emergency), the salaries of radiology staff, the cost of material used in the radiology service and the proportional cost of structural hospital expenses to the radiology service |
| Microbiology | The calculation is similar to that of the 2 previous groups |
| Kitchen | This includes the cost of food given to the patient and of the food preparation and distribution, as well as the proportional cost of structural hospital expenses to kitchen services. Artificial feeding is not included |
| ICU hospitalisation | This includes the salaries of the professionals assigned to ICU service, pharmacy and equipment used inside the ICU, as well as the proportional cost to the ICU of the structural hospital expenses. The costs of operations performed during ICU stay are not included |
| Ward Hospitalisation | This includes the salaries of the non-medical professionals assigned to the ward, pharmaceutical expenses and the materials used on the ward and the proportional cost to the ward of the structural hospital expenses. Given that the ward where these patients admitted after going through ICU are surgical activity wards, the full salaries of the medical surgeons are not included in this element; part of the expense of these salaries is included in the element of ward hospitalisation, part in operating theatre and part in emergency services, according to an average of activity in each of these places |
| Anaesthesia | This includes the complete cost of the hospital activity of the anaesthetists, both pre- and intraoperative, as well as for resuscitation and post-surgical pain treatments. It also includes the pharmaceutical expenses and the materials used in resuscitation/stabilisation and the proportional cost of structural hospital expenses to resuscitation |
| Surgery | This includes the salaries of medical surgeons proportional to their calculated surgical activity (it does not include anaesthetists); it includes the salaries of non-medical staff assigned to the operating theatre, the pharmaceutical expenses and the materials used in the operating theatre, as well as the proportional cost of structural hospital expenses to the admission ward |
| Implants | This includes only the cost of implants such as prostheses or osteosynthesis materials, and other implants such as pacemakers, valves, stents and haemostatic products |
| Staff | This includes part of the salaries of the medical surgeons that could not be placed in other elements, as well as salaries of staff who cannot be allocated to any specific service, such as the chaplain |
ICU, intensive care unit.
Statistical analysis: A general descriptive study was carried out on the different variables of the analysis. A summary of the information about the variables, for qualitative, non-numeric variables, is presented using absolute frequency distribution and percentage. Numeric or quantitative variables are described by means of their measures of central tendency, mean and median, accompanied by dispersion, standard deviation and interquartile range.
The association between qualitative variables was performed using the Pearson chi-squared test or Fischer's exact test, if more than 25% of the expected were less than 5. In the case of ordinal variables, the hypothesis of linear trend in proportions was contrasted using the Mantel-Haenszel test.
The relationship between qualitative and quantitative variables was studied using the t-test, 2 groups, or the analysis of the variance, more than 2 groups, using the Bonferroni correction to study the comparisons 2 by 2. If normality was unfulfilled, the Kolmogorov–Smirnov test, the non-parametric Kruskal–Wallis test was used. The association between quantitative variables was studied by means of the Pearson or Spearman correlation coefficient.
As for multivariate analysis, linear regression techniques were used to quantify the effect of different independent variables on the response variable. The alpha and beta coefficients are presented for each variable and model. The assessment of each variable and model is quantified with “R squared”, variability of the response variable explained by the value of the model. The “R squared” value that is presented by values from 0 to 1 and describes the variability percentage of the dependent variable explained by the variable analysed or by a model of a set of variables.
A final multivariate model was built considering both the variables with a significant result in the univariate analysis and those that were of interest or relevance in this study.
Given that cost does not behave like a standard variable, we defined the cost logarithm (cost Ln) based on the following formula: cost Ln=α+([β1×x]+[β2×y]+[…]), where “x” is the value of each variable to analyse and “β” represents how the dependent variable is changed for each point that modifies the variable studied.
The level of statistical significance for all the contrasts was set to 0.05.
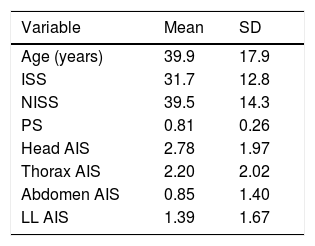
ResultsOf the 131 patients included in the study, there were 105 men and 26 women, with a mean age of 39.9 years. The characteristics of the group are described in Table 2.
Clinical parameters.
| Variable | Mean | SD |
|---|---|---|
| Age (years) | 39.9 | 17.9 |
| ISS | 31.7 | 12.8 |
| NISS | 39.5 | 14.3 |
| PS | 0.81 | 0.26 |
| Head AIS | 2.78 | 1.97 |
| Thorax AIS | 2.20 | 2.02 |
| Abdomen AIS | 0.85 | 1.40 |
| LL AIS | 1.39 | 1.67 |
AIS, Abbreviated Injury Scale; ISS, Injury Severity Score; LL, lower limb; NISS, New Injury Severity Score, PS, probability of survival; SD, standard deviation.
We identified 23 patients who died in hospital admission, yielding a mortality of 17.5%. The mean age of the deceased patients was 41.3 years. The causes of mortality are described in Fig. 1. Nine patients died during their ICU stay, so only 14 of the patients who died were actually admitted to the ward.

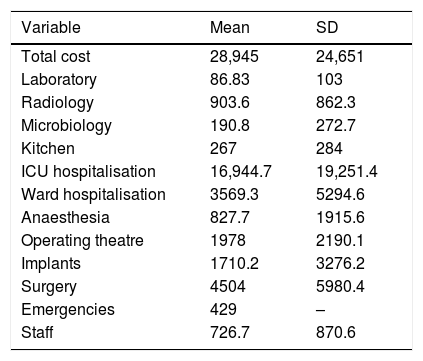
The total cost of hospital admission for the study group was €3,791,879. Mean expenditure per patient was €28,945. The distribution of costs among the different categories included in this study is shown in Table 3.
Overall cost in Euros divided into the main elements.
| Variable | Mean | SD |
|---|---|---|
| Total cost | 28,945 | 24,651 |
| Laboratory | 86.83 | 103 |
| Radiology | 903.6 | 862.3 |
| Microbiology | 190.8 | 272.7 |
| Kitchen | 267 | 284 |
| ICU hospitalisation | 16,944.7 | 19,251.4 |
| Ward hospitalisation | 3569.3 | 5294.6 |
| Anaesthesia | 827.7 | 1915.6 |
| Operating theatre | 1978 | 2190.1 |
| Implants | 1710.2 | 3276.2 |
| Surgery | 4504 | 5980.4 |
| Emergencies | 429 | – |
| Staff | 726.7 | 870.6 |
ICU, intensive care unit; SD, standard deviation.
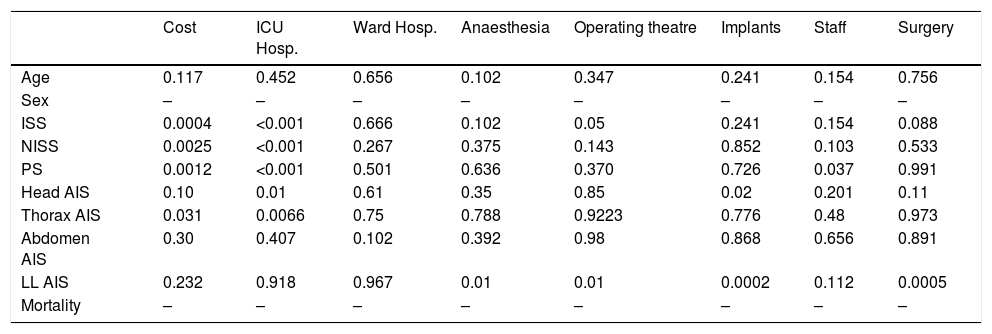
There was no statistically significant correlation between the age and the cost of patient care. There was no correlation found between sex and cost either (Tables 4 and 5).
Statistical significance (P<.05) of the correlations between the study parameters and the total cost and the cost of the different elements. Variables analysed as continuous.
| Cost | ICU Hosp. | Ward Hosp. | Anaesthesia | Operating theatre | Implants | Staff | Surgery | |
|---|---|---|---|---|---|---|---|---|
| Age | 0.117 | 0.452 | 0.656 | 0.102 | 0.347 | 0.241 | 0.154 | 0.756 |
| Sex | – | – | – | – | – | – | – | – |
| ISS | 0.0004 | <0.001 | 0.666 | 0.102 | 0.05 | 0.241 | 0.154 | 0.088 |
| NISS | 0.0025 | <0.001 | 0.267 | 0.375 | 0.143 | 0.852 | 0.103 | 0.533 |
| PS | 0.0012 | <0.001 | 0.501 | 0.636 | 0.370 | 0.726 | 0.037 | 0.991 |
| Head AIS | 0.10 | 0.01 | 0.61 | 0.35 | 0.85 | 0.02 | 0.201 | 0.11 |
| Thorax AIS | 0.031 | 0.0066 | 0.75 | 0.788 | 0.9223 | 0.776 | 0.48 | 0.973 |
| Abdomen AIS | 0.30 | 0.407 | 0.102 | 0.392 | 0.98 | 0.868 | 0.656 | 0.891 |
| LL AIS | 0.232 | 0.918 | 0.967 | 0.01 | 0.01 | 0.0002 | 0.112 | 0.0005 |
| Mortality | – | – | – | – | – | – | – | – |
AIS, Abbreviated Injury Scale; Hosp., hospitalisation; ISS, Injury Severity Score; LL, lower limb; NISS, New Injury Severity Score; PS, probability of survival; SD, standard deviation.
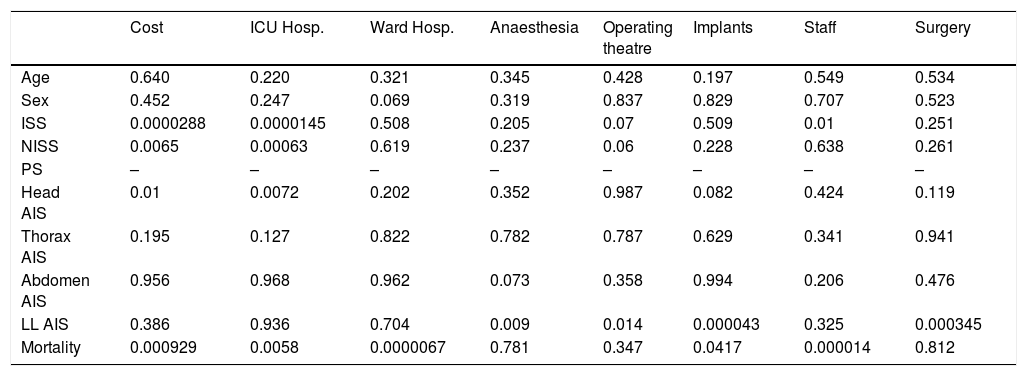
Statistical significance (P<.05) of the correlations between the study parameters and the total cost and the cost of the different elements. Variables analysed as categorical.
| Cost | ICU Hosp. | Ward Hosp. | Anaesthesia | Operating theatre | Implants | Staff | Surgery | |
|---|---|---|---|---|---|---|---|---|
| Age | 0.640 | 0.220 | 0.321 | 0.345 | 0.428 | 0.197 | 0.549 | 0.534 |
| Sex | 0.452 | 0.247 | 0.069 | 0.319 | 0.837 | 0.829 | 0.707 | 0.523 |
| ISS | 0.0000288 | 0.0000145 | 0.508 | 0.205 | 0.07 | 0.509 | 0.01 | 0.251 |
| NISS | 0.0065 | 0.00063 | 0.619 | 0.237 | 0.06 | 0.228 | 0.638 | 0.261 |
| PS | – | – | – | – | – | – | – | – |
| Head AIS | 0.01 | 0.0072 | 0.202 | 0.352 | 0.987 | 0.082 | 0.424 | 0.119 |
| Thorax AIS | 0.195 | 0.127 | 0.822 | 0.782 | 0.787 | 0.629 | 0.341 | 0.941 |
| Abdomen AIS | 0.956 | 0.968 | 0.962 | 0.073 | 0.358 | 0.994 | 0.206 | 0.476 |
| LL AIS | 0.386 | 0.936 | 0.704 | 0.009 | 0.014 | 0.000043 | 0.325 | 0.000345 |
| Mortality | 0.000929 | 0.0058 | 0.0000067 | 0.781 | 0.347 | 0.0417 | 0.000014 | 0.812 |
Intervals of categorical variables analysed: Age: 15–44, 45–74, >75; ISS: 15–25, 26–35, >35; NISS: 15–25, 26–35, > 35; AIS <3, ≥ 3.
AIS, Abbreviated Injury Scale; Hosp., hospitalisation; ISS, Injury Severity Score; LL, lower limb; NISS, New Injury Severity Score; PS, probability of survival; SD, standard deviation.
The ISS, NISS and PS scales showed a statistically significant correlation with overall cost and with cost of ICU stay. Likewise, these 3 scales showed a correlation with several treatment components, such as operating theatre and staff. This correlation varied according to whether the analysis was performed in a continuous or categorical mode (Tables 4 and 5).
The head AIS presented a significant correlation with the expenses for ICU stay and total cost. In addition, it presented a significant negative relationship with expenditure for implants. The thorax AIS presented a strong correlation with the cost of ICU stay and with total cost (Tables 4 and 5).
The LL AIS was significantly correlated with the expense elements of anaesthesia, operating theatre, implants and as a whole the surgery element (Tables 4 and 5).
When we analysed the effect of mortality, we found that the deceased patients had a lower total expenditure, and lower admission expenses in both the ICU and the ward. These patients also presented significantly lower expenditures in staff and implants (Tables 4 and 5).
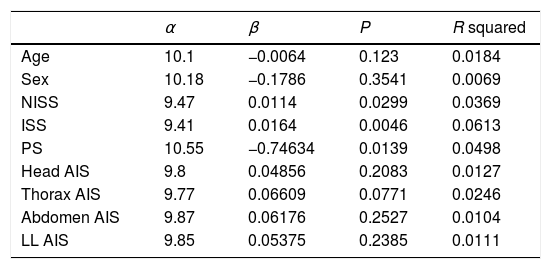
The univariate linear regression analysis showed that the NISS, ISS and SP injury scales were statistically significant, with P values of 0.0299, 0.0046 and 0.0139, respectively. When using the method of linear regression, “R squared” was calculated; this describes the percentage of variability that can predict the expenditure with each of the injury scales (Table 6).
β, α, R squared and the statistical significance of each variable.
| α | β | P | R squared | |
|---|---|---|---|---|
| Age | 10.1 | −0.0064 | 0.123 | 0.0184 |
| Sex | 10.18 | −0.1786 | 0.3541 | 0.0069 |
| NISS | 9.47 | 0.0114 | 0.0299 | 0.0369 |
| ISS | 9.41 | 0.0164 | 0.0046 | 0.0613 |
| PS | 10.55 | −0.74634 | 0.0139 | 0.0498 |
| Head AIS | 9.8 | 0.04856 | 0.2083 | 0.0127 |
| Thorax AIS | 9.77 | 0.06609 | 0.0771 | 0.0246 |
| Abdomen AIS | 9.87 | 0.06176 | 0.2527 | 0.0104 |
| LL AIS | 9.85 | 0.05375 | 0.2385 | 0.0111 |
AIS, Abbreviated Injury Scale; ISS, Injury Severity Score; LL, lower limb; NISS, New Injury Severity Score; PS, probability of survival; SD, standard deviation.
The proposed model has a general “R squared” of 0.084 (P=.138). It can be calculated as follows: cost Ln=9.74+([−0.004×age)+[0.00858 x ISS]+[0.0004×SP]+[0.041×head AIS]+[0.058×thorax AIS]). Individually, ISS and SP were the injury scales with the highest “R squared” values, 0.0613 and 0.0498, respectively.
DiscussionThe studies published about costs generated by trauma, both in specific groups and in large populations, indicate that severe trauma injuries represent a very important burden for society.1–3,7,8,15 In our centre, hospital treatment for just 131 traumatised patients with ISS >15 generated a total expenditure of €3,791,879.
There is a recent systematic review published of studies analysing the hospital cost of treating a traumatised patient.16 The authors analysed 27 studies and found a mean overall expenditure of US$29,886 for patients with ISS ≥ 15. In our study, the mean cost was €28,945. How similar these values are is noteworthy, in spite of the fact that the studies analysed in the systematic review were carried out in different countries and in different decades, with the consequent differences in the treatments performed.
The correlation between age and expenditure has been a matter of debate in the bibliography. There are several studies that have found a correlation between greater age and greater expense17–19; in contrast, other studies obtain (similar to what we have found) a lack of correlation between age and cost.20–22 In our study, greater age tends to present a lower expenditure for ICU stay and a greater expenditure in ward stay, and this finding has previously been identified.19,22 When we assess age and severity of injury, we find that the most severe elderly patients present early mortality with lower ICU and total expenditures, but that the elderly patients who survive require a longer ward stay. When age is considered in the multivariate analysis, we find that it does not correlate with total expenditure.
The injury scales ISS, NISS and PS, scales that measure the overall severity of the traumatism, associate an increase in cost; these results agree with the great majority of previous studies.23–26 In our study, we find that this increase in expenditure is explained stemming from several treatment components, the cost of ICU stay, operating theatre expenses and staff expenses. It is of interest that, as far as we know, the correlation between the PS scale and cost has not previously been published.
The analysis of specific AIS scales resulted in the identification of a significant correlation between thorax AIS and head AID, with the total cost due to the cost of ICU stay. These findings indicate how thoracic traumatism and traumatic brain injury (TBI) increase expenditure as their severity increases, specifically because their ICU stay becomes longer, without affecting other expense elements. In fact, it is noteworthy that the head AIS has a significant correlation with a lower expenditure in implants.
With respect to TBI, Davis et al.26 analysed a group of patients subdivided into 3 groups: TBI alone, multisystem trauma without TBI and multisystem trauma associated with TBI. The group of patients that had multisystem trauma with TBI presented longer hospital stays, greater need of ICU and greater hospital cost compared with the patients with the same ISS level with TBI alone or multisystem trauma without TBI. The mechanism through which this increase was produced was not identified. In contrast, in our study it was indeed clear that TBI increases the cost through ICU stay without increasing other cost elements.
The analysis of LL AIS reveals that increasing the severity of the orthopaedic injuries does not cause a longer stay in the ICU; it instead increases the expenditures with respect to the concomitant surgical activity. In the bibliography, others studies that evaluate the mechanism through which LL traumatism raises expenditure have not been identified.
The results of this study with respect to the influence of patient mortality on expenditure for hospital treatment coincide with others studies.17,18,24 The death of the patient during their stay is significantly associated with a lower total expenditure. Our study identifies how this decrease is produced by lower expenditures in ICU stay, ward stay, implants and staff. The analysis of previous studies reveals that, in less severe patients, the ones who die incur greater expenditure than the other patients, because the cases that evolve poorly are selected. In contrast, in the group of more severe patients, the ones that die end their treatments earlier and would imply a lower expenditure.20,21
We recognise the limitations that this study has. In the first place, in spite of the total expenditure identified in our study, this represents only a part of the economic impact generated by these patients. This is because this total includes only the hospital expenditure, and does not include later health care, direct non-healthcare expenses, or indirect expenses provoked by loss of productivity from disability or death.
It would be useful to know the magnitude of these costs compared to the direct hospital costs. Corso et al.27,28 have analysed the overall cost of traumatic injury several times and have repeatedly found that indirect costs are 4 times higher than direct costs. Similar results were identified by Lim et al.7 in South Korea. Conversely, in other studies the indirect expenses are up to 99 times higher than the direct expenses; these great differences depend on the method used in each study.29,30
Another limitation is that the data analysed are from 2008. The economic data studied as a cost analysis were previously published.31 However, given that the objective of our study is to analyse cost predictors and not the economic value of each facet of treatment, we believe that the fact that the monetary data are a bit out of date does not affect the validity of the relationships identified in this study.
Summing up, age or sex in and of themselves are not predictors of the cost of healthcare for the traumatised patient. In contrast, the scales of injury severity are good cost predictors, although each of them has its own character. The patients with severe trauma that affects various organs or systems will present a greater cost due to various components of treatment. The patients with TBI or thoracic traumatism will present a greater cost caused by their ICU stay. The patients with orthopaedic traumatism will present a greater cost associated with the increase in operating theatre and implant expenditures.
Level of evidenceLevel of evidence IV.
Conflict of interestsThe authors have no conflicts of interest to declare.
Please cite this article as: Auñón-Martín I, Caba-Doussoux P, Jiménez-Díaz V, del Oro-Hitar M, Lora-Pablos D, Cecilia-López D. Valoración de parámetros clínicos del paciente politraumatizado como predictores del gasto hospitalario y de su distribución. Rev Esp Cir Ortop Traumatol. 2018;62:408–414.
