


The present study aims to establish a clinical cut-off for the Grandiosity dimension, using item-level evaluation procedures.
MethodsParticipants were 5,387 adults, including outpatients diagnosed with narcissistic personality disorder (NPD), outpatients diagnosed with other personality disorders, and adults from the community. We administered the self-reported Grandiosity scale from the Dimensional Clinical Personality Inventory 2 (IDCP-2). The equating procedure was applied to generate theta scores for participants who did not answer all items.
ResultsThe Wright map revealed that outpatients scored high on the latent continuum of the Grandiosity scale. Group comparison showed large effect sizes for the mean difference between patients and non-patients. The ROC curve supports a cut off at a –0.45 score in theta standardisation, which yields a high sensitivity (91%) and moderate specificity (58%). Moreover, the PPP (71%) and NPP (79%) values suggest that the scale is able to identify NPD patients in 71% of cases, and people without NPD in 79% of cases.
ConclusionsThe findings suggest the IDCP-2 Grandiosity scale is useful as an NPD screening tool. Possible clinical applications for the scale are described and the limitations of the study are discussed.
El presente estudio tiene como objetivo establecer un corte clínico para la dimensión Grandiosidad, utilizando procedimientos de evaluación a nivel de ítem.
MétodosLos participantes fueron 5.387 adultos, entre pacientes ambulatorios diagnosticados con trastorno de personalidad narcisista (NPD), pacientes ambulatorios diagnosticados con otros trastornos de la personalidad, y adultos de la comunidad. Se administró la escala de Grandiosidad autoinformada del Inventario Dimensional Clínico de Personalidad 2 (IDCP-2). El procedimiento de ecualización se aplicó para generar puntuaciones theta para los participantes que no respondieron a todos los ítems.
ResultadosEl mapa de Wright reveló que los pacientes ambulatorios estaban ubicados en los niveles altos en el continuo latente de la escala de Grandiosidad. La comparación grupal mostró tamaños de efecto grandes para la diferencia de medias entre pacientes y no pacientes. La curva ROC confirma un corte en –.45 puntos en la estandarización theta que produce una alta sensibilidad (91%) y una especificidad moderada (58%). Además, los valores de PPP (71%) y NPP (79%) indican que la escala puede identificar a los pacientes con NPD en el 71% de los casos y las personas sin NPD en el 79% de los casos.
ConclusionesLos resultados indican que la escala de Grandiosidad del IDCP-2 es útil como instrumento de evaluación para NPD. Se describen posibles aplicaciones clínicas para la escala y se discuten las limitaciones del estudio.
The narcissistic personality disorder (NPD) is one of the less frequent PDs,1 presenting a mean prevalence of 0.5% according to 12 studies, which may vary up to 6.2%, men being more frequent.2 This is one of the PD more studied.3 However, the task force of the Alternative Model for Personality Disorders (AMPD) has initially proposed its exclusion (but NPD was sustained in the final proposition).2
Section II of DSM-5 defines the NPD as a pervasive pattern of grandiosity, need for admiration, and lack of empathy. Five of nine criteria must be reached to the NPD diagnosis: grandiose sense of (1) fantasies of unlimited success, power and ideal love (2), belief that he/she is special and only special people as he/she would be able to understand it (3), requiring excessive admiration from of others (4), belief in deserving privileges and special treatment (5), manipulation of others for self-gain (6), lack of empathy (7), demonstrates envy of others or believes others envy he/she (8), and is arrogant and behaves as if he/she were superior (9). Previous findings suggest that all NPD criteria have high discrimination, but the ninth.4
Although relevant, the diagnostic criteria of the NPD (2) do not include some core psychological symptoms as vulnerable self-esteem, feelings of emptiness, distress, and boredom.5 Evidence suggests that there are subgroups of people with NPD, mainly, one group focused on the grandiosity and other group focused on vulnerability.6–10 Moreover, high levels of comorbidity with other PDs and other mental disorders were observed.11
The NPD traits are typically measured by assessment tools as the Narcissistic Personality Inventory (NPI),12 although this inventory has received critics as assessing healthy traits more than pathological traits.13,14 Other measures, focusing on the pathological aspects are available, as the Five-Factor Narcissism Inventory (FFNI),15 the Pathological Narcissism Inventory (PNI),16 specifics facets of the Personality Inventory for DSM-5 (PID-5),17 and specifics dimensions, and respective factors, of the Dimensional Clinical Personality Inventory 2 (IDCP-2).18 Our focus is on the dimensions and factors of the IDCP-2.
The IDCP-218 is the revised version of its previous version, IDCP. The IDCP-2 first version is based on Millon's Theory19 and in the diagnostic criteria of the Diagnostic and Statistical Manual of Mental Disorders - 4th Edition (DSM-IV-TR).20 To the revised version of IDCP, the IDCP-2, the theoretical scope and traits coverage were improved by other sources: session III of the DSM-5,2 facets of the Personality Inventory for DSM-5 (PID-5),17 factors of the Schedule for Nonadaptive Personality (SNAP),21 and the dimensions assessed by the Shedler-Westen Assessment Procedure (SWAP).22 The IDCP-2 is composed of 12 dimensions divided into a set of 47 facets. Dimensions are Dependency, Aggressiveness, Mood Instability, Eccentricity, Attention Seeking, Distrust, Grandiosity, Isolation, Avoidance of Criticism, Self-sacrifice, Conscientiousness, and Inconsequence. A number of studies verifying the psychometric properties of the instrument were published,23–26 and new efforts have been undertaken to find clinical cut-off for each revised dimension.27–29 Although the dimensional perspective avoids restricting diagnosis and classification with arbitrary boundaries, cut-offs are necessary to assist clinicians in decision-making.
Grandiosity is the IDCP-2 dimension more related to the NPD traits, as observed in previous studies.30,31 This dimension measures traits as recognition and attention need, envy of and from others, disinterest in others’ problems, and superiority feelings. Although previous evidence suggests the psychometric adequacy of the grandiosity dimension, we could not find studies proposing cut-off for practical use of this dimension. The present study aims to establish a clinical cut-off for the grandiosity dimension, using item-level evaluation procedures, and hence, more evidence of the psychometric properties of the instrument. The formulated hypotheses are:
- •
(h1) Items set should be more reliable in the pathological level of the trait (i.e., extreme of the latent trait) than in medium or low grandiosity range.
- •
(h2) People should be located in higher levels of the construct as they present more pathological traits related to NPD.
- •
(h3) Grandiosity dimension should be able to discriminate between people with high levels of NPD from people with low levels.
This study consisted of 5387 Brazilian adults, aged from 18 to 90 years (mean, 25.92±9.02 years; 57% female), most college students (45.6%), accessed by convenience. The sample was divided, a posteriori, into 4 groups according to external criteria: subjects without a known psychiatric diagnosis and that reported never had being under psychological and/or psychiatry treatment (non-patient; n=3963), subjects without a known psychiatric diagnosis, but that reported doing psychological and/or psychiatry treatment (mental health patients, n=1319), patients diagnosed with other PDs (non-NPD patients; n=94), and patients diagnosed with NPD (NPD patients; n=11). The non-NPD patients and NPD patients were psychiatric outpatients showing a positive diagnosis of PD, established by experienced psychiatrists (more than 10 years of clinical experience) using the Structured Clinical Interview for DSM Axis II (SCID-II).
InstrumentsThe IDCP-2 is an IDCP's reviewed version,18 developed according to pathological traits reported in the theoretical proposal of Theodore Millon,19 the diagnostic criteria of DSM-IV- TR Axis II,20 and section 2 of the DSM-5,2 as well as the traits reported in section 3 of the DSM-5 and Personality Inventory for DSM 5 (PID-5),17 the dimensions assessed by Shedler-Westen Assessment Procedure (SWAP),22 and the dimensions listed by Anna Clark,21 which provide the basis for Schedule for Nonadaptive Personality (SNAP). The IDCP-2 is a self-report instrument for assessing pathological personality traits, composed of 206 items distributed in 12 dimensions (Dependency, Aggressiveness, Mood Instability, Eccentricity, Attention Seeking, Distrust, Grandiosity, Isolation, Criticism Avoidance, Self-Sacrifice, Conscientiousness, and Inconsequence). Items must be answered from a Likert scale of four points, ranging from “it has nothing to do with me”1 and “it has a lot to do with me”.4 Psychometric properties of dimensions, validity evidence (based on the internal structure and external variables), and reliability indices (for internal consistency) have shown to be appropriate in studies that provide a basis for the IDCP-2 for each dimension.23,24,32,33
For the present study, we used the revised version of the Grandiosity30 that contains 18 items divided into four factors and a total score. Factors are Need for recognition (4 items), Superiority (5 items), Dominance (5 items), and Indifference (4 items). The sum of the factors composes the Grandiosity total score. We also administered the original dimension,34 consisting of twelve items, as a means to perform the equating procedure, as reported in the next topic.
Procedures and data analysisAfter being submitted to and approved by the Institutional Ethics Board Review (CAAE 21992113.1.0000.5514), data collection started. Data collection was from 2011 to 2017. The administrations were made at a private university and in a public psychiatric hospital in the state of São Paulo. At the university, the administration was conducted collectively, lasting about 30minutes in one session per class, in the classrooms. At the psychiatric hospital, the administrations were individual, in a separate room, lasting about 50minutes. After explaining the research goals, the participants signed the Informed Consent and then responded to the research instrument.
Not all participants responded the Grandiosity dimension of IDCP-2; some of them answered the previous version.34 To generate scores for all participants, we applied the equating procedure35 to a dataset with 3997 community participants used as anchors (from a total of 5387). Two items are shared among the 2 versions of the Grandiosity dimension, also used as anchors for generating scores (i.e., theta).
Data were analyzed using the rating scale model,36 a variant of the Rasch model for multiple-choice items. The distinctive feature of this model is that the scalar intervals between points are deemed relatively similar for all items. The difficulty parameter bi represents the location of item i, or the average intensity of the thresholds of an item. Items representing extremes in the latent dimension have high average thresholds because they are localized on the most intense trait level. Item and subject model parameters were calibrated by the Joint Maximum Likelihood Estimation method, implemented in the Winsteps software.37 This calibration performed considered original and revised items, so the parameters were estimated by all the participants, which is the purpose of the equating procedure.
The adequacy of the calibration was evaluated by the indexes fit, infit, and outfit, calculated for all items and participants. These values are directly proportional to the residuals that reflect differences between the observed and expected responses from the hypothesized knowledge of the model parameters, thus providing evidence of how well the model fits the data. Values greater than 1.3 indicate misfit.38 Complementarily, we verified test unidimensionality, responses categories adequacy, item-theta correlation, general reliability (α and Rasch), and test curve information. We tested the unidimensionality of the scale through the Rasch-residual-based Principal Components Analysis (PCAR). In PCAR, unidimensionality is reached when the variance not explained by items is eigenvalue ≤2.0. When eigenvalue is greater than 2.0, Linacre37 indicates that simulated data were generate based on real data values (i.e., the dataset). Unidimesionality is reached eigenvalue ≤2.0.
We proceeded to Wright map, group comparisons through ANOVA, and ROC curve, aiming better understanding of latent construct and establishing the dimension's cut-off. The cut-off was determined for the dimension's total score. ANOVA and ROC curve were proceeded through SPSS version 21. Regarding the ROC curve, the psychiatric sample accounted for approximately 2% of the total sample, which is in line with the range of prevalence of PDs in the general population. Also, the sample of patients with avoidant personality disorder represents 1.84% of the total sample, close of DSM-52 report, especially the subsample from Part II of the National Comorbidity Survey Replication. Qualitative item map analyses were based on Elliot et al. recommendations.39 ANOVA's effect size was calculated using Cohen's d for peer-to-peer comparisons.40 Moreover, the Tukey's HSD post-hoc was calculated as a deepening in the results from ANOVA.
ResultsWe first investigated psychometric assumptions of the Grandiosity dimension. Data were analyzed mainly at the item level, but we also considered the total score and the 4 factors previously found in the revised version of this dimension.30 We tested the unidimensionality to verify if the items referred to the same construct, and results indicated that the items explain 11.3% of the people's variance. Only 9.3% of the variance was not explained by the items, equivalent to 2.8 eigenvalues. This value is probably due to the dimension that allows assessing four subfactors, Need for Recognition, Superiority, Dominance, and Indifference. Based on Linacre,37 we generated 5 simulated data using real data values that presented variance not explained by items ranging from 1.1 to 1.5, suggesting that the amount of 2.8 eigenvalues was random.
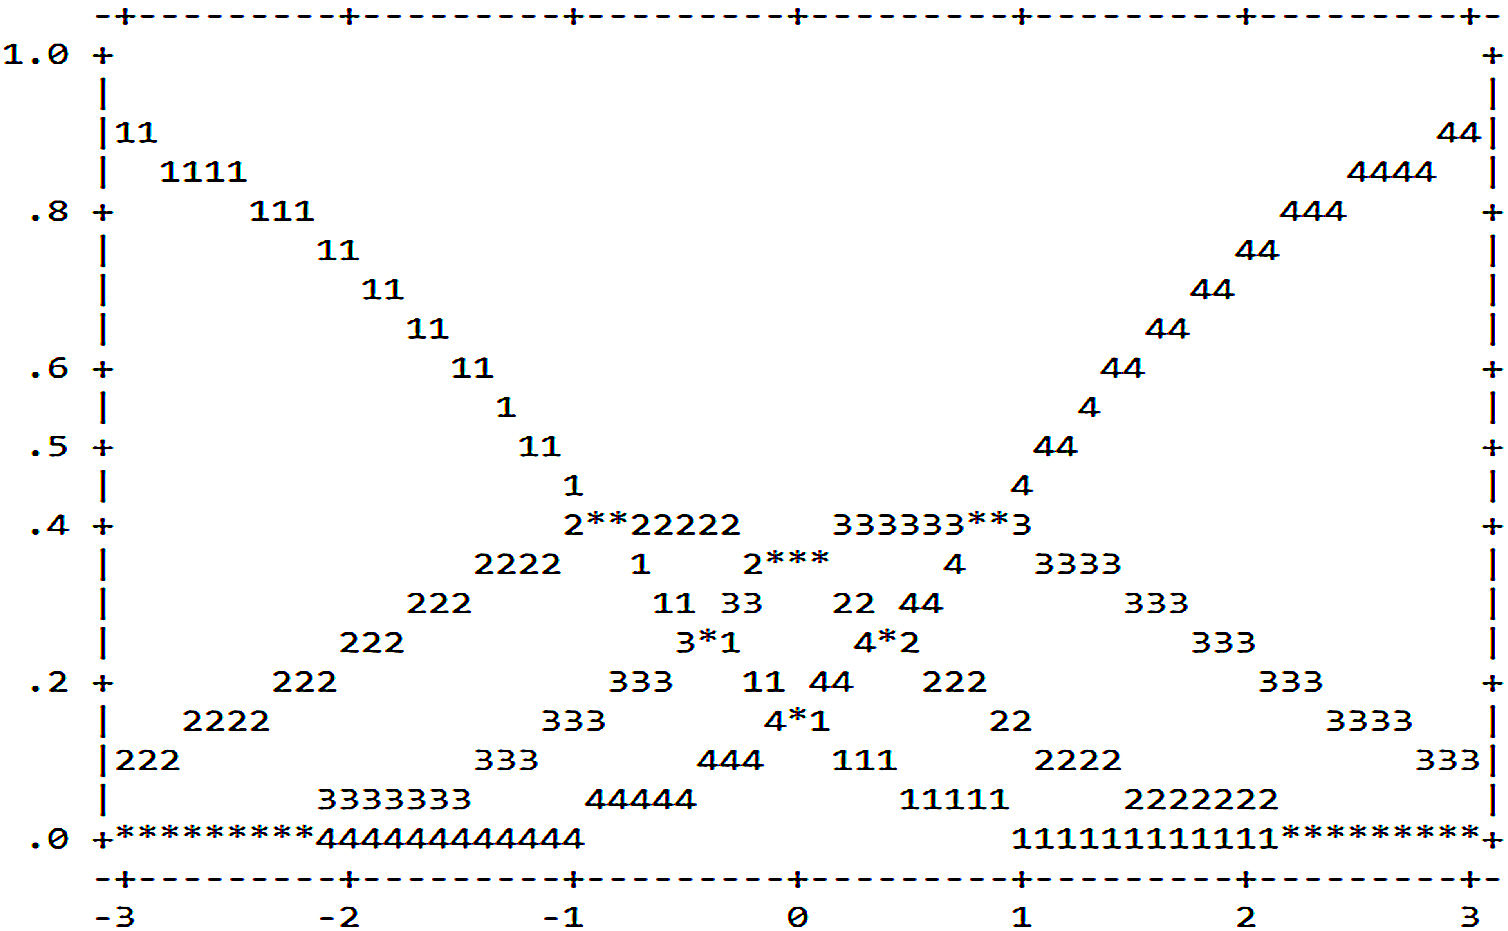
We also investigated the consistency of the responses provided by the subjects based on the Rating Scale Model, i.e., the suitability of the response categories to discriminate trait levels. Figure 1 presents the probability of each category (curves 1, 2, 3, and 4) be selected (axis Y) considering the person's latent trait (axis X).

Based on Figure 1, we verified that the threshold values required to change the probability of response in each category (represented by * in the figure) were−.82 (category 1 to 2),−.02 (category 2 to 3) and .84 (category 3 to 4). This demonstrates the adequacy of categories, and the gradual increase suggests the ability of subjects to discriminate categories meanings, consequently, favor the discrimination between people with and without PD. Table 1 presents the difficulty level for endorsement to items (δ), standard error, adjustment indices (infit and outfit), correlation theta-item, and internal consistency reliability indices (based on the Rasch model and Cronbach's alpha).
Rating scale analysis of the IDCP-2 grandiosity dimension.
| Items | Measure (δ) | S.E. | Infit | Outfit | ritem-theta |
|---|---|---|---|---|---|
| (F4) I610 callousness | 0.72 | 0.02 | 1.15 | 1.09 | 0.51 |
| (F4) I607 callousness | 0.57 | 0.02 | 1.47 | 1.48 | 0.44 |
| (F4) I606 callousness | 0.56 | 0.02 | 1.30 | 1.29 | 0.46 |
| (F2) I596 superiority | 0.32 | 0.02 | 0.86 | 0.79 | 0.65 |
| (F1) I594 superiority | 0.30 | 0.02 | 0.81 | 0.75 | 0.65 |
| (F2) I597 superiority | 0.28 | 0.02 | 0.92 | 0.84 | 0.66 |
| (F3) I612 manipulation | 0.16 | 0.02 | 0.77 | 0.76 | 0.61 |
| (F1) B115 superiority | 0.14 | 0.02 | 0.90 | 0.88 | 0.63 |
| (F4) I605 callousness | 0.14 | 0.02 | 1.22 | 1.22 | 0.50 |
| (F2) I598 superiority | 0.11 | 0.02 | 1.20 | 1.16 | 0.56 |
| (F2) I592 superiority | 0.10 | 0.02 | 0.94 | 0.93 | 0.60 |
| (F3) I616 manipulation | −0.08 | 0.02 | 0.88 | 0.92 | 0.55 |
| (F2) A059 superiority | −0.10 | 0.02 | 0.91 | 0.92 | 0.63 |
| (F1) A096 superiority | −0.25 | 0.02 | 1.11 | 1.18 | 0.57 |
| (F3) I341 manipulation | −0.56 | 0.02 | 1.04 | 1.10 | 0.54 |
| (F3) I587 manipulation | −0.66 | 0.02 | 0.90 | 0.97 | 0.56 |
| (F1) A062 superiority | −0.70 | 0.01 | 0.97 | 0.97 | 0.64 |
| (F3) I611 manipulation | −1.06 | 0.02 | 1.07 | 1.11 | 0.51 |
| M(SD) | 0.00 (0.43) | 0.47 | 1.02(0.18) | 1.02(0.19) | .57 (0.07) |
| Sample | –0.85 (1.18) | ||||
| Person/Item reliability (α) | 0.68/1.00 (0.89) |
F1: need for recognition; F2: superiority; F3: dominance; F4: indifference.
We omitted items content because of copyright issues, but the core meaning is presented.
According to Table 1, the difficulty (δ) of each item is in ascending order, wherein items with greater difficulty indicate a lower likelihood of endorsement, once they require higher levels in the latent trait. These items assess pathological traits, representing severe characteristics of Grandiosity dimension. The most extreme item in the latent construct (i.e., less endorsed) was I610, which assess lack of empathy, and the most endorsed (i.e., less pathological) was item I616 that includes characteristic of dominance. All items presented a good fit for the model, with infit and outfit within the range of 0.5 to 1.5 considered appropriate accord.37 Moreover, the items showed a moderate to high correlation with the total score, and the alfa coefficient was high.
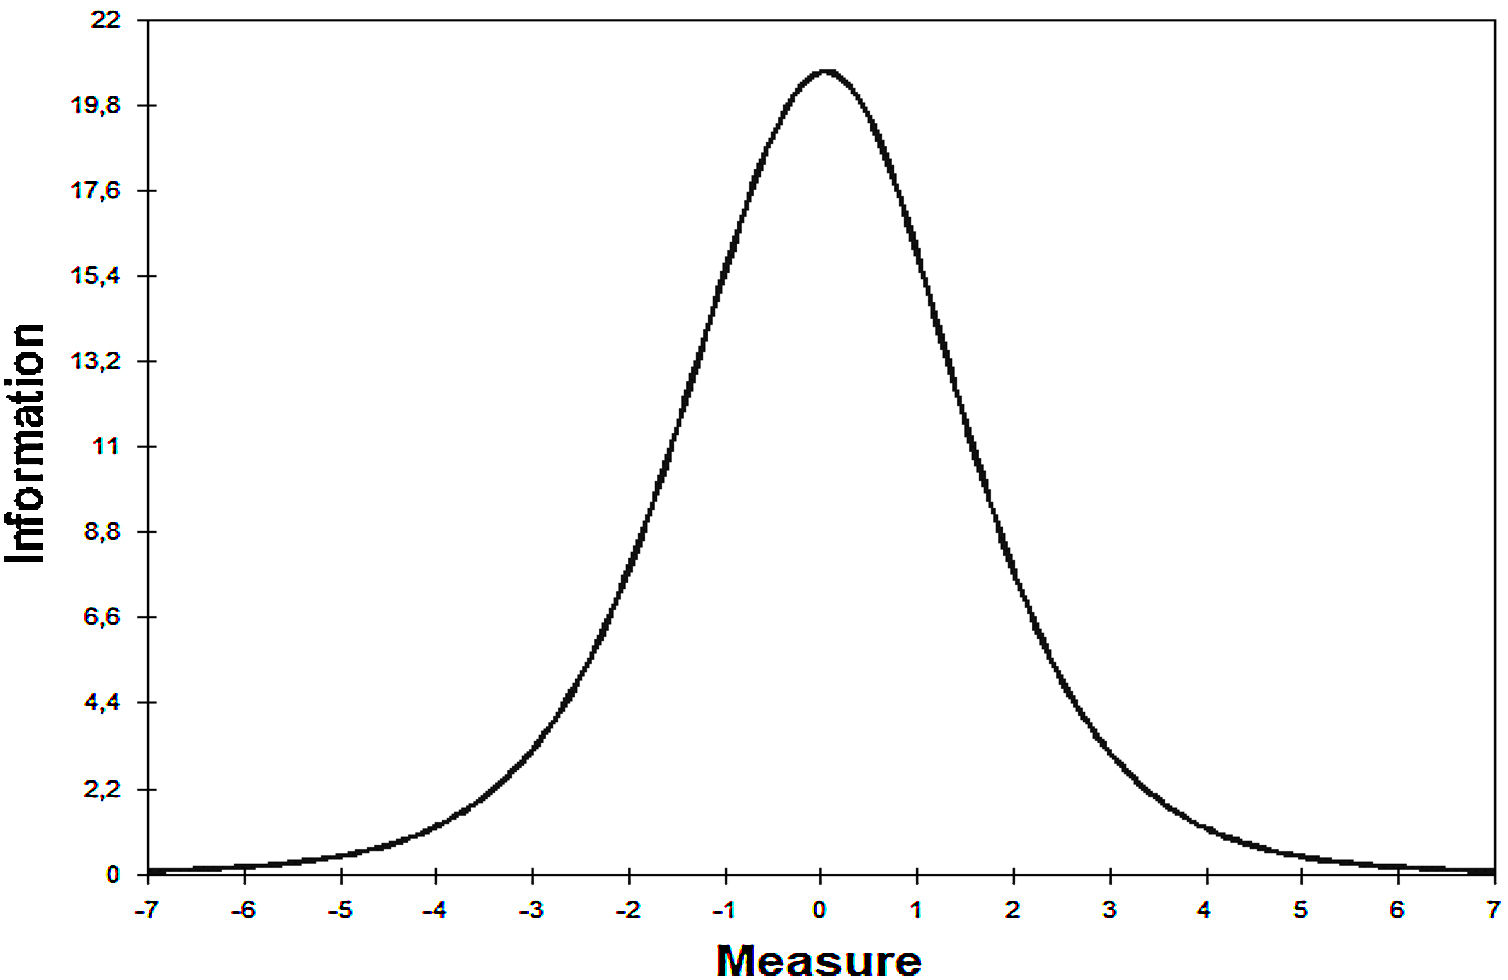
The relationship between people and items distributions were investigated using the mean location of item and people on test information curve (see Figure 2). The test information curve identifies reliability indexes according to metrics of the latent construct, based on the average of items and people.

The test information curve demonstrated that the Grandiosity dimension better assess people with theta between−1 e 1. This range includes the people's mean (−.77), 90.90% of group 4 (NPD patients), and 54.26% of group 3 (non-NPD patients).
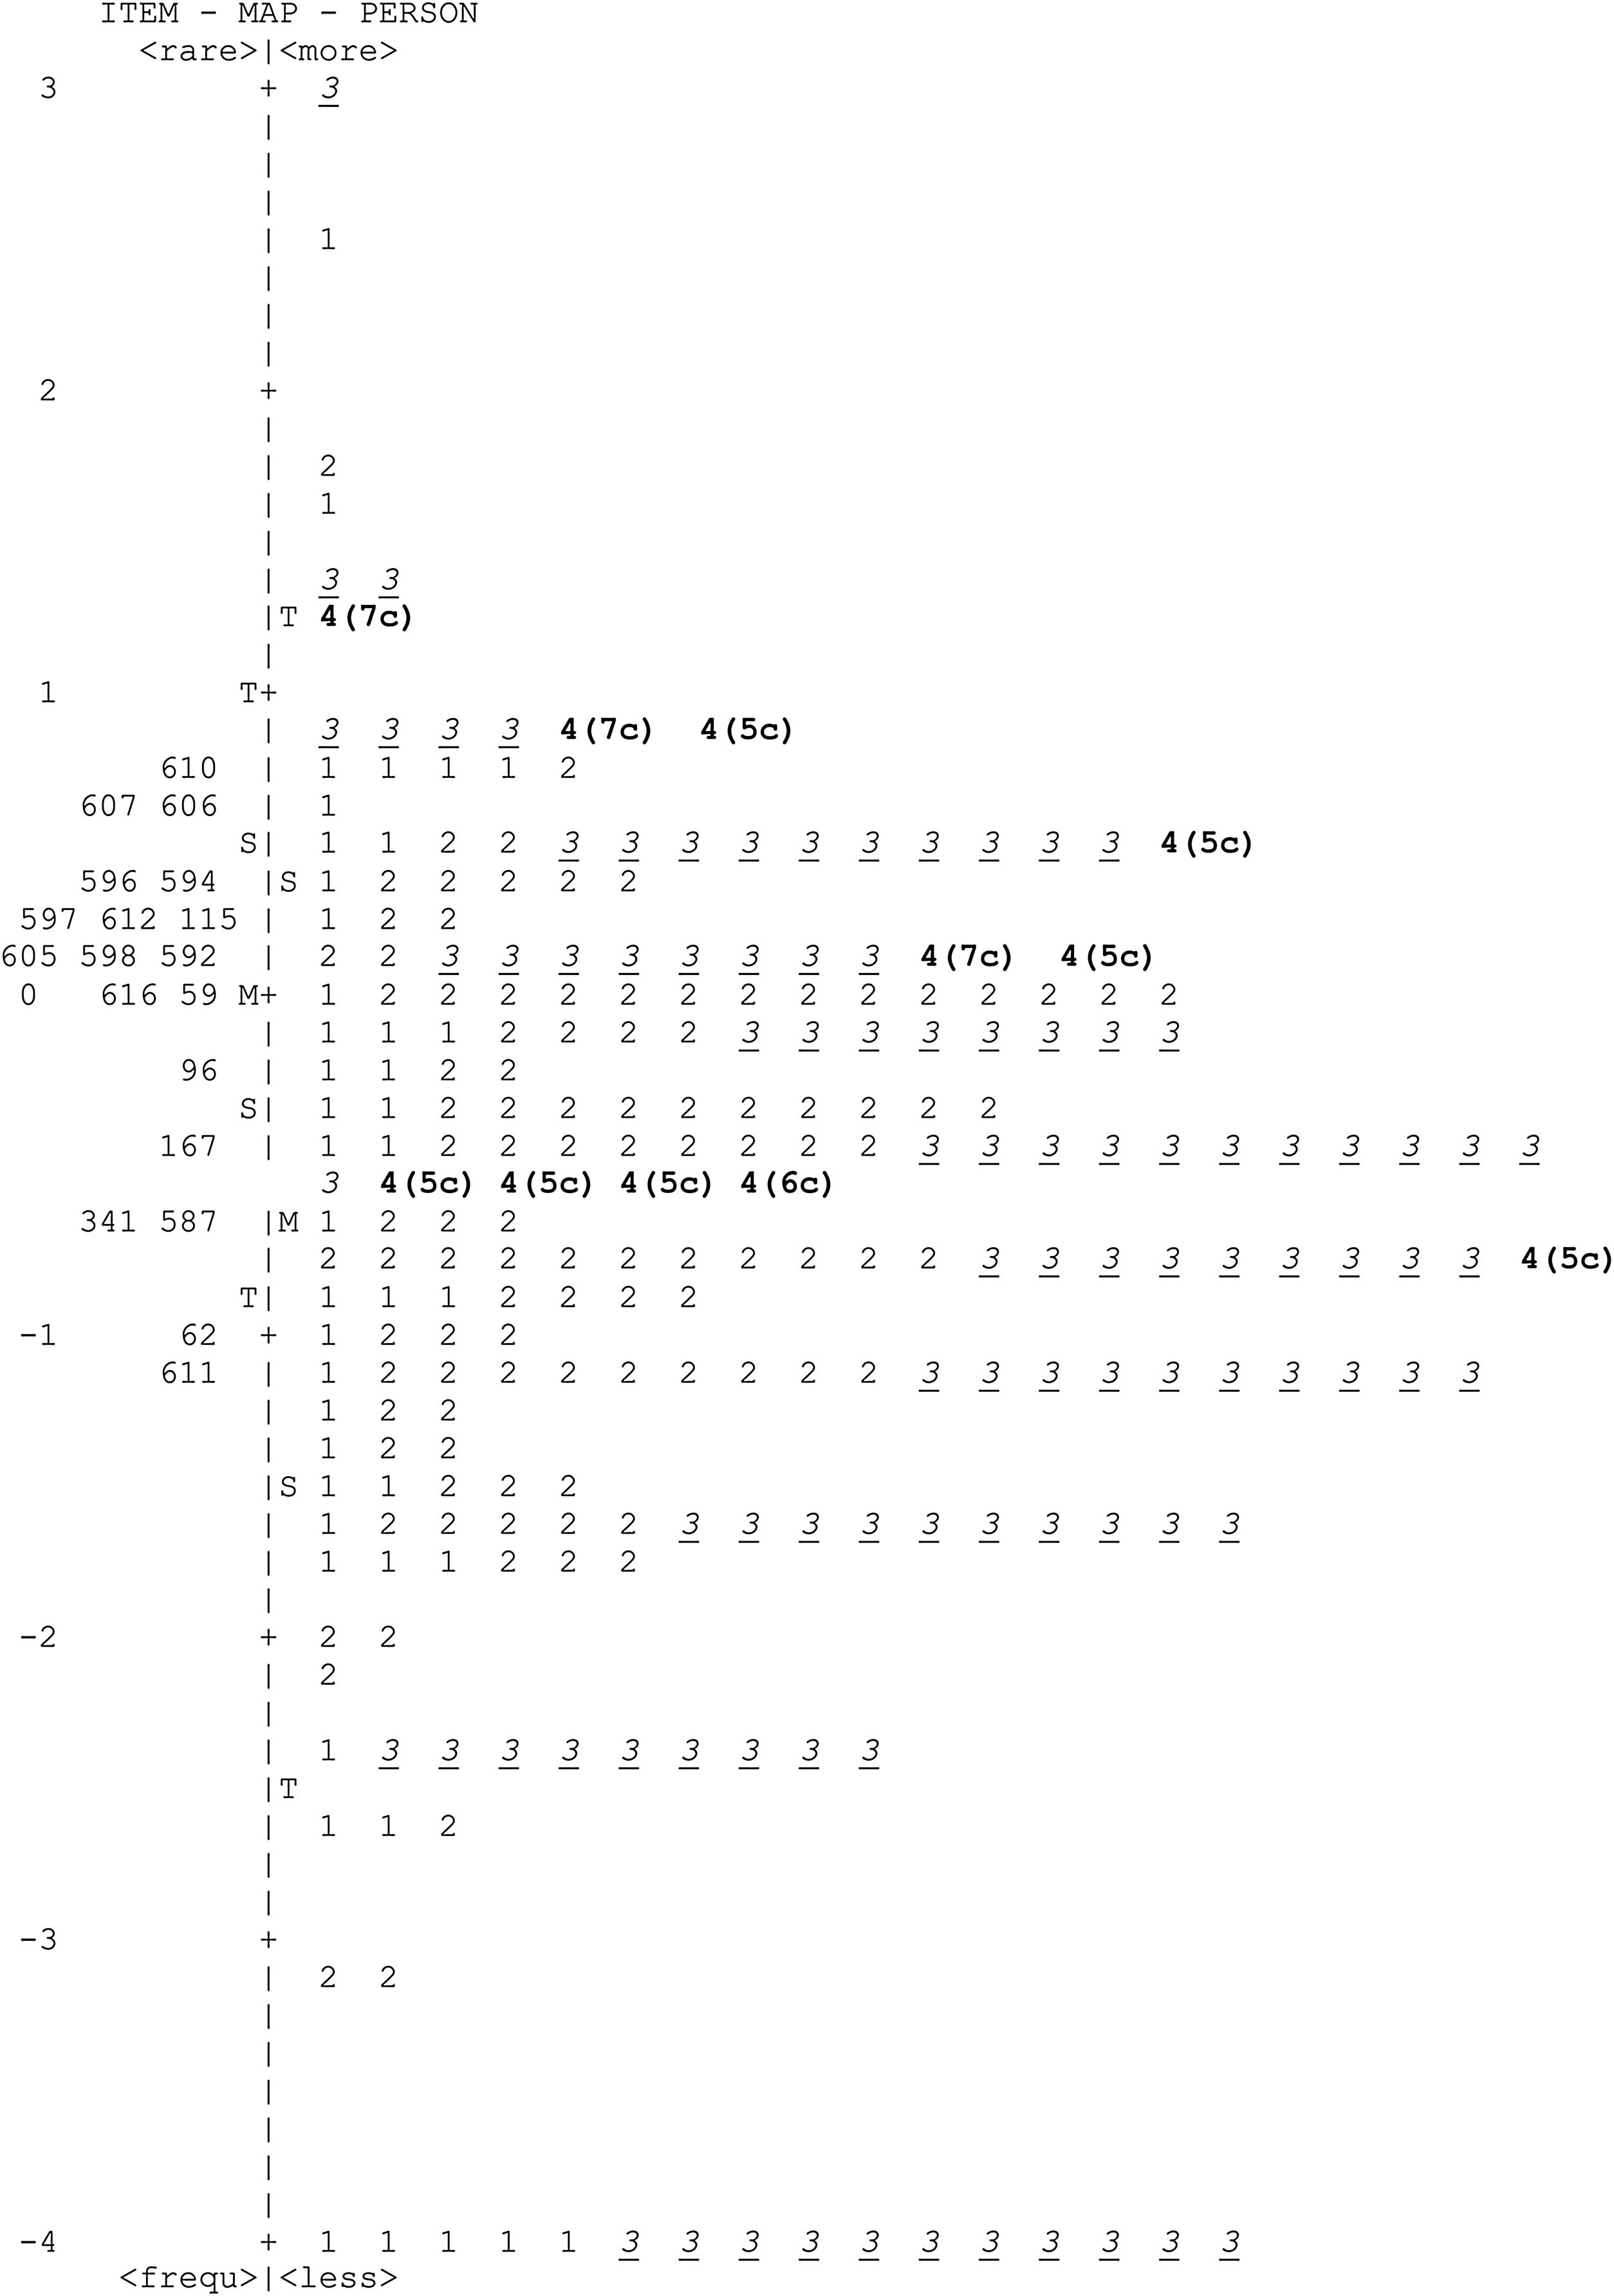
Given the adequacy of psychometric properties (unidimensionality, response categories, and reliability indices), and the estimation of the items and people's parameters, the focus analyses of the study are now presented. Figure 3 shows the Wright map, which allows observing the relationship between items and participants in a common metric scale representing the latent construct (i.e., grandiosity functioning). The difficulty of items was calculated using the total sample, but for illustrative purpose, the map presents the distribution of 230 people, in which 1=non-patients (n=43), 2=mental health patients (n=102), 3=non-NPD patients (n=94), and 4=NPD patients (n=11).
 and people (right) of the IDCP Grandiosity Dimension. In bold are the 11 NPD patients; in italic+underlined are the non-NPD patients; inside the brackets are the number of criteria reached by each patient with NPD.")
Items located on top of Figure 3 are the least likely to be endorsed by healthy individuals (groups 1 and 2) and higher by people with pathological traits (groups 3 and 4), the inverse is right for the items located on the bottom of the continuum. We observed mean item was higher than the mean of people, and 72.22% of the items are above mean items and 88.89% above the mean of people. Concerning people's position, 45.45% of group 5 (patients with NPD) is located above mean items and 90.90% above the mean of people. Group 3 (patients with other PDs) 26.60% were above mean items and 47.87% above the mean of people.
Complementary, we performed an analysis of variance between groups (ANOVA) and ROC curve analysis, using the total sample to verify more evidence of the discriminative capacity of the dimension. ANOVA demonstrated difference between groups (F(3.5383)=3.75; P<.01). Table 2 presents the group comparison through ANOVA.
ANOVA and post hoc according to groups.
| Groups | n | Mean (theta estimate) | SD | d |
|---|---|---|---|---|
| Non-patient | 3963 | −0.78a | 1.04 | dnon-patient*MHP=0.06dnon-patient*nonNPD=0.13dnon-patient*NPD=0.64dMHP*nonNPD=0.20dMHP*NPD=0.63dnonNPD*NPD=0.70 |
| Mental health patient | 1319 | −0.72a | 0.97 | |
| Non-NPD patients | 94 | −0.92a | 1.21 | |
| NPD patients | 11 | 0.11b | 0.59 |
MHP: mental health patient; NonNPD: non-NPD patients; NPD: NPD patients.
The effects from the comparisons between groups, including NPD patients, were expressive, indicating the dimension's capacity to discriminate NPD patients from the 3 other groups. An exploratory assessment, Tukey's HSD post-hoc indicated the division of participants into two groups, the first with all non-patients and the second with all patients (P<.05). The ROC curve comprised an area below the curve of .75 (95%IC, 0.64-0.86; P<.01), with high sensitivity (91%) and medium specificity (58%), considering as a cut-off δ=−.45.
We analyzed the positive (PPP) band negative (NPP) predictive power for a better comprehension of scale functioning. To calculate these indexes, we used equations 15 and 17 of Streiner,41 with a cut-off equal to−.45, an NPD prevalence of 6.2% established by the National Epidemiologic Survey on Alcohol and Related Conditions.2 PPP value was 71%, and NPP was 79%, suggesting that the dimension was able to identify NPD patients in 71% of cases, and people without NPD in 79% of cases. The incremental diagnostic was calculated using equations 25 and 26 of Streiner,41 showing that the dimension increases 24% in the identification of people with NPD (increase on PPP), and 66% in the identification of people without NPD (increase on NPP). The efficiency test was 58.3% representing the number the test was right compared to assessed people.42
DiscussionNPD is one of the less frequent1 and one of the more studied PDs.3 There is no clear accordance with NPD prevalence, with studies finding a mean of 0.5%,1 while the prevalence can reach up to 6.2%.2 Despite being suggested to the exclusion by the task force of the AMPD, the NPD remained after several criticisms of its elimination. The traits composing this PD are related to interpersonal impairment as manipulation, lack of empathy, envy, and arrogance. In this study, we seek to improve the Grandiosity dimension from the IDCP-2,30 establishing a cut-off to discriminate between people with and without NPD diagnosis. As assumption for reach this aim, we first investigate the psychometric properties of the Grandiosity dimension and observed general suitability of the items to the statistical principles (i.e., unidimensionality, response categories, parameter estimation, and reliability). Moreover, we are proposing a screening cut-off for clinical use of the dimension, allowing the mapping of the NPD relevant traits, as well as providing an empirically established indicator of the presence (or absence) of NPD.
Our first hypothesis states that items should be more reliable in pathological levels of the construct in comparison to less pathological levels, which was empirically corroborated by the findings, agreeing with the previous evidence.18,30 A gradual and unidirectional increase in the latent trait was observed. Each response category presented its information pinnacle in several continuum spots of the latent trait, distributed in a crescent order (1<2<3<4), in which the categories with the higher values (i.e., 3 and 4) presented less probability of being chosen by people lower in the latent construct, following the dimensional perspective for pathological personality traits assessment.17,43–46
Considering the item's location regarding the people's position in the latent construct (see Figure 3), we observed that most of the NPD patients are located at the top of the continuum, expressing a clear tendency to endorse items. These results confirm our second hypothesis, i.e., people higher in the latent construct should have a greater probability to choose response categories of higher values (i.e., 3 and 4), showing higher scores in the pathological traits, as previously observed for several pathological traits, including NPD traits.4
Our third hypothesis, i.e., the dimension total score should be able to discriminate groups according to the severity of the NPD continuum, which was corroborated. The ANOVA's post hoc test showed discrepancies between NPD patients and all other groups, wherein the higher differences were observed for NPD patients with non-NPD patients. These findings indicate that the trait being evaluated by the items is closely related to NPD symptoms, as expected,30,31,47 and can be used as a screening measure in clinical settings. In contrast, higher means were observed for non-patient and mental health patient groups, which were not expected, as non-NPD patients should present more impairments. However, as an alternative hypothesis, non-NPD patients showed only poor (or none) NPD symptoms, while we do not have this information for the other groups (i.e., non-patient and mental health patient). Futures studies should try to replicate these findings, but controlling for possible PD diagnoses of the non-patient groups.
The clinically relevant cut-off for the measure was established through the ROC curve, as well as calculating positive and negative predictive power and efficiency test values. Results indicated an ideal cut-off of –.45 in theta metrics, showing suitable sensibility and specificity levels for screening purposes.48,49 In the items map (Figure 3), most of NPD patients are located above this cut-off, corroborating our expectations.
Overall, our findings suggest the use of the Grandiosity dimension for clinical practice as a screening for NPD traits. However, this tool should not be used for diagnostic purposes, cases in which the professional should resort to diagnostic assessment tests (e.g., SCID). Limitations of this study must be considered: the small cases of NPD patients; the absence of knowledge on the potential diagnoses of the people in non-patient and mental health patient groups, and the equating procedure, that can aggregate statistical bias to the scores; the use of SCID-II as the gold standard, although a true gold standard is difficult to establish in the PDs field. Future studies should investigate the suitableness of the cut-off determined in this study, considering NPD and other clinical groups.
Conflict of interestThe authors have no conflicts of interest to declare.
