

Evidence from previous studies has consistently revealed that patients develop target organ damage even with seemingly normal blood pressure thus informing the development of a new treatment guideline in 2017. The prevalence of hypertension in Nigeria ranges from 8-45%, however this is expected to change due to the new guideline. Thus, this study sought to estimate the prevalence of hypertension based on 2017 ACC/AHA clinical guidelines, and determine its associated factors.
MethodsIn this cross-sectional study a total of 296 participants were recruited with a simple random technique using a table of random numbers. Blood pressure, weight and height were measured and data was analysed with SPSS version 22. The primary outcome measures included proportion of respondents with hypertension based on AHA guideline and JNC 7 classifications, as well as the association between hypertension and BMI, age, sex and marital status.
ResultsThe mean age of study participants was 38.71years, and male to female ratio was 2:3. Overall prevalence of hypertension was 63.5% and 22.6% based on the new guideline and JNC 7 classification respectively; higher risk of hypertension was significantly associated with the AHA guideline (p<0.001). Association between body mass index, marital status (currently married/not married), sex, age group (≥40 vs. <40years) and systolic as well as diastolic hypertension was significant (p<0.001). Females were more than twice as likely to be hypertensive as males [OR: 2.51 (1.54 - 4.10)]. Age and weight were the only significant predictors of abnormal blood pressure, diastolic and systolic hypertension.
ConclusionPrevalence of hypertension based on the new guideline is staggeringly high and portends a huge public health problem. This conundrum requires immediate intervention in order to forestall the damaging effects of hypertension on vital body organs and for participants to lead a healthy life.
La evidencia de los estudios previos ha revelado, consistentemente, que los pacientes desarrollan daños en los órganos diana aun cuando su presión arterial es aparentemente normal, lo cual ha impulsado el desarrollo de una nueva guía de tratamiento en 2017. La prevalencia de la hipertensión en Nigeria oscila del 8 al 45%, aunque está previsto que cambie, debido a esta nueva guía. En nuestro estudio calculamos la prevalencia de la hipertensión, basada en la guía clínica de ACC/AHA de 2017, y determinamos sus factores asociados.
MétodosEn este estudio transversal reunimos a un total de 296 participantes mediante una técnica aleatoria simple, utilizando una tabla de números aleatorios. Medimos la presión arterial, el peso y la altura, y analizamos los datos con SPSS versión 22. Las medidas del resultado primario incluyeron la proporción de respondedores hipertensos, basándonos en la guía AHA y en la clasificación JNC 7, así como en la asociación entre hipertensión e IMC, edad, sexo y estado civil.
ResultadosLa edad media de los participantes del estudio fue de 38,71 años, siendo el ratio varón:mujer de 2:3. La prevalencia global de la hipertensión fue del 63,5% y del 22,6%, sobre la base de la nueva guía y la clasificación JNC 7, respectivamente. El mayor riesgo de hipertensión se asoció significativamente a la guía AHA (p<0,001). La asociación entre índice de masa corporal, estado civil (actualmente casados/solteros), sexo, grupo de edad (≥40 vs. <40 años), e hipertensión sistólica y diastólica fue significativa (p<0,001). Las mujeres superaron en más del doble a los varones, en cuanto a la probabilidad de padecer hipertensión [OR: 2,51 (1,54 - 4,1)]. La edad y el peso constituyeron los únicos factores predictivos significativos de presión arterial anormal e hipertensión diastólica y sistólica.
ConclusiónLa prevalencia de la hipertensión basada en una nueva guía es asombrosamente elevada, presagiando un gran problema de salud pública. Este interrogante requiere una intervención inmediata, a fin de prevenir los efectos dañinos de la hipertensión en los órganos vitales, y animar a los participantes a llevar una vida sana.
High blood pressure has been shown by several landmark studies to contribute negatively to the global burden of cardiovascular diseases independent of other cardiovascular risk factors1,2. Nonetheless, several debates as to what set of numbers truly defines the hypertensive state has trailed the development of treatment and screening guidelines for hypertension globally3,4. Evidence from previous studies has consistently revealed that patients develop target organ damage even with apparently normal blood pressure5–7, thus, impugning the initial concept of just having a target blood pressure while aiming to lower cardiovascular risk as well as the emergence of target organ damage.
While the earliest studies on hypertension conducted in Nigeria determined prevalence of hypertension based on a cut-off of 160/95mm Hg, more recent studies used 140/90mm Hg as the threshold8. Even until now, the cut-off value for the diagnosis of hypertension in Nigeria has remained unchanged. The Joint National Committee (JNC) on Prevention, Detection, Evaluation and Treatment of High Blood Pressure in its recent 8th report (JNC 8)published a new guideline which was received with a lot of denigrations, although it appears to define new targets for blood pressure control using various races and associated co-morbidities like Type 2 diabetes9. Yet another guideline, published in 2017 by a team of researchers from the American Cardiology College (ACC)/American Heart Association (AHA), has stimulated a lot of outburst amongst academic and non-academic communities as to its applicability in clinical and non-clinical settings10. This new guideline reduced the lower limit for hypertension to a blood pressure of 130/80mm Hg. Accordingly, local as well as international prevalence is expected to change significantly following this new guideline11.
The prevalence of hypertension in Nigeria from systematic reviews ranges from 8-45%12–14, however, this is bound to change if the new AHA guideline is adopted in Nigeria.
Most guidelines4,9,10,15 were published in developed countries and, this limits their appropriateness amongst Black Africans. Blacks are known to have higher blood pressure than Caucasians and also, there is a trend that portends worse cardiovascular outcomes amongst people of black ancestry as documented in epidemiological as well as genetic studies16–18.
It, therefore, became expedient to research common cardiovascular risk factors, especially hypertension among Africans in order to estimate its prevalence in the light of modern day clinical practice. It is expected that the result of this study would provide a basis for further discussion on the usefulness or applicability of the 2017 ACC/AHA hypertension clinical guidelines in our locale while stimulating a drive for the development of health policies towards prevention of hypertension.
MethodsStudy area, population and designThis study adopted a cross-sectional design to estimate the prevalence of hypertension using the recent 2017 American Heart Association Guideline of ≥ 130/80mm Hg among adult male and female residents of a semi-urban community in Nigeria. Only adults who willingly gave consent were included in the study. Sapele is a sub-urban community in the heart of Delta State which is a microcosm of Nigeria. The major tribe in Sapele is Okpe (a part of the Urhobo-speaking community) and the foremost occupations of the people of Sapele include trading, sustenance farming and civil service. The major languages spoken in Sapele include Itsekiri, Urhobo and Okpe, and it is as multi-tribal as the generality of the nation. With a total population of 197,430 (extrapolated from 2006 census figures and an annual population growth rate of 3.2%) it is a typical community with demographics which mirror those of the general population in the country19–21.
Sample size and sampling techniqueA total of 300 participants were recruited with a stratified random technique from all four quarters of the community. Streets, and subsequently, houses in each quarter were selected with a simple random technique and all consenting adults in the selected houses had to be recruited into the study.
Data collectionWith appropriate sphygmomanometer (manufactured by Accoson®, Harlow Essex, UK) cuff sizes applied to the right arm and participants sitting upright blood pressure was measured and reading taken to the nearest 2mm Hg just before interviewing the participants. Systolic and diastolic blood pressure readings were determined by the first and fifth Korotkoff phases, respectively. Participants’ heights were recorded as the head piece of the stadiometer was lowered so that their hair was pressed. Participants’ body weight was measured with an electronic weighing scale (maximum capacity of 120kg in divisions of 100 grams).
Quality controlA subsequent blood pressure measurement was taken at the end of the interview by the researchers taken 5minutes apart. The respective averages of the two measurements of systolic and diastolic pressures were recorded as the actual systolic and diastolic pressure. Where the 5th korotkoff was not heard the 4th korotkoff was used as the value of the diastolic pressure. The weighing scale was calibrated each day with a standard weight, making sure the readings taken from the zero mark of the scale are recorded. The stadiometer was checked daily for accuracy by measuring the height of a known reference standard. Two measurements were taken per person and the average determined and recorded.
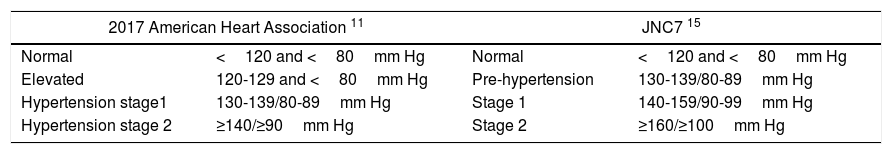
Data analysisData was analysed with SPSS version 22. Potential relationships between blood pressure, body mass index, age and sex were explored with odds ratio, chi-square and Pearson's correlation. Prevalence of hypertension was expressed as percentages and the difference in proportions was tested with chi-square. Logistic regression was employed to elicit actual predictors of abnormal blood pressure, systolic as well diastolic hypertension. Blood pressure was categorized according to Table 1.
Ethical considerationEthical approval was sought and obtained from the health research and Ethics Committee of Delta State University Teaching Hospital, Oghara. The purpose of the study was explained to the participants who also gave informed consent before collecting data from them. Utmost confidentiality was kept in the entire course of the study.
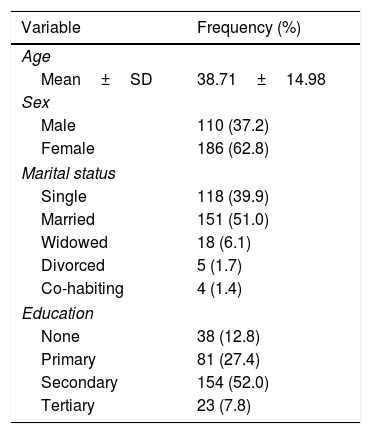
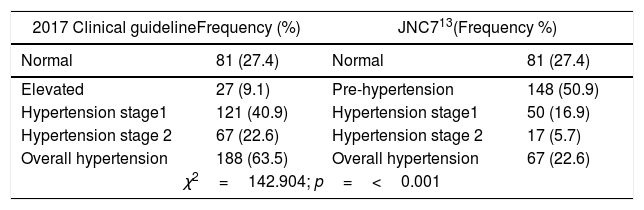
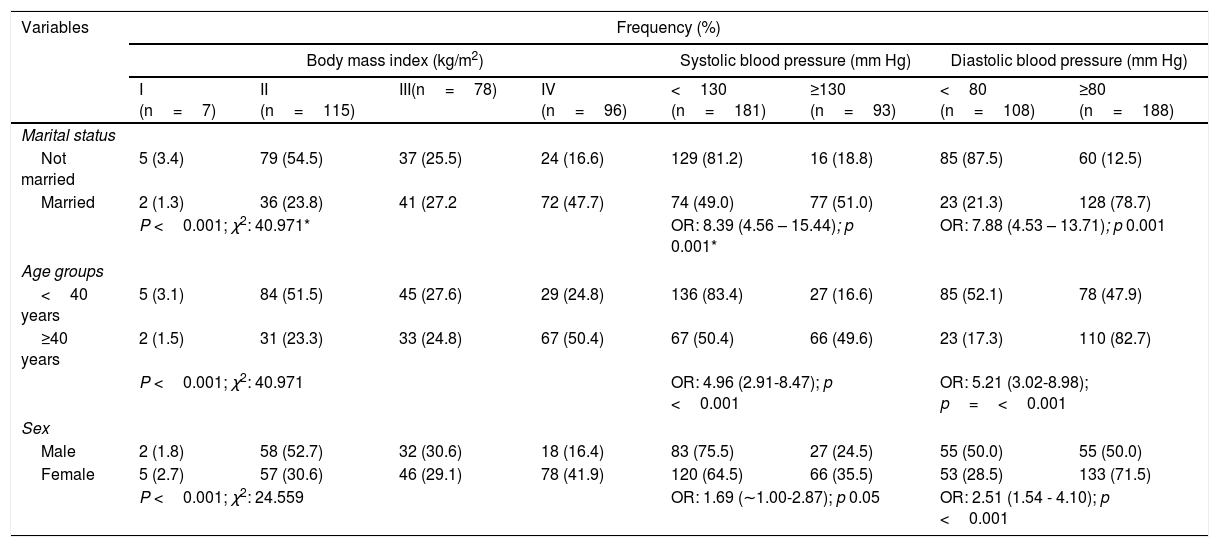
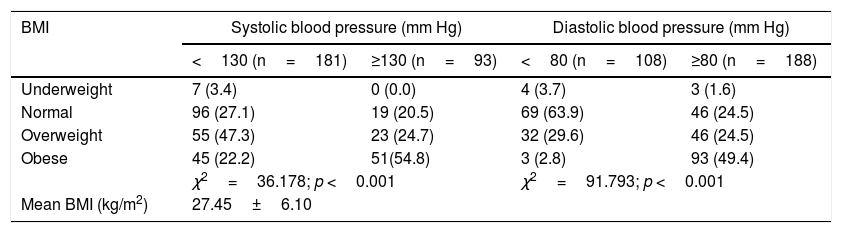
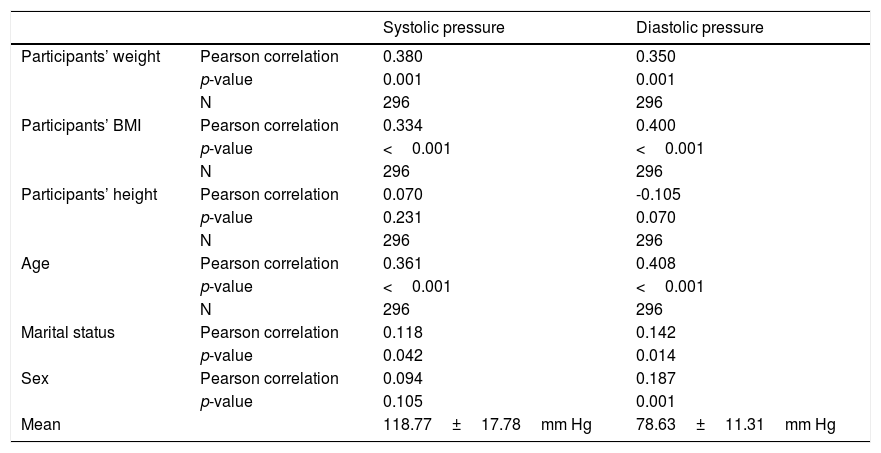
ResultsThe mean age of respondents was 38.71 years, with over two-fifths being female and more than half had secondary education (Table 2). Two-fifths (40.9%) of the population were in pre-hypertensive stage. Overall prevalence of hypertension was 63.5% (combined stages 1 and 2). While stage 2 hypertension appears more prevalent than stage 1 a little over a quarter (27.4%) of all participants had normal blood pressure. Nevertheless, with JNC7 classification the prevalence of hypertension was 22.6% (Table 3). Participants 40 years and over were three times as likely as their younger counterparts to have abnormal blood pressure, OR: 3.68 (2.06-3.57). Females were almost twice as likely as males to have blood pressure ≥ 130/80mm Hg. Over two-fifths of those with abnormal blood pressure were obese while none of the obese participants had normal blood pressure (Table 4). The unmarried people were eight times as likely as the married to have normal systolic [OR=8.39 (4.56 – 15.44)] and diastolic [OR=7.88 (4.53 – 13.71] blood pressures. Participants below 40 years were four times more likely than older participants to have normal systolic [OR=4.96 (2.91-8.47)] and diastolic [OR=5.21 (3.02-8.98)] blood pressures. Males were twice more likely than females to have normal diastolic [OR: 2.51 (1.54 - 4.10)] blood pressure. Half (50.4%) of those forty years and older were obese, while slightly more than half (51.5%) of the younger sub-population had normal weight for height. The association between age and BMI was significant (p<0.001). More females than males were obese (41.9% vs. 16.4%); the association between sex and BMI was highly significant (p<0.001) (Table 5). More than half (54.8%) of all respondents with abnormal systolic blood pressure were obese; similarly, about half (49.4%) of those with abnormal diastolic blood pressure were obese. The association between BMI and abnormal blood pressure was significant (p<0.001) (Table 6). Systolic and diastolic blood pressure had a moderate but positive correlation with participants’ weight (r=0.380, 0.350, p<0.001), BMI (r=0.334, 0.400, p<0.001) and age (r=0.361, 0.408, p<0.001). The mean systolic and diastolic blood pressures were 118.77±17.78mm Hg and 78.63±11.31mm Hg respectively. (Table 7) Whereas actual weight [adjusted OR=0.897 (0.856-0.939)] and age less than 40 years [adjusted OR=0.243 (0.115-0.513)] predicted reduced risk for abnormal blood pressure; overweight BMI category showed increased risk [adjusted OR=4.235 (1.048-17.109)] for abnormal blood pressure. Actual weight [adjusted OR=1.072 (1.030-1.115)] and age ≥ 40 years [adjusted OR=4.701 (2.374-9.311)] predicted higher risk for diastolic hypertension. Also, actual weight [adjusted OR=1.056 (1.035-1.077)] and age ≥ 40 years [adjusted OR=4.330 (2.459-7.623)] predicted higher risk for systolic hypertension (Table 8).
Socio-demographic characteristics of the study population.
| Variable | Frequency (%) |
|---|---|
| Age | |
| Mean±SD | 38.71±14.98 |
| Sex | |
| Male | 110 (37.2) |
| Female | 186 (62.8) |
| Marital status | |
| Single | 118 (39.9) |
| Married | 151 (51.0) |
| Widowed | 18 (6.1) |
| Divorced | 5 (1.7) |
| Co-habiting | 4 (1.4) |
| Education | |
| None | 38 (12.8) |
| Primary | 81 (27.4) |
| Secondary | 154 (52.0) |
| Tertiary | 23 (7.8) |
Prevalence of hypertension based on 2017 and JNC 7 guidelines on hypertension.
| 2017 Clinical guidelineFrequency (%) | JNC713(Frequency %) | ||
|---|---|---|---|
| Normal | 81 (27.4) | Normal | 81 (27.4) |
| Elevated | 27 (9.1) | Pre-hypertension | 148 (50.9) |
| Hypertension stage1 | 121 (40.9) | Hypertension stage1 | 50 (16.9) |
| Hypertension stage 2 | 67 (22.6) | Hypertension stage 2 | 17 (5.7) |
| Overall hypertension | 188 (63.5) | Overall hypertension | 67 (22.6) |
| χ2=142.904; p=<0.001 | |||
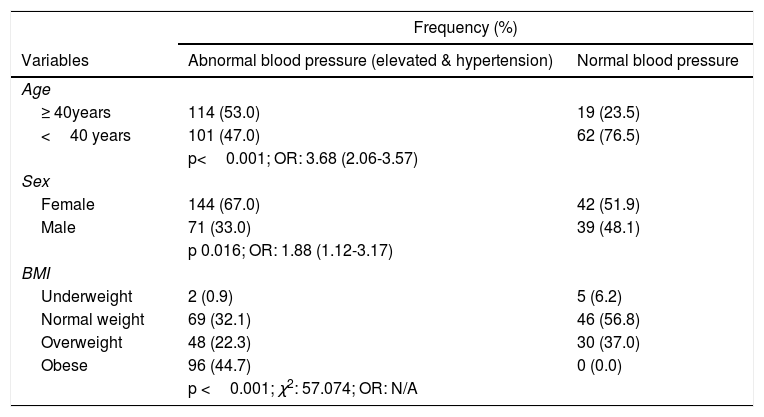
Determinants of abnormal blood pressures.
| Frequency (%) | ||
|---|---|---|
| Variables | Abnormal blood pressure (elevated & hypertension) | Normal blood pressure |
| Age | ||
| ≥ 40years | 114 (53.0) | 19 (23.5) |
| <40 years | 101 (47.0) | 62 (76.5) |
| p<0.001; OR: 3.68 (2.06-3.57) | ||
| Sex | ||
| Female | 144 (67.0) | 42 (51.9) |
| Male | 71 (33.0) | 39 (48.1) |
| p 0.016; OR: 1.88 (1.12-3.17) | ||
| BMI | ||
| Underweight | 2 (0.9) | 5 (6.2) |
| Normal weight | 69 (32.1) | 46 (56.8) |
| Overweight | 48 (22.3) | 30 (37.0) |
| Obese | 96 (44.7) | 0 (0.0) |
| p <0.001; χ2: 57.074; OR: N/A | ||
N/A: not applicable
Factors associated with body mass index and blood pressures.
| Variables | Frequency (%) | |||||||
|---|---|---|---|---|---|---|---|---|
| Body mass index (kg/m2) | Systolic blood pressure (mm Hg) | Diastolic blood pressure (mm Hg) | ||||||
| I (n=7) | II (n=115) | III(n=78) | IV (n=96) | <130 (n=181) | ≥130 (n=93) | <80 (n=108) | ≥80 (n=188) | |
| Marital status | ||||||||
| Not married | 5 (3.4) | 79 (54.5) | 37 (25.5) | 24 (16.6) | 129 (81.2) | 16 (18.8) | 85 (87.5) | 60 (12.5) |
| Married | 2 (1.3) | 36 (23.8) | 41 (27.2 | 72 (47.7) | 74 (49.0) | 77 (51.0) | 23 (21.3) | 128 (78.7) |
| P <0.001; χ2: 40.971* | OR: 8.39 (4.56 – 15.44); p 0.001* | OR: 7.88 (4.53 – 13.71); p 0.001 | ||||||
| Age groups | ||||||||
| <40 years | 5 (3.1) | 84 (51.5) | 45 (27.6) | 29 (24.8) | 136 (83.4) | 27 (16.6) | 85 (52.1) | 78 (47.9) |
| ≥40 years | 2 (1.5) | 31 (23.3) | 33 (24.8) | 67 (50.4) | 67 (50.4) | 66 (49.6) | 23 (17.3) | 110 (82.7) |
| P <0.001; χ2: 40.971 | OR: 4.96 (2.91-8.47); p <0.001 | OR: 5.21 (3.02-8.98); p=<0.001 | ||||||
| Sex | ||||||||
| Male | 2 (1.8) | 58 (52.7) | 32 (30.6) | 18 (16.4) | 83 (75.5) | 27 (24.5) | 55 (50.0) | 55 (50.0) |
| Female | 5 (2.7) | 57 (30.6) | 46 (29.1) | 78 (41.9) | 120 (64.5) | 66 (35.5) | 53 (28.5) | 133 (71.5) |
| P <0.001; χ2: 24.559 | OR: 1.69 (∼1.00-2.87); p 0.05 | OR: 2.51 (1.54 - 4.10); p <0.001 | ||||||
Blood pressure and body mass index.
| BMI | Systolic blood pressure (mm Hg) | Diastolic blood pressure (mm Hg) | ||
|---|---|---|---|---|
| <130 (n=181) | ≥130 (n=93) | <80 (n=108) | ≥80 (n=188) | |
| Underweight | 7 (3.4) | 0 (0.0) | 4 (3.7) | 3 (1.6) |
| Normal | 96 (27.1) | 19 (20.5) | 69 (63.9) | 46 (24.5) |
| Overweight | 55 (47.3) | 23 (24.7) | 32 (29.6) | 46 (24.5) |
| Obese | 45 (22.2) | 51(54.8) | 3 (2.8) | 93 (49.4) |
| χ2=36.178; p <0.001 | χ2=91.793; p <0.001 | |||
| Mean BMI (kg/m2) | 27.45±6.10 | |||
Correlation of height, weight and age with blood pressures.
| Systolic pressure | Diastolic pressure | ||
|---|---|---|---|
| Participants’ weight | Pearson correlation | 0.380 | 0.350 |
| p-value | 0.001 | 0.001 | |
| N | 296 | 296 | |
| Participants’ BMI | Pearson correlation | 0.334 | 0.400 |
| p-value | <0.001 | <0.001 | |
| N | 296 | 296 | |
| Participants’ height | Pearson correlation | 0.070 | -0.105 |
| p-value | 0.231 | 0.070 | |
| N | 296 | 296 | |
| Age | Pearson correlation | 0.361 | 0.408 |
| p-value | <0.001 | <0.001 | |
| N | 296 | 296 | |
| Marital status | Pearson correlation | 0.118 | 0.142 |
| p-value | 0.042 | 0.014 | |
| Sex | Pearson correlation | 0.094 | 0.187 |
| p-value | 0.105 | 0.001 | |
| Mean | 118.77±17.78mm Hg | 78.63±11.31mm Hg |
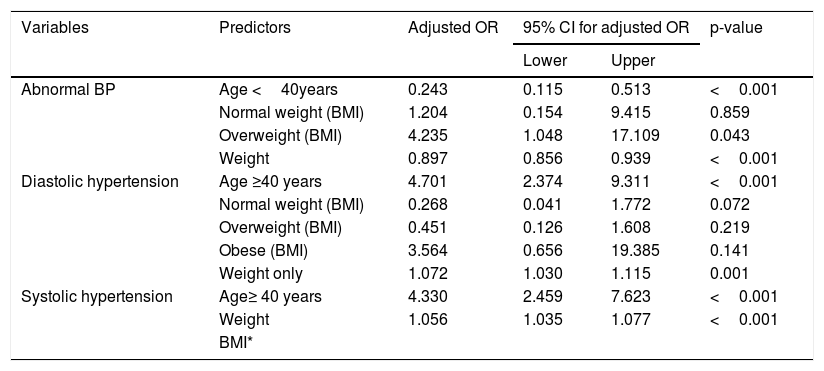
Predictors of abnormal blood pressure, diastolic and systolic hypertension.
| Variables | Predictors | Adjusted OR | 95% CI for adjusted OR | p-value | |
|---|---|---|---|---|---|
| Lower | Upper | ||||
| Abnormal BP | Age <40years | 0.243 | 0.115 | 0.513 | <0.001 |
| Normal weight (BMI) | 1.204 | 0.154 | 9.415 | 0.859 | |
| Overweight (BMI) | 4.235 | 1.048 | 17.109 | 0.043 | |
| Weight | 0.897 | 0.856 | 0.939 | <0.001 | |
| Diastolic hypertension | Age ≥40 years | 4.701 | 2.374 | 9.311 | <0.001 |
| Normal weight (BMI) | 0.268 | 0.041 | 1.772 | 0.072 | |
| Overweight (BMI) | 0.451 | 0.126 | 1.608 | 0.219 | |
| Obese (BMI) | 3.564 | 0.656 | 19.385 | 0.141 | |
| Weight only | 1.072 | 1.030 | 1.115 | 0.001 | |
| Systolic hypertension | Age≥ 40 years | 4.330 | 2.459 | 7.623 | <0.001 |
| Weight | 1.056 | 1.035 | 1.077 | <0.001 | |
| BMI* | |||||
N/A: not applicable; Sex, marital and occupation were excluded from the regression model since they had very weak correlation with blood pressure; BP: blood pressure
The prevalence of high blood pressure in Nigeria ranges from 8-45% from a wide array of systematic studies12–14. This value has also been projected to increase further because of rapidly changing lifestyle of the populace. From our study, the prevalence of hypertension based on JNC 7 guideline15 was 22.6% and it increased astronomically to 63.5% when the novel ACC/AHA guideline 11 was adopted to categorise respondents. A lower prevalence of 13.1% (based on JNC 7 benchmarks) was reported from a previous study conducted five years earlier among a rural adult population in south-west, Nigeria22. The higher prevalence in our study portends a probable a rise in the prevalence of hypertension in Nigeria, and brings to bear a warning that proactive measures should be instituted to douse this trend. Otherwise, it is inevitable to have a population in the upcoming years with a significantly greater proportion of hypertensive individuals. We also found out that the bulk of participants in the pre-hypertensive group were also larger than every other category when the JNC 7 guideline 15 was applied. With early detection and treatment of this “at-risk group” it is possible to halt and/or reverse the progression of target organ damage if proper interventions and preventive programs are built into health systems23,24.
This study reveals that a significantly higher proportion of respondents was diagnosed hypertensive with the 2017 ACC/AHA guideline11 as opposed to the much older JNC 8 guideline9. Again, this is largely expected, as most respondents who would have been pre-hypertensive are now adjudged to be at stage one hypertension.
The study also showed that females had a tendency to have higher blood pressures than males, although the females were more than the males in the study. The higher blood pressure in females may not be unconnected to a higher body mass index (BMI) as more females were obese. Some studies have recorded a higher prevalence of hypertension especially among females13,21 while others have shown a male preponderance11,14.
Age is known to be one of the cardiovascular risk factors making the ageing population have a higher propensity for poor cardiovascular outcomes. In this study, age was found to be an independent predictor of blood pressure as abnormal blood pressure was significantly higher among those above 40years and age was positively correlated with blood pressure. This is in keeping with previous studies which have shown a positive relationship between age and blood pressure parameters14,24. Also, obese respondents had higher blood pressures compared with those who had normal body mass index and, blood pressure correlated positively with body weight. This finding is supported by other studies indicating a trend towards higher blood pressures among obese people3,14. Obesity has been shown to contribute to the burden of cardiovascular diseases in many developed countries. The prevalence of obesity is on the rise especially among black population25,26, and this has, in a way, led the American Heart Association to re-define who actually a hypertensive is. The need for identification, pursuit for reduction of target organ damages as well as risk factor modification in patients with pre-hypertension is, therefore, crucial. Although it may appear that labelling patients who were previously pre-hypertensive as “hypertensive” could be perplexing for them, they may become better motivated to make informed choices about lifestyle changes fundamental for preventing complications of high blood pressure. It is known that the risk of cardiovascular events (stroke and ischaemic heart disease) doubles for a rise in systolic blood pressure >20mm Hg and/or diastolic blood pressure>10mm Hg, thus, it may be advisable to detect abnormal blood pressures early before the risk of developing adverse events become established15,23. A primary factor in the prevention of cardiovascular events is to ensure hypertension does not develop ab initio. Therefore, underpinning causes which potentially accentuates individuals’ risk for hypertension have to be addressed primordially.
Given the high prevalence of hypertension determined by the 2017 ACC/AHA guideline there may be uncertainty about its applicability in the Nigerian population. Consequently, it may be important to further investigate this hypertensive group to ascertain if they already have complications. However, this study is limited by its design and the fact that biochemical cardiovascular risk factors and/or complications of hypertension such as dyslipdaemia, coronary artery disease, et cetera, were not assessed in this population. Thus, future studies that would employ a comparative design to explore these risk factors and/or complications among a treatment-naïve hypertensive population and a non-hypertensive population may be required.
ConclusionPrevalence of hypertension based on the new guideline is staggeringly high and portends a huge public health problem. This conundrum requires immediate intervention in order to forestall the damaging effects of hypertension on vital body organs and for participants to lead a healthy life.
FundingNo funding was received for this study.
Conflict of interestNone.
To our senior colleagues for proof-reading the article.