


There are two different pharmacokinetic models (Marsh and Schnider) for the administration of total intravenous anesthesia with propofol, the parameter differences could have some impact over the depth of anesthesia.
ObjectiveTo determine if there is a significant difference in the variability of depth of anesthesia suggesting that one model is superior in achieving a more stable and predictable depth of anesthesia during surgery.
MethodsA cross-over clinical trial was conducted on 16 healthy patients programmed for upper or lower limb ambulatory orthopedic surgery. Patients were randomly assigned to (i) effect site target controlled infusion of propofol with Marsh model at a target concentration of 2.5μg/ml for 20min, a 20min washout, then propofol was administered with Schnider model at the same effect site target for the reminder of the surgery, or (ii) the reverse sequence. Differences in variability of depth of anesthesia, were assessed by comparing records of spectral entropy indices during surgery through an unpaired t-test.
ResultsThere was no evidence of significant difference in the mean variances of either spectral entropy indices between the two models (p-value: 0.57 for State Entropy, p-value: 0.51 for Response Entropy).
ConclusionThe study suggests that both pharmacokinetic models are equivalent in terms of stability of depth of anesthesia. It is important to keep testing determinants of the efficacy of the models in different types of population because their behavior according to individual characteristics of patients or variables such as cost-effectiveness could end up tilting the scale.
Hay dos modelos farmacocinéticos diferentes para la administración de la anestesia total intravenosa con propofol (Marsh y Schnider), las diferencias entre los parámetros podrían tener algún impacto sobre la profundidad anestésica.
ObjetivoComparar la variabilidad de la profundidad anestésica durante administración de infusión de propofol con los modelos de Marsh y Schnider para determinar si hay diferencias significativas que sugieran que uno de los modelos es superior en lograr una profundidad anestésica más estable y predecible.
MétodosEstudio clínico cruzado, controlado y aleatorizado llevado a cabo en 16 pacientes programados para cirugía ambulatoria de ortopedia. Los pacientes fueron asignados aleatoriamente a i) infusión controlada por objetivo de propofol con el modelo de Marsh a una concentración objetivo en sitio de efecto de 2.5ug/ml durante 20 minutos, 20 minutos de periodo de lavado, seguido de infusión de propofol con modelo de Schnider a la misma concentración objetivo; o ii) la secuencia inversa. La diferencia en variabilidad de profundidad anestésica fue evaluada mediante la comparación de registros de índices de entropía con una prueba t no pareada.
ResultadosNo se encontró evidencia de diferencias significativas de la varianza media en los índices de entropía espectral asociada a los modelos (valor-p: 0.57 para entropía de estado, valor-p: 0.51 para entropía de respuesta).
ConclusiónEl estudio sugiere que ambos modelos son equivalentes en términos de estabilidad de profundidad anestésica. Es importante continuar estudiando la eficacia de los modelos en diferentes tipos de población, dado que su comportamiento según características individuales de los pacientes o variables cómo costo-efectividad podrían inclinar la balanza.
Currently, there are multiple efficacious anesthetic agents, inhaled as well as intravenous, and both types allow detailed titration and fast recovery with a good safety profile. However, total intravenous anesthesia has been demonstrating possible advantages over inhaled techniques, regarding not only safety during surgery and post-operative well being but also in terms of convenience of the administration technique in some specific circumstances (airway intervention, neuroanesthesia) and other issues like environmental impact. This is why total intravenous anesthesia has been gaining popularity in clinical practice, especially since the introduction of propofol, its use is increasingly widespread.1–4
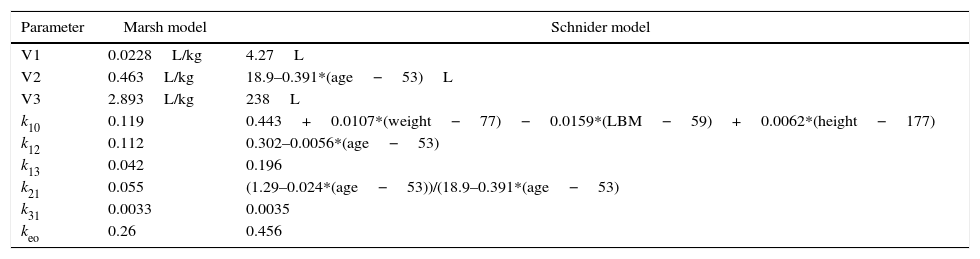
There are two pharmacokinetic models for the administration of total intravenous anesthesia (TIVA) with propofol, Marsh and Schnider models, which take into account interactions between body compartments to modify infusion rate and, in theory, maintain a constant plasmatic concentration.5 Although there is no evidence of clinically important differences between the two models, neither is it clear which of the two is able to predict more accurately the plasma concentrations, it is evident that they differ in the calculations of compartment volumes as well as diffusion velocity between them, which results in significant differences in total propofol dose administered, infusion velocity, and therefore estimated plasma and effect site concentration,6 differences that could have some impact over the depth of anesthesia. Table 1, presents respective equations for each model implemented in the B.Braun Space Infusion Pumps,7 corresponding parameters are: V1, distribution volume for central compartment. V2, V3, distribution volume for fast and slow peripheral compartments. k10, velocity constant for elimination rate. k12, k13, velocity constants from central compartment to peripheral compartments. k21, k31, velocity constants from peripheral compartments to central compartment.
Model parameters, the Marsh model with weight. The Schnider model with age, weight, height, Lean Body Mass (LBM).
| Parameter | Marsh model | Schnider model |
|---|---|---|
| V1 | 0.0228L/kg | 4.27L |
| V2 | 0.463L/kg | 18.9–0.391*(age−53)L |
| V3 | 2.893L/kg | 238L |
| k10 | 0.119 | 0.443+0.0107*(weight−77)−0.0159*(LBM−59)+0.0062*(height−177) |
| k12 | 0.112 | 0.302–0.0056*(age−53) |
| k13 | 0.042 | 0.196 |
| k21 | 0.055 | (1.29–0.024*(age−53))/(18.9–0.391*(age−53) |
| k31 | 0.0033 | 0.0035 |
| keo | 0.26 | 0.456 |
As of today, there is no gold standard to quantitatively measure the state of consciousness and the depth of anesthesia, ordinarily their monitoring is based on judgment of the anesthesiologist, based on variables of autonomic activity, respiratory cycles and pupil size.10 However, there has been important progress in the analysis of electroencephalographic signals by techniques like bispectral index (BIS)11 and spectral entropy indices (M-Entropy)12 which have demonstrated good correlation with sedation levels evaluated clinically and different steps of anesthesia.13,14 The M-Entropy module, particularly the Response Entropy (RE) index, was considered a better predictor of patient response to painful stimuli than BIS.15 This is why entropy measurement can be considered an indirect sign of depth of anesthesia, and allows a type of monitoring able to detect variations even within the same plane of anesthesia which makes it an ideal tool to evaluate dynamically and quantitatively the real repercussions of the differences observed between the two pharmacokinetic models for administration of anesthesia with propofol.
This research aims to describe the variability of the depth of anesthesia according to M-Entropy in patients ASA I during programmed upper or lower limb ambulatory orthopedic surgery during administration of Marsh as well as Schnider pharmacokinetic models, this variability is used to determine if there is a significant difference between them to suggest that one is superior in achieving a more stable and predictable depth of anesthesia during surgery.
MethodsAn uniform cross-over, controlled, clinical trial was designed and approved by the ethics committee of Clínica Universidad de la Sabana (C.U.S.), pilot trials were conducted with the surgical team involved in the procedures looking for homogeneity on criteria and management from all personal involved. The study took place from February to July 2015, it was registered in www.clinicaltrials.gov with study id number: ECC001-2015. Sixteen patients aged 18–65 years were included in the study, all with at least 8h of fasting, who had not previously been taking medication with action on the central or autonomous nervous system (benzodiazepines, beta blockers, calcium channel blockers, alpha 2 agonists), with no communicative or auditory difficulties, with no propofol allergy, with pre-anesthetic evaluation (medical and nurse) by the Anesthesiology department of C.U.S., with American Society of Anesthesiology classification (ASA) I, programmed for upper or lower extremity ambulatory orthopedic surgery, who required regional anesthesia by sonogram guided nerve block combined with general anesthesia. For all patients, informed consent (surgical, anesthetic, and research inclusion) was signed and verified, check list was performed, adequate oxygen pressure, connected anesthetic vaporizers, secured and correctly assembled breathing system, emergency oxygen tank, adequate state of fluxometers, circuit, unidirectional valves, pressure relief valves, CO2 absorbent canister and finally adequate function of ventilator and monitors were noted. Surgical Safety Checklist: Safe Surgery Saves Lives was implemented. Monitoring with electrocardiography, non-invasive blood pressure, pulse oximetry, capnography and entropy was initiated. Adequate electrode impedance and reliable reading from the monitor (Datex/Ohmeda) was ensured.
All patients were premedicated with 0.03mg/kg IV midazolam and 2μg/kg fentanyl, area was prepared with chlorhexidine in sterile fashion. Nerve was located using stimulating needle, nerve stimulator and extension line (ref. 5194.103 30°-21G-L 100mm, Locoplex®). For lower limb, advance current of 1.2mA was used until nerve response was achieved at 0.5mA to localize femoral and obturator nerves by anterior approach and sciatic nerve via posterior approach. For upper limb, a similar procedure was performed with supraclavicular or axillar approaches for nerve blockade. 20ml of local anesthetic was infused over each nerve, using 0.375% levobupivacaine without epinephrine and 1% lidocaine with weight adjusted dose without reaching a maximal dose of 150mg for levobupivacaine and 5mg/kg for lidocaine. Absence of pain, paresthesia, dysesthesia or difficult infusion was verified during the administration of local anesthetic. Additionally, position of the needle was assessed by ultrasound guidance. To ensure randomization, an equilibrated list of values 0 and 1 was generated using randomization function of Matlab (The Mathworks Inc., Massachusetts, U.S.A.) version 2015a16, where 0 meant starting with Marsh model and 1 starting with Schnider. Then digital data collection of SE and RE was started every 5s using the Datex/Ohmeda collect™ serial communication acquisition software for later processing using Matlab. M-Entropy indices were registered during a 4min baseline period without propofol, then, the anesthesiologist was informed with which model to initiate the procedure according to the order generated by the list. A technique of TIVA through target controlled infusion (TCI) with B Braun laboratory infusion pump was used.7 Induction was conducted with 5ng/ml remifentanil (Ultiva, Minto model) and after 3min, 1% propofol–lipuro infusion started at an effect site target concentration of 2.5μg/ml with either Marsh or Schnider model. An additional 1mg/kg propofol bolus was administered for placement of the laryngeal mask. TCI with propofol was administered for a period of 20min from the beginning of surgery (period A) after which the infusion was suspended for 20min of washout period (W). Next, the propofol infusion was configured and started again with the remaining pharmacokinetic model until the end of the surgery (period B). W was established by observation of plasma levels estimated by the infusion pump during pilot trials (Fig. 1).
.17")
Cross-over design. Source: Modified from Wellek et al. (2012).17
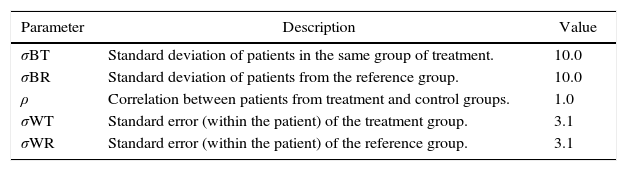
Sample size was determined using the parameters shown in Table 2. Using Eq. (1) for integration of variances.18
Source: Siyasinghe and Sooriyarachchi (2011).18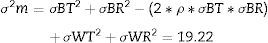
parameters for sample size calculation.
| Parameter | Description | Value |
|---|---|---|
| σBT | Standard deviation of patients in the same group of treatment. | 10.0 |
| σBR | Standard deviation of patients from the reference group. | 10.0 |
| ρ | Correlation between patients from treatment and control groups. | 1.0 |
| σWT | Standard error (within the patient) of the treatment group. | 3.1 |
| σWR | Standard error (within the patient) of the reference group. | 3.1 |
Considering type I error (α=0.05), and 80% of power (β=0.2) to detect a expected difference in entropy values between groups of E=10 units, the parameters from the normal standard probability distribution A (Eq. (2)) and B (Eq. (3)) were determined using Matlab 2015a.16
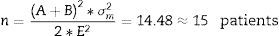
Then calculation of the sample size is (Eq. (4))Source: Siyasinghe and Sooriyarachchi (2011).18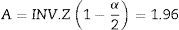

For statistical analysis, output variances for each patient from the periods associated to pharmacokinetic models were averaged, an unpaired t-test was performed and implemented (Eq. (5)) to confirm the absence of carryover according to Wellek and Blettner.17
Source: Wellek et al. (2012)17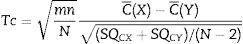
Where:
m: number of patients in Marsh–Schnider group.
n: number of patients in Schnider–Marsh group.
N: total number of patients.
C¯(X): mean of the sum of variances in Marsh–Schnider group.
C¯(Y): mean of the sum of variances in Schnider–Marsh group.


Then, the differences between models were evaluated. Statistical significance was estimated using an unpaired t-test, this time comparing the mean of the differences of variances of the entropy indices for each model in every patient as shown in Eq. (6):
Source: Wellek et al. (2012)17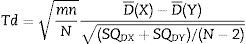
Where:D¯(X): mean of the difference of variances in Marsh–Schnider group
D¯(Y): mean of the difference of variances in Schnider–Marsh group
Finally, post hoc power (1−β) was calculated as a function of different degrees of mean variance difference (δ).19 Data processing and statistical tests were done with a function developed on Matlab (analisis_pk.m) which takes as input arguments the times registered during data recollection and M-entropy series to calculate the variance of each period, then statistics test were applied.
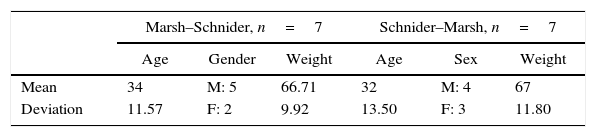
ResultsEight patients were allocated initially to each group and underwent the described intervention. Data from two patients was excluded because the surgical time was not enough to complete the study design. The demographics of the population studied are presented in Table 3, organized according to the groups associated to the pharmacokinetic models
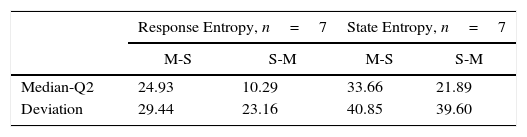
The periods for analysis were defined for each pharmacokinetic model, Fig. 2 shows the experimental design applied to one of the patients. After that, variance of the M-Entropy indices of Datex–Ohmeda (SE, RE) was determined for each period in both study groups. Median variance and respective standard deviation for SE in Marsh period was 31.12±25.01, in Schnider period was 21.97±36.76; for RE in marsh period was 30.54±49.24, and in Schnider period was 43.97±50.34.
 In purple is the delta time, defined from onset of propofol infusion with the first model until airway management, this time has the purpose that de data to be processed belongs to an anesthetized patient, not an awake patient or the transition sequence; A: in red is the first period defined from start of airway management until the end of propofol infusion with the first model; W: in green is the washout period from the end of the first period until the onset of propofol infusion with the remaining model; B: in blue is the second period from the onset of propofol infusion with the remaining model in the sequence to the end of infusion excluding the initial delta time. Source: Graphic produced by authors using Matlab 2015a.")
Experimental design applied to patient 6. (Induction with Schnider model, 72kg, 1.64m, 58 years, female.) In purple is the delta time, defined from onset of propofol infusion with the first model until airway management, this time has the purpose that de data to be processed belongs to an anesthetized patient, not an awake patient or the transition sequence; A: in red is the first period defined from start of airway management until the end of propofol infusion with the first model; W: in green is the washout period from the end of the first period until the onset of propofol infusion with the remaining model; B: in blue is the second period from the onset of propofol infusion with the remaining model in the sequence to the end of infusion excluding the initial delta time. Source: Graphic produced by authors using Matlab 2015a.
With the sum of the variances of each group, the pre-test for carryover effect between periods was implemented. The cumulative effect is reported in the form of median±standard deviation, for SE and sequence Marsh–Schnider, SE-C(X)=42.80±57.14, sequence Schnider–Marsh SE-C(Y)=53.70±48.52. Cumulative effect for RE-C(X)=84.89±39.63, and RE-C(Y)=91.93±48.90. Fig. 3 shows the box-plot of the cumulative effect for each group in the RE and SE series (Cx-RE, Cx-SE). There was no evidence of significant carryover effect between periods, two sided unpaired t-test for SE (p-value=0.54, T=0.63) and RE (p-value=0.92, T=−0.10).
Statistical test of differences and difference effects (Dx-RE, Dx-SE); M-S represents Marsh–Schnider sequence group and S-M represents Schnider–Marsh sequence group. Source: Graphic produced by authors using Matlab 2015a.")
The difference of variance for each period in both groups was obtained (Table 4), Fig. 3 also displays box-plot of the differences between periods related to each Datex–Ohmeda indice (Dx-SE, Dx-RE).
The statistical Td (Eq. (2)) was calculated to detect significant differences in the SE an RE series between the two pharmacokinetic models, no significant difference was found in the mean variance of entropy indices between Marsh and Schnider pharmacokinetic models, two sided unpaired t-test for SE (p-value=0.57, T=−0.58) and RE (p-value=0.51, T=−0.68).
Lastly, post hoc power of the study to detect differences between the mean variance of the models with SE and RE entropy was calculated. A vector differences from −125 to 125 with 2.5 step increments in variance units was used. Fig. 4 shows the corresponding power curve for differences in mean variance and mean standard deviation. The particular case for a difference of 100 variance units, therefore 10 standard deviation units corresponds to a power of 84.66% for SE and 85.99% for RE.
Discussion and RE (red). Source: Graphic produced by authors using Matlab 2015a.")
To the best knowledge of the authors, no studies were found that evaluated the mean variability of the general anesthesia in relation to the pharmacokinetic model used during total intravenous anesthesia with propofol. This was an initial limiting factor to determine the sample size and it was necessary to use estimated values for the parameters from the results of pilot trials. Cross-over design allows a reduced sample size because every subject is its own control, which lowers the inter-individual variability and the effect of covariates such as weight, age, and height. It was not considered necessary to maintain a double-blinding since none of the models is a “standard of care” which means there is no clear expectancy from the anesthesiologist about the results. Additionally the process was standardized so there was no supplementary management implemented, this way, the dosage of the infusions was controlled by the infusion pump according to the pharmacokinetic models and standard analgesic management was provided. In relation to possible bias from co-interventions, the initial pharmacokinetic model was revealed to the anesthesiologist right before onset of induction and after nerve blockade for regional anesthesia. Finally, response to intervention was measured and registered in an automated fashion without mediation from the anesthesiologist, and the M-entropy indices are an endpoint obtained from objective data which makes it less susceptible to bias.
There was one period of intervention with atypical values of variance in patient 3 (induction with Marsh model, 60kg, 1.72m, 22 ages, male). Further inspection of the entropy graphs series (SE, RE) revealed a temporal gap in the indices in relation to the clinical assessment (airway placement), therefore, definition of the times for period A included entropy values (SE, RE) associated with an awake patient (Fig. 5) which produced in those cases the atypical values of variance. Data that exceeded the statistical threshold defined by quartiles (Q3+3*(Q3−Q1)) were initially considered atypical and excluded from the statistical analysis, but it was decided to not discard the information that outlier values may provide, data marked as atypical was included for analysis.
; in purple is the delta time; A, in red is the first period. Source: Graphic produced by authors using Matlab 2015a.")
Temporal gap on entropy indices seen on patient 3 from Marsh–Schnider group. It shows that period A includes values of State and Response Entropy associated to an awake patient and the transition to an adequate anesthetic plane between 40 and 60 (Datex–Ohmeda); in purple is the delta time; A, in red is the first period. Source: Graphic produced by authors using Matlab 2015a.
Median variance and respective standard deviation in entire dataset for SE in Marsh period was 27.93±78.97, in Schnider period was 20.26±39.45; for RE in marsh period was 34.01±123.08, and in Schnider period was 36.03±60.59. An increment in the standard deviation of data point corresponding to the Marsh period were observed, although significant differences between pharmacokinetic models were not found (p>0.05), it was interesting to note that the outlier values produced a bigger impact on the groups that initiate the procedure with the Marsh model, this could be related to the difference in the pharmacodynamic parameter Keo, the lower value used in the marsh model (0.26min−1) in this study could provide an erroneous estimation of the propofol effect time, leading to an incorrect estimation of propofol dose. We used effect site target concentration for both models, it has been suggested that if the Marsh model is used in effect site targeting mode, it should be used with the faster keo of 1.2min−1 recommended by Struys and colleagues.6,20
The estimated washout time can be considered enough for the drug administered during period A not to affect the results of period B. Even though the use of remifentanil can modify depth of anesthesia, the present study focuses on analyzing the variation in entropy index and not on its mean value, thus, it is considered a constant administration for the whole intervention and in every patient to not affect the results of the study.
No information was found on the value of variance that could be considered clinically significant, and no statistically significant differences between the models were found for either of the entropy indices studied. Nevertheless, considering the range of appropriate anesthetic plane for this indices (40–60)12 it can be reasoned that a value of variance under 100 could be tolerable because in spite of the fluctuations they would remain in an adequate range. Data analysis showed a power over 80% to detect differences of 100 units of variance between the models for State Entropy index, which means that even if there is a difference, the actual mean variability of depth of anesthesia between the two models is probably not enough to define a clear superiority of one model in the clinical setting.
Absalom et al., maintain in their article that propofol infusion controlled by the Marsh model increases usage of propofol when compared to Schnider model, authors remark that the important question is not, which model delivers the largest or smallest dose of drug, but which one produces the more accurate predictions of plasma and effect site concentration. Fig. 6 presents a 3-D visualization of the multi-compartment models for propofol in a patient (70kg, 170cm, 25 years; male) programmed in Matlab software. Each compartment is represented by spheres according to respective volumes, a wider link between compartment represents a higher velocity constant, and thus a faster circulation of proprofol between compartments, blue links represent velocity parameters from central compartment V1 to peripheral compartments V2, V3, and the elimination rate; red links are the velocity parameters into V1.

3-D representation of Marsh and Schnider model for propofol. Based on published pharmacokinetics parameters.8,9 The Marsh model, v1=15.96L, v2=32.41L, v3=202.51L. The Schnider model, v1=4.27L, v2=31.02L, v3=238L. Source: Graphic produced by authors using Matlab 2015a.
Although there was no evidence of significant difference in variability of depth of anesthesia provided by models, marked differences are observed in velocity constants, a faster circulation of propofol between compartments is provided by the schnider pharmacokinetic model, the wider blue link associated with Keo in Schnider model proposes a faster circulation of propofol from plasma to the effect site, the parameters v1, v3, k13, k31 are fixed; the compartment v2 is inversely proportional to age, the elimination rate constant varies in a complex way with weight, height, and LBM. The Marsh model considers the same velocity constants for all kinds of patients, compartment volumes are proportional to weight, and it has been shown to under-predict plasma propofol concentration in the elderly.21 This fact, and the data found by the present study points toward a potential advantage of Schnider model, which adjust parameters according to patient age, height, LBM, and gender.
The development of the pharmacokinetic models3,4 did not include severely obese patients, for the case of a 96kg, 1.70m, 22 years, male person, the only difference in the Schnider model would be an increment in the elimination rate constant; the Marsh model would considers bigger compartments but the same elimination rate, and velocity constants between compartments. It is important to keep testing determinants of the efficacy of the models and use the TCI pumps with caution in different types of population because their behavior according to individual characteristics such as the severely obese patient, or variables such as cost-effectiveness could end up tilting the scale.
Ethical disclosuresProtection of human and animal subjectsThe authors declare that the procedures followed were in accordance with the regulations of the relevant clinical research ethics committee and with those of the Code of Ethics of the World Medical Association (Declaration of Helsinki).
Confidentiality of dataThe authors declare that they have followed the protocols of their work center on the publication of patient data.
Right to privacy and informed consentThe authors have obtained the written informed consent of the patients or subjects mentioned in the article. The corresponding author is in possession of this document.
FundingThis study was funded by Colombian Society of Anesthesiology and Reanimation, in the contest modality of investigation proposals.
Conflicts of interestThe authors have no conflicts of interest to declare.
Please cite this article as: Mosquera-Dussán OL, Cárdenas A, Botero-Rosas DA, Yepes A, Oliveros H, Henao R, et al. Ensayo clínico cruzado y aleatorizado para comparar dos modelos farmacocinéticos de propofol usando índices de entropía. Rev Colomb Anestesiol. 2016;44:193–200.