


Phytophthora parasitica is an important oomycete that causes disease in a variety of plants, dimethomorph fungicides being specific for oomycetes. The aim of this study was to use RNA-seq to rapidly discover the mechanism by which dimethomorph acts in the treatment of P. parasitica. We found that the expression of 832 genes changed significantly after the dimethomorph treatment, including 365 up-regulated genes and 467 down-regulated genes. According to the Gene Ontology (GO) enrichment analysis, pathway enrichment and verification test results, the following conclusions are obtained: (i) the treatment of P. parasitica with dimethomorph causes changes in the expression levels of genes associated with the cell wall and cell wall synthesis; (ii) dimethomorph treatment results in reduced permeability of the cell membrane and changes in the expression of certain transport-related proteins; (iii) dimethomorph treatment increased reactive oxygen species and reduced the expression of genes related to the control of oxidative stress.
Phytophthora parasitica es un importante oomiceto que origina enfermedades en una variedad de plantas; el fungicida dimetomorf es específico contra oomicetos. El objetivo de este estudio fue utilizar la tecnología de RNA-seq para descubrir rápidamente el mecanismo por el que el dimetomorf actúa en el tratamiento de P. parasitica. Descubrimos que la expresión de 832 genes se modificaba significativamente tras el tratamiento con dimetomorf, incluyendo 365 genes que son sobrerregulados y 467 genes que son subrregulados. El análisis de enriquecimiento de ontología de genes (GO), análisis de enriquecimiento de las vías y pruebas de verificación permitieron extraer las conclusiones siguientes: 1) el tratamiento de P. parasitica con dimetomorf origina cambios en los niveles de expresión de los genes relacionados con la pared celular y su síntesis; 2) el tratamiento con dimetomorf origina una reducción de la permeabilidad de la membrana celular, así como cambios en la expresión de ciertas proteínas relacionadas con el transporte, y 3) el tratamiento con dimetomorf incrementó las especies reactivas del oxígeno y redujo la expresión de los genes relacionados con el control del estrés oxidativo.
Phytophthora parasitica is a model oomycete plant pathogen15. Phytophthora represents a large group of devastating oomycete pathogens that causes important diseases in a wide variety of plant species, including potato, tomato, soybean, and valuable forest Trees5,12. These oomycete pathogens are a great threat to agricultural production and natural ecosystems9,10. For example, Pytophthorainfestans causes late blight in potato and tomato, which resulted in the Irish famine in the 1840s and remains an uncontrollable disease6.
The cell wall of P. parasitica mainly consists of 1-3-β-D glucans, 1-6-beta-d-glucans and cellulose2, though the cell wall in fungi is primarily composed of chitin13. Most fungicides target chitin and sterol synthesis and are ineffective in controlling oomycete diseases. As the unique features of oomycetes and notably of Phytophthora confer insensitivity to most fungicides, a specific agent for control is required.
The carboxylic acid amide (CAA) fungicide dimethomorph is currently used to control P. parasitica var. nicotianae, P.infestans and Plasmoparaviticola in China and remains an effective fungicide in controlling diseases caused by P. parasitica var. nicotianae21.
According to wide-ranging investigations and mode of action studies, these agents have no effect on the respiration of pathogens and the biosynthesis of lipids, proteins and nucleic acids7,10. According to microscopic and ultrastructural studies investigating the destruction of the mycelial cell endometrial structure, dimethomorph may interfere with the formation of the cell wall of the pathogen17.
Although only a few reports regarding the mode of action of dimethomorph are available, based on physiological and biochemical studies, we can investigate this topic using transcriptomics. Thus, we employed the P.nicotianae genome as a reference for a transcriptional study using Illumina RNA-seq1,11. We compared the transcriptional abundance between the control group and the processing group. This study provided new physiological insights into the mechanism of action of CAAs and provides a comprehensive illustration of the mechanism by which P. parasitica responds to the CAA-induced stress environment.
Methods and materialsStrain growth and processing conditionsP. parasitica was obtained from the Tobacco Research Institute of the Chinese Academy of Agricultural Sciences (Qingdao, China), stored at 4°C and kept in the dark. In the dark, the experimental group (dimethomorph-treated) was exposed to 1.44mg/l (lethal concentration 50, EC50) of dimethomorph in oat medium. P. parasitica grew over the entire Petri dish on the sixth day at 28°C and was used as the initial experimental material. At the same time, the control group (control) was grown in a normal environment without pesticides and kept in the dark for six days. Then, the mycelia were collected. Three biological repetitions per treatment of dimethomorph-treated and control were performed.
RNA extraction, library construction, and sequencingTotal RNA was extracted with a Qiagen RNeasy Midi Kit using shredder columns from a Qiagen Plant RNeasy Kit following the manufacturer's instructions. Genomic DNA was removed using an on-column digestion with DNase (Qiagen) at twice the concentration recommended by the manufacturer. The concentration of the total RNA was determined by spectrometry. Treatments and controls were repeated three times per group.
After extracting the total RNA, the eukaryotic mRNA was enriched by using oligo(dT) beads. Then, the enriched mRNA was fragmented into short fragments using a fragmentation buffer and reverse transcribed into cDNA using random primers. Then, the buffer, dNTPs, RNAse H and DNA polymerase I were added to synthesize the second-strand of cDNA. The cDNA fragments were purified with the QiaQuick PCR extraction kit and end repaired, poly(A) was added, and the fragments were ligated to Illumina sequencing adapters. The size of the ligation products was detected using agarose gel electrophoresis, and the products were PCR amplified and sequenced using Illumina HiSeq™ 2000 by Gene Denovo Biotechnology Co. (Guangzhou, China). The RNA-Seq data have been deposited in the NCBI Sequence (Short) Read Archive database with the SRA accession number SRP117995.
Read alignment of gene expression levelsThe reads obtained from the sequencing included raw reads containing adapters or low-quality bases that would affect the subsequent assembly and analysis. Thus, to obtain high-quality clean reads, raw reads of FASTQ format were first processed through in-house Perl scripts, as follows: (1) reads containing adapters were removed; (2) reads containing more than 10% of unknown nucleotides (N) were removed; and (3) low-quality reads containing more than 50% of low quality (Q-value≤10) bases were removed.
Analysis of differentially expressed genes (DEGs)The edgeR package (http://www.r-project.org/) was used to identify the differentially expressed genes across the samples or groups. Genes with a fold change ≥2 and a false discovery rate (FDR) <0.05 were considered significant DEGs. The DEGs were then subjected to Gene Ontology (GO) functions and the Kyoto Encyclopedia of Genes and Genomes (KEGG) pathway enrichment analysis. (1) GO functional annotations of unigenes were obtained from Nr annotation results. GO annotations of unigenes were analyzed using the Blast2GO software.4 Functional classification of unigenes was performed using WEGO software24. (2) Unigenes were aligned by BLASTx (evalue <0.00001) to protein databases in KEGG.
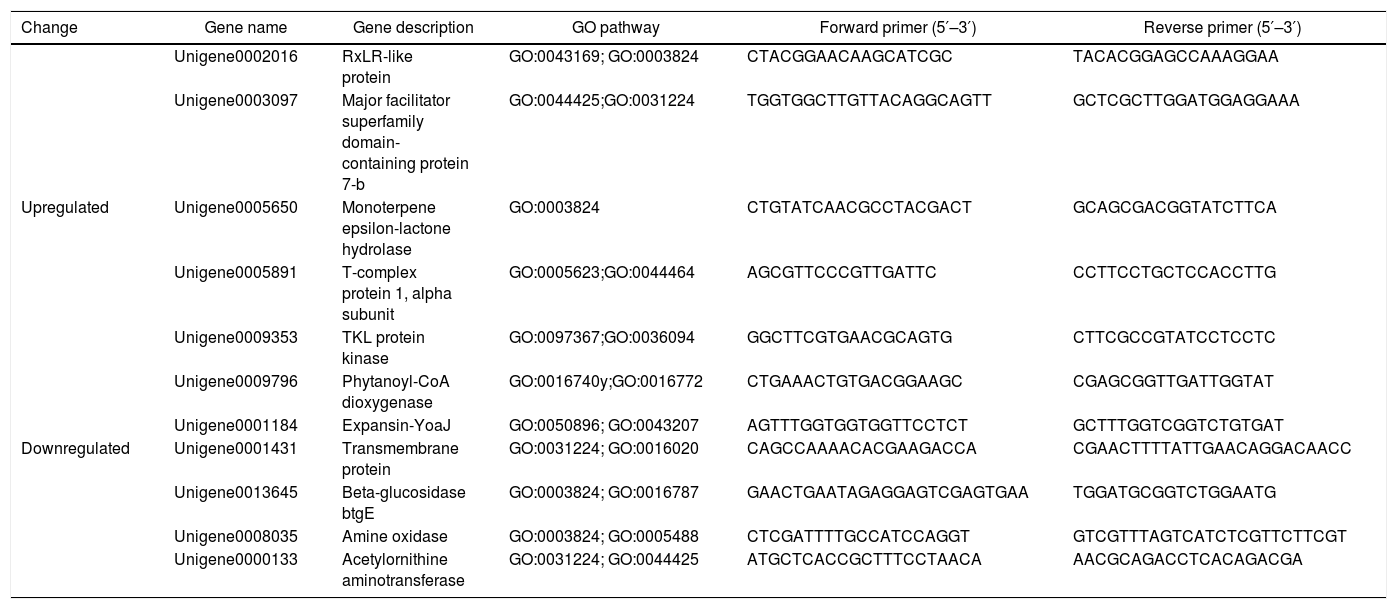
Quantitative real-time PCR (qRT-PCR) validationsSeveral differentially expressed genes were selected for qPCR analysis to determine whether the gene expression was consistent between the RNA-seq and qRT-PCR analyses. Total RNA was isolated using the TRIzol reagent according to the manufacturer's protocol, and the RNA was used for cDNA synthesis using reverse transcriptase. The S3a gene of P. parasitica was used as a housekeeping gene8. The 7500 Fast Real-time PCR System (Applied Biosystems, Foster, USA) was used to perform the thermocycling and record the changes in fluorescence. The quantification of each transcript was repeated using the total RNA as the starting material, qPCR runs were conducted using three technical replicates for each sample. The primers are listed in Table 1.
Oligonucleotide primers for qRT-PCR for DEG validation
| Change | Gene name | Gene description | GO pathway | Forward primer (5′–3′) | Reverse primer (5′–3′) |
|---|---|---|---|---|---|
| Unigene0002016 | RxLR-like protein | GO:0043169; GO:0003824 | CTACGGAACAAGCATCGC | TACACGGAGCCAAAGGAA | |
| Unigene0003097 | Major facilitator superfamily domain-containing protein 7-b | GO:0044425;GO:0031224 | TGGTGGCTTGTTACAGGCAGTT | GCTCGCTTGGATGGAGGAAA | |
| Upregulated | Unigene0005650 | Monoterpene epsilon-lactone hydrolase | GO:0003824 | CTGTATCAACGCCTACGACT | GCAGCGACGGTATCTTCA |
| Unigene0005891 | T-complex protein 1, alpha subunit | GO:0005623;GO:0044464 | AGCGTTCCCGTTGATTC | CCTTCCTGCTCCACCTTG | |
| Unigene0009353 | TKL protein kinase | GO:0097367;GO:0036094 | GGCTTCGTGAACGCAGTG | CTTCGCCGTATCCTCCTC | |
| Unigene0009796 | Phytanoyl-CoA dioxygenase | GO:0016740y;GO:0016772 | CTGAAACTGTGACGGAAGC | CGAGCGGTTGATTGGTAT | |
| Unigene0001184 | Expansin-YoaJ | GO:0050896; GO:0043207 | AGTTTGGTGGTGGTTCCTCT | GCTTTGGTCGGTCTGTGAT | |
| Downregulated | Unigene0001431 | Transmembrane protein | GO:0031224; GO:0016020 | CAGCCAAAACACGAAGACCA | CGAACTTTTATTGAACAGGACAACC |
| Unigene0013645 | Beta-glucosidase btgE | GO:0003824; GO:0016787 | GAACTGAATAGAGGAGTCGAGTGAA | TGGATGCGGTCTGGAATG | |
| Unigene0008035 | Amine oxidase | GO:0003824; GO:0005488 | CTCGATTTTGCCATCCAGGT | GTCGTTTAGTCATCTCGTTCTTCGT | |
| Unigene0000133 | Acetylornithine aminotransferase | GO:0031224; GO:0044425 | ATGCTCACCGCTTTCCTAACA | AACGCAGACCTCACAGACGA |
We used the ELISA kit (Shanghai Jianglai's biological) to measure the content of 1-3-β-D glucans. The solid-phase antibody was prepared by coating the microtiter plate with purified 1-3-β-D glucans antibody. Samples were added to the microwells of the coated monoclonal antibody, and 1-3-β-D glucans were combined with specific antibodies (horseradish peroxidase-labeled, HRP-labeled). After thorough washing, 3,3′,5,5-tetramethylbenzidine (TMB) substrate was added to develop color. TMB was converted to blue under the catalysis of the HRP enzyme, finally turned yellow under the action of acid. The depth of color was positively correlated with 1-3-β-D glucans in the sample. The absorbance (OD) was measured with a microplate reader at a wavelength of 450nm, and the concentration of 1-3-β-D glucans in the sample was calculated from a standard curve.
Detection of reactive oxygen speciesThe preparation of protoplasts is required for reactive oxygen detection; however, dimethomorph may interfere with the formation of the cell wall of the pathogen. Accordingly, this method cannot be used. ROS production was determined using a Reactive Oxygen Species Assay Kit (Beyotime). Briefly, after 6 d in normal culture, mycelium was collected and washed twice in warm PBS. Next, mycelium was added to medium containing 1.44mg/l dimethomorph and pesticide-free medium for 1h, followed by an incubation in prewarmed DCFH-DA at 37°C for 20min. Following two washes with PBS, reactive oxygen species in mycelium were measured at 488nm/525nm (excitation/emission) with a laser scanning confocal microscope (Leica).
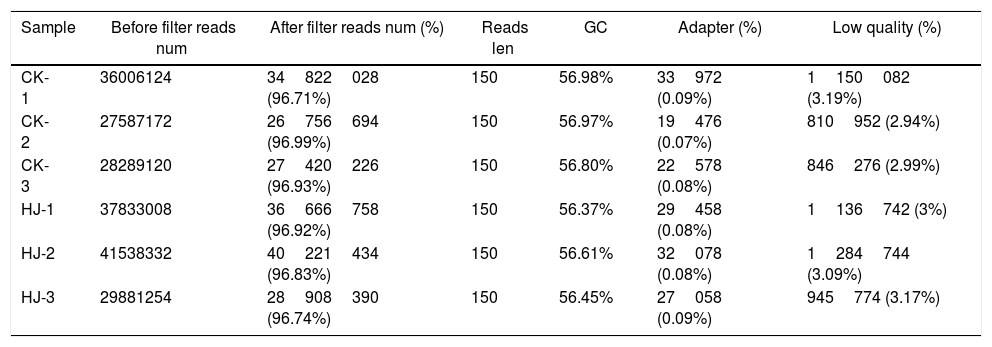
ResultsData processing and analysisUsing the Illumina sequencing platform, the clean reads were harvested (data not shown) after performing quality control and filtering the data. In the following figures and tables in this paper, CK and HJ represent the control group, and the dimethomorph-treated group, respectively. After removing the contaminated and low-quality sequences (Table 2), all reads were mapped to the published genome, which contains 16903 genes. In total, 16867 and 16888 genes were mapped for control and dimethomorph-treated groups, respectively. Unigenes represented by at least one mapped read were included in the subsequent analyses. The number of genes expressed in control and dimethomorph-treated accounted for 99.69%–99.81% of the total number of reference genes.
Control (CK) and dimethomorph-treated (HJ) (three biological replicates) raw read filters
| Sample | Before filter reads num | After filter reads num (%) | Reads len | GC | Adapter (%) | Low quality (%) |
|---|---|---|---|---|---|---|
| CK-1 | 36006124 | 34822028 (96.71%) | 150 | 56.98% | 33972 (0.09%) | 1150082 (3.19%) |
| CK-2 | 27587172 | 26756694 (96.99%) | 150 | 56.97% | 19476 (0.07%) | 810952 (2.94%) |
| CK-3 | 28289120 | 27420226 (96.93%) | 150 | 56.80% | 22578 (0.08%) | 846276 (2.99%) |
| HJ-1 | 37833008 | 36666758 (96.92%) | 150 | 56.37% | 29458 (0.08%) | 1136742 (3%) |
| HJ-2 | 41538332 | 40221434 (96.83%) | 150 | 56.61% | 32078 (0.08%) | 1284744 (3.09%) |
| HJ-3 | 29881254 | 28908390 (96.74%) | 150 | 56.45% | 27058 (0.09%) | 945774 (3.17%) |
To identify differentially expressed genes across dimethomorph-treated and control groups, the edgeR package (http://www.r-project.org/) was used. Based on comparison, we identified genes with a fold change ≥2 and a false discovery rate (FDR) <0.05 as significant DEGs. We found that the expression of 832 genes changed significantly after dimethomorph treatment, including 365 up-regulated genes and 467 down-regulated genes (Supplementary Table 1).
GO analysis of DEGsGene Ontology is a standardized system used for the functional classification of genes according to the 3 domains of biological process, cellular components, and molecular functions. To determine the functions of the differentially expressed genes in this study, all DEGs were annotated to the terms in the GO database. Of the DEGs that were annotated in the GO database, 131 DEGs were annotated in cellular components, 320 DEGs were annotated in molecular functions and 300 DEGs were annotated in biological processes.
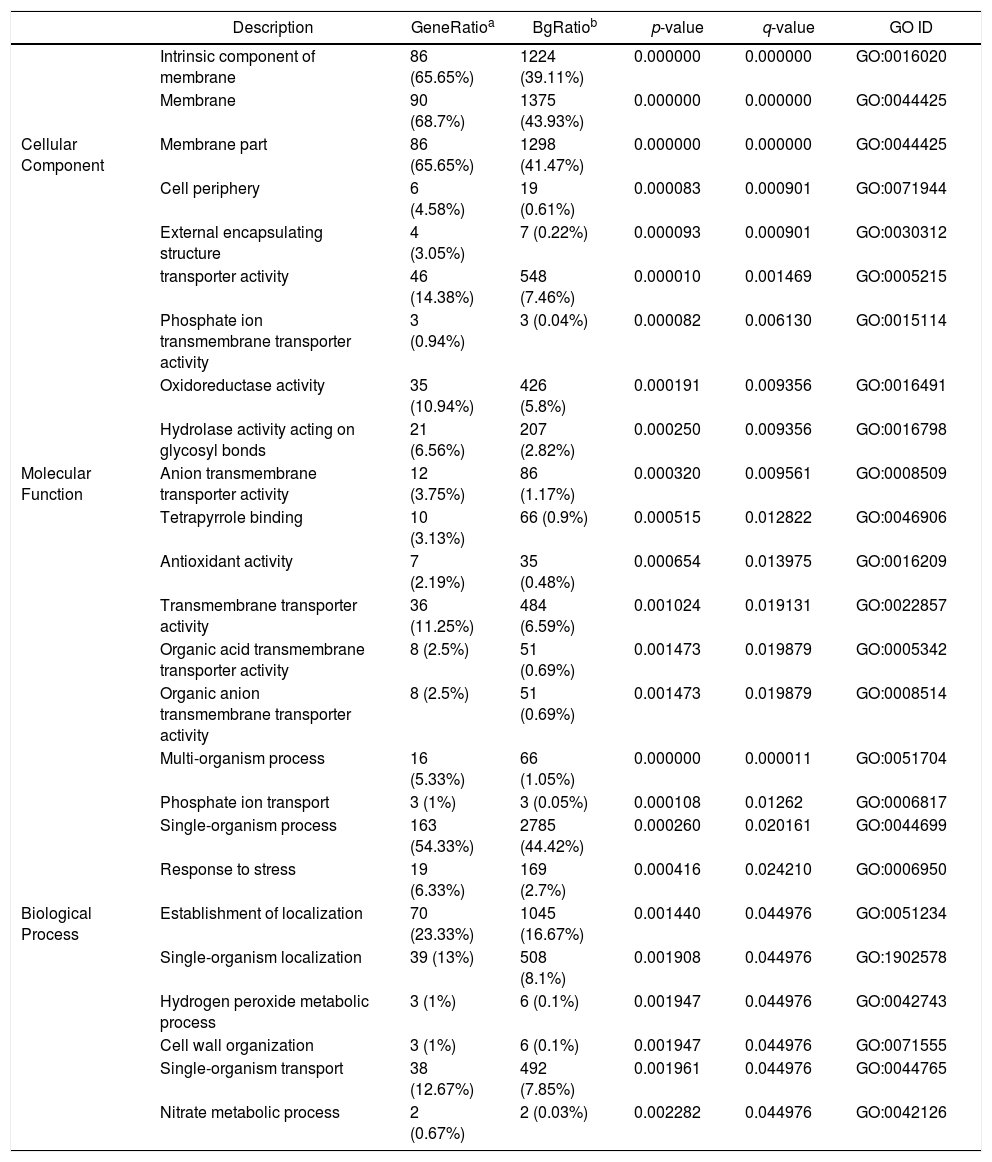
Of the 5 cellular components identified, the intrinsic component of the membrane (GO:0031224), the membrane (GO:0016020) and the membrane part (GO:0044425) were significantly enriched. Their proportions of total genes were 39.11%, 43.93% and 41.47%, respectively. Of the 17 molecular functions identified, transporter activity (GO:0005215), phosphate ion transmembrane transporter activity (GO:0015114) and oxidoreductase activity(GO:0016491) were significantly enriched, with total gene proportions of 7.46%, 0.04% and 5.8%, respectively. Of the 13 biological processes identified, multi-organism processes (GO:0051704), phosphate ion transport (GO:006817) and single-organism processes (GO:0044699); the number of these GO genes accounted for 1.05%, 0.05% and 44.42%, respectively, of the total genes (Table 3). These processes may be related to the treatment of P. parasitica with dimethomorph (Fig. 1).
Control (CK) vs. dimethomorph-treated (HJ) GO enrichment
| Description | GeneRatioa | BgRatiob | p-value | q-value | GO ID | |
|---|---|---|---|---|---|---|
| Intrinsic component of membrane | 86 (65.65%) | 1224 (39.11%) | 0.000000 | 0.000000 | GO:0016020 | |
| Membrane | 90 (68.7%) | 1375 (43.93%) | 0.000000 | 0.000000 | GO:0044425 | |
| Cellular Component | Membrane part | 86 (65.65%) | 1298 (41.47%) | 0.000000 | 0.000000 | GO:0044425 |
| Cell periphery | 6 (4.58%) | 19 (0.61%) | 0.000083 | 0.000901 | GO:0071944 | |
| External encapsulating structure | 4 (3.05%) | 7 (0.22%) | 0.000093 | 0.000901 | GO:0030312 | |
| transporter activity | 46 (14.38%) | 548 (7.46%) | 0.000010 | 0.001469 | GO:0005215 | |
| Phosphate ion transmembrane transporter activity | 3 (0.94%) | 3 (0.04%) | 0.000082 | 0.006130 | GO:0015114 | |
| Oxidoreductase activity | 35 (10.94%) | 426 (5.8%) | 0.000191 | 0.009356 | GO:0016491 | |
| Hydrolase activity acting on glycosyl bonds | 21 (6.56%) | 207 (2.82%) | 0.000250 | 0.009356 | GO:0016798 | |
| Molecular Function | Anion transmembrane transporter activity | 12 (3.75%) | 86 (1.17%) | 0.000320 | 0.009561 | GO:0008509 |
| Tetrapyrrole binding | 10 (3.13%) | 66 (0.9%) | 0.000515 | 0.012822 | GO:0046906 | |
| Antioxidant activity | 7 (2.19%) | 35 (0.48%) | 0.000654 | 0.013975 | GO:0016209 | |
| Transmembrane transporter activity | 36 (11.25%) | 484 (6.59%) | 0.001024 | 0.019131 | GO:0022857 | |
| Organic acid transmembrane transporter activity | 8 (2.5%) | 51 (0.69%) | 0.001473 | 0.019879 | GO:0005342 | |
| Organic anion transmembrane transporter activity | 8 (2.5%) | 51 (0.69%) | 0.001473 | 0.019879 | GO:0008514 | |
| Multi-organism process | 16 (5.33%) | 66 (1.05%) | 0.000000 | 0.000011 | GO:0051704 | |
| Phosphate ion transport | 3 (1%) | 3 (0.05%) | 0.000108 | 0.01262 | GO:0006817 | |
| Single-organism process | 163 (54.33%) | 2785 (44.42%) | 0.000260 | 0.020161 | GO:0044699 | |
| Response to stress | 19 (6.33%) | 169 (2.7%) | 0.000416 | 0.024210 | GO:0006950 | |
| Biological Process | Establishment of localization | 70 (23.33%) | 1045 (16.67%) | 0.001440 | 0.044976 | GO:0051234 |
| Single-organism localization | 39 (13%) | 508 (8.1%) | 0.001908 | 0.044976 | GO:1902578 | |
| Hydrogen peroxide metabolic process | 3 (1%) | 6 (0.1%) | 0.001947 | 0.044976 | GO:0042743 | |
| Cell wall organization | 3 (1%) | 6 (0.1%) | 0.001947 | 0.044976 | GO:0071555 | |
| Single-organism transport | 38 (12.67%) | 492 (7.85%) | 0.001961 | 0.044976 | GO:0044765 | |
| Nitrate metabolic process | 2 (0.67%) | 2 (0.03%) | 0.002282 | 0.044976 | GO:0042126 |

Inter-group difference enrichment analysis GO classification chart summary under dimethomorph treatment. The abscissa is the GO term, and the ordinate is the number of differential genes up- or down-counted. The histograms are based on three categories of biological processes, cellular components, and molecular functions, as well as up-and-down classification of differential genes.
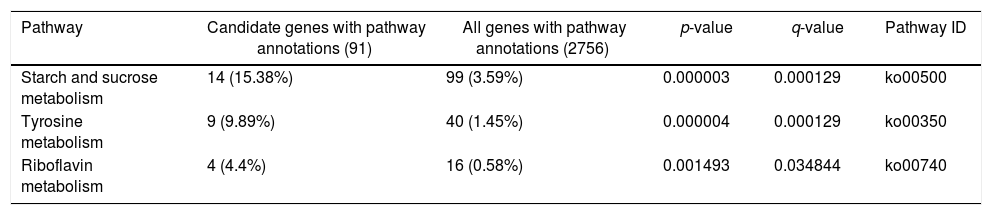
A KEGG pathway enrichment analysis was also performed to elucidate the interaction among dimethomorph-mediated pathways in stress responses. The DEGs in P.parasitica were matched to 70 different KEGG pathways. The most significantly altered pathways included starch and sucrose metabolism, tyrosine metabolism and riboflavin metabolism (Table 4, Fig. 2).
Control (CK) vs. dimethomorph-treated (HJ) pathway enrichment (the table below shows the results of the enrichment analysis of the pathway function. The meanings of the columns are similar to those of the GO function enrichment analysis)
| Pathway | Candidate genes with pathway annotations (91) | All genes with pathway annotations (2756) | p-value | q-value | Pathway ID |
|---|---|---|---|---|---|
| Starch and sucrose metabolism | 14 (15.38%) | 99 (3.59%) | 0.000003 | 0.000129 | ko00500 |
| Tyrosine metabolism | 9 (9.89%) | 40 (1.45%) | 0.000004 | 0.000129 | ko00350 |
| Riboflavin metabolism | 4 (4.4%) | 16 (0.58%) | 0.001493 | 0.034844 | ko00740 |
. The larger the Rich Factor, the higher the degree of enrichment.")
A qRT-PCR analysis was performed to validate the RNA-seq data of 11 genes (5 up-regulated and 6 down-regulated). As shown in Figure 3, the qRT-PCR data correlated well with the RNA-seq data (R2=0.7498). Overall, the qRT-PCR data showed patterns that were similar to those obtained from the RNA-seq of these genes, although the particular values of the fold-change were different.
Detection of 1-3-beta-d-glucans content, the same field of vision. The normal growth of mycelium (control), the same field of vision.")
In the determination of 1-3-beta-d-glucans using the ELISA test kit, we found that the content of 1-3-β-D glucans in P. parasitica decreased from 4.86±0.22pg/ml to 3.77±0.49pg/ml after treatment of dimethomorph (F=12.13>F crit 0.05=7.708647), The expression level of 1-3-β-D glucans changed significantly.
ROS content under different treatmentsP. parasitica ROS levels after dimethomorph treatment for 1h were much higher than those before treatment. Based on active oxygen area calculation, ROS levels increased up to 58% in response to dimethomorph treatment. In the normal growth environment, ROS levels were only 5% (Fig. 4).
Discussion with a laser scanning confocal microscope (Leica). Green lights were ROS.")
In this study, we analyzed the differential gene expression of P. parasitica after the exposure to a pesticide or under normal culture conditions. We found that 832 genes were significantly altered after the treatment with the acid morpholine, including 365 genes that were up-regulated and 467 genes that were down-regulated. Notably, GO and KEGG analyses of DEGs revealed significant differences, indicating that CAA has an impact on pathogens.
The effects of dimethomorph were systemic. Dimethomorph affects the formation of cellular and organelle membranes (the intrinsic components of the membranes, membrane parts), cell ion transport and transport protein formation (transporter activity, phosphate ion transmembrane transporter activity, phosphate ion transport) and affects the transport of exogenous substances (multi-organism process, single-organism process, oxidoreductase activity)4,14.
The cell wall and cell membrane are targeted by the CAA treatmentIn this report, the RNA-seq results showed an altered expression of certain key genes in the cell membranes and cell walls that were strongly affected by dimethomorph. According to previous studies, the oomycete cell wall consists mainly of 1-3-β-D glucans and certain 1-4-β-D glucans and 1-6-β-D glucans7,17.
The results of RNA-seq show that dimethomorph affects the synthesis of sugars involved in cell wall formation and the synthesis of cell membrane-associated proteins. Expression of 1,3-beta-glucan synthase (K00706), pectin esterase (K01051), glucan 1,3-beta-glucosidase (K01210) and beta-d-xyloidine 4 (K15920) was reduced (Supplementary Table 3, Supplementary Fig. 1). By the ELISA experiment, it was demonstrated that the treatment of dimethomorph had an effect on the formation of cell walls.
The cell wall structure is highly dynamic. The shape of the cell is strongly influenced by plasticity of the cell wall. Upon deposition, the cell wall polymers are integrated into existing structures and undergo extensive remodeling during cell expansion. These modifications involve a wide array of cell wall-modifying enzymes, such as the expansins, endoglucanases, polygalacturonases, peroxidases and various glycosidases that are localized to the cell wall or anchored in the plasma membrane of the cells. Several of these proteins have been identified in the cell walls of oomycetes3,14.
Change in cell membrane structure and permeabilityThe fluid mosaic model is a hypothesis model of membrane structure. In this model, the proteins integral to the membrane include a heterogeneous set of globular molecules, each of which is arranged in an amphipathic structure with the ionic and highly polar groups protruding from the membrane into the aqueous phase and the nonpolar groups largely buried in the hydrophobic interior of the membrane20. Therefore, the structure and transport function of cell membranes are related to membrane proteins. Using RNA-seq, we showed changes in expression levels of several cell membrane structural proteins and transport-related proteins.
We obtained three cell membranes GO term through GO enrichment analysis, “membrane” (GO:0016020), “intrinsic component of membrane” (GO:0031224), and “external encapsulating structure” (GO:0030312). The last (GO: 0030312) is a term at a most detailed level, indicating that dimethomorph may affect cell membrane structural proteins (Supplementary Fig. 2).
The change in protein transport and transmembrane transport was that “proteins related to phosphate transport” were involved in “phosphate ion transmembrane transporter activity” (GO:0015114), “anion transmembrane transporter activity” (GO:0008509), “transmembrane transporter activity” (GO:0022857), “organic acid transmembrane transporter activity” (GO:0005342), and “organic anion transmembrane transporter activity” (GO:0008514). These changes affect the transport function of the cell membrane (Supplementary Fig. 3).
Increased reactive oxygen contentThe production of reactive oxygen species (ROS) is an unavoidable consequence of aerobic metabolism. ROS include free radicals, such as superoxide anion (O2•−) and hydroxyl radical (•OH), and non-radical molecules, such as hydrogen peroxide (H2O2) and singlet oxygen (O2). The stepwise reduction in molecular oxygen (O2) due to high-energy exposure or electron-transfer reactions leads to the production of ROS19. Environmental stresses, such as drought, salinity, chilling, metal toxicity, UV-B radiation, and pathogen attacks, lead to the enhanced generation of ROS due to the disruption of cellular homeostasis18,22. All ROS are extremely harmful to organisms at high concentrations. When the level of ROS exceeds the defence mechanisms, a cell is considered in a state of “oxidative stress.” The enhanced production of ROS during environmental stress can pose a threat to cells by causing peroxidation of lipids, oxidation of proteins, damage to nucleic acids, enzyme inhibition, and activation of programmed cell death (PCD) pathway, ultimately leading to the death of cells16,23.
Dimethomorph is a type of environmental stress that can cause damage to the cell membrane. These injuries may substantially increase ROS. The oxidoreductase activity (GO:0016491), antioxidant activity (GO:0016209), and hydrogen peroxide metabolic processes (GO:0042743) were reduced, and all three ways reduced the control of ROS reduction. According to our experiments, dimethomorph treatment induced significant accumulation of ROS, which may cause apoptosis of P. parasitica.
ConclusionsIn summary, we reported the effects of dimethomorph on P. parasitica using a dataset generated by de novo assembly of next generation sequencing data. These findings are valuable resources for future P. parasitica genomic studies and will also benefit researchers who study other closely related species of significant agricultural importance. The differentially expressed gene dataset will also provide useful candidate genes for the functional analysis of dimethomorph for the control of P. parasitica.
Conflict of interestThe authors declare that they have no conflicts of interest.
The following are the supplementary data to this article:
