


The use of a Neubauer chamber is a broadly employed method when cell suspensions need to be quantified. However, this technique may take a long time and needs trained personnel. Spectrophotometry has proved to be a rapid, simple and accurate method to estimate the concentration of spore suspensions of isolates of the genus Fusarium. In this work we present a linear formula to relate absorbance measurements at 530nm with the number of microconidia/ml in a suspension.
La cámara de Neubauer es un método ampliamente utilizado para cuantificar suspensiones de esporas. Sin embargo, esta técnica requiere personal entrenado y un tiempo considerable. La espectrofotometría demostró ser un método rápido, simple y preciso para estimar la concentración de esporas de aislados del género Fusarium. En este artículo breve presentamos una fórmula lineal ajustada para relacionar la absorbancia a 530nm con el número de conidios en suspensiones utilizadas en pruebas fitopatológicas.
Cell counting is a usual task in plant pathology labs, because the need to quantify spore concentration is a basic requirement for many different assays, including resistance screening tests. It is also essential as a way of standardizing lab results allowing comparisons and repeatability. Although sophisticated equipment is currently available, they often represent high initial prices and expensive operation costs, especially for small laboratories. Therefore, the use of the hemocytometer or Neubauer chamber is still a widespread technique for adjusting cell suspensions. This method has many advantages, such as low cost and cell color/size independence,6 however, it may take a long time and carry considerable mistakes in the concentration estimation.7 Hence, the use of spectrophotometry as the measurement of absorbance of a suspension has proved to be a more rapid and simple method for quantifying conidia concentration. Some articles have mentioned the use of spectrophotometry for spore counting in Fusarium spp. pathogenic for humans;4,6 however, there are no currently available publications for the use of this technique in plant pathogenic Fusaria. In the present work we describe a simple laboratory procedure for estimating the concentration of Fusarium spp. suspensions by spectrophotometry.
For the development of the method, we used five onion pathogenic isolates of Fusarium spp. The isolates belong to three different species (F. oxysporum, F. proliferatum and F. verticillioides) and were initially obtained from rotten onion bulbs. The conidial suspensions were prepared as follows: mycelium was collected from ten-day old colonies grown on potato-dextrose agar with a scalpel and suspended in a sterile agar-distilled water solution (500mg agar per liter). Suspensions were then filtered through sterilized cotton filters to obtain pure conidial suspensions. From these initial suspensions, serial dilutions were prepared (9 dilutions per isolate, 45 total samples) and quantified by using a hemocytometer. At the same time, the absorbance at 530nm6 was measured for every sample using a spectrophotometer Spectronic 20D (Milton Roy, Rochester, NY). The presence of agar conferred stability to the suspension, avoiding conidia decantation7 and allowing accurate quantification. Between every measurement, the absorbance data were checked and eventually blanked with sterile agar-water solution as reference blank. Data obtained with both methods were compared by regression analysis using InfoStat.2 Figures were created using Microsoft Office Excel.
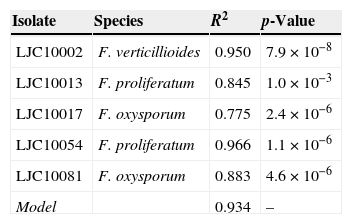
Absorbance data ranged from 0 to 0.532 in accordance with the concentrations measured in the hemocytometer, which fluctuated between 45,000 and 6,125,000 conidia/ml. Only microconidia were observed during cell counting in the hemocytometer, since chlamydospores, macroconidia and hyphae were retained by the cotton filter. Absorbance values exceeding 0.400 (two samples) were not included in the statistical analysis because of their lack of linearity and due to the fact that those high conidial concentrations are rarely used in plant pathology tests. High correlation values between absorbance and spore concentration were found for each isolate and are shown in Table 1. The regression analysis of the complete data fitted to the linear model displayed in Fig. 1 (Concentration=β0+β1×Absorbance). The corresponding estimated parameters were β0=−100,439 and β1=20,080,760, with a high total R2 value (0.934). Individual R2 values were calculated for every different isolate in order to check the goodness of fit for the adjusted linear model and their R2 values were all acceptable (Table 1).
Isolates of Fusarium spp. used in this study and their regression coefficients.
| Isolate | Species | R2 | p-Value |
|---|---|---|---|
| LJC10002 | F. verticillioides | 0.950 | 7.9×10⁻⁸ |
| LJC10013 | F. proliferatum | 0.845 | 1.0×10⁻³ |
| LJC10017 | F. oxysporum | 0.775 | 2.4×10⁻⁶ |
| LJC10054 | F. proliferatum | 0.966 | 1.1×10⁻⁶ |
| LJC10081 | F. oxysporum | 0.883 | 4.6×10⁻⁶ |
| Model | 0.934 | – |
Isolates belong to WDCM904 ‘Colección de Fitopatógenos de Cultivos Hortícolas’, EEA La Consulta INTA, Mendoza, Argentina (acronym ‘LJC’).

Aberkane et al.1 state that the spectrophotometric method needs to be adjusted for every different fungal species, due to variability in spore color and size. In our study we used isolates from three different species of the genus Fusarium, which had been previously characterized (data not shown). It was found that the difference in size of their microconidia was not significant, therefore, not influencing the spectrophotometric measurements, which was confirmed by the uniform distribution of the points in Fig. 1 and the high individual R2 values in Table 1. Although every isolate conferred different colors to the suspensions, these colors did not affect the adjustment of individual data to the model, in accordance with Lage et al.5
Spectrophotometry has been reported as a quick, simple and familiar method to most lab personnel.3 The results allow to conclude that the use of this technique is also an accurate and rapid method for quantification of Fusarium conidial suspensions.
Ethical disclosuresProtection of human and animal subjectsThe authors declare that no experiments were performed on humans or animals for this study.
Confidentiality of dataThe authors declare that no patient data appear in this article.
Right to privacy and informed consentThe authors declare that no patient data appear in this article.
FundingThis work was supported with financial funds of the Instituto Nacional de Tecnología Agropecuaria INTA EEA La Consulta and Programa Nacional Hortalizas, Flores y Aromáticas PNHFA 1106072, Argentina.
Conflicts of interestThe authors declare that they have no conflicts of interest.
.
