


Novel coronavirus disease 2019 (COVID-19) is an emerging infectious disease caused by SARS-CoV-2. At the peak of the outbreak in Wuhan (January and February), there are two types of COVID-19 patients: laboratory confirmation and clinical diagnosis. This study aims to compare and analyze the clinical outcomes and characteristics of confirmed and clinically diagnosed COVID-19 patients to determine whether they are of the same type and require equal treatment. More importantly, the prognostic factors of COVID-19 patients are explored.
MethodsA total of 194 hospitalized patients with COVID-19 pneumonia were retrospectively studied. Demographic data, clinical characteristcs, laboratory results and prognostic information were collected by electronic medical record system and analyzed.
ResultsAmong 194 subjects included, 173 were confirmed and 21 were clinically diagnosed. There were no significant differences in clinical outcomes (mortality rate 39[22.54%] vs 7[33.33%], P=0.272) and hospital stay (19.00 vs 16.90 days, P=0.411) between the confirmed and clinically diagnosed group, and prognostic factors were similar between them. Older age, lower albumin levels, higher serum Lactate dehydrogenase (LDH) levels, higher D-D levels, longer prothrombin time (PT), higher IL-6 levels, lower T cells indicated poor prognosis in patients with COVID-19 pneumonia. NK cell has the highest AUC among all measured indicators (NK AUC=0.926, P<0.001).
ConclusionLaboratory-confirmed and clinically diagnosed COVID-19 patients are similar in clinical outcomes and most clinical characteristics. They are of the same type and require equal treatment. Age, AST, LDH, BUN, PT, D-D, IL6, white blood cell and neutrophil counts, T cell and T cell subset counts can efficiently predict clinical outcomes.
El nuevo coronavirus 2019 (COVID-19) es una nueva enfermedad infecciosa causada por el virus SARS-CoV-2. Durante el pico del brote en Wuhan (enero y febrero 2020), se detectaron dos tipos de pacientes portadores del COVID-19: pacientes confirmados a través de pruebas de laboratorio y pacientes confirmados por diagnóstico clínico. El objetivo de este estudio es comparar y analizar los resultados clínicos y las características de los pacientes con COVID-19 confirmados y clínicamente diagnosticados para determinar si son del mismo tipo y si necesitan el mismo tratamiento. El estudio es importante también para explorar los factores pronósticos de los pacientes con COVID-19.
MétodosUn total de 194 pacientes hospitalizados con neumonía COVID-19 fueron estudiados retrospectivamente. Se utilizó un sistema de registro médico electrónico para recopilar los datos demográficos, las características clínicas, los resultados de laboratorio y la información pronóstica, para luego ser analizada.
ResultadosDe los 194 pacientes incluidos, 173 dieron positivo y 21 fueron diagnosticados clínicamente. No se presentaron diferencias significativas en los resultados clínicos (tasa de mortalidad 39 [22,54%] vs. 7 [33,33%], p = 0,272) y la estancia hospitalaria (19,00 vs. 16,90 días, p = 0,411) entre el grupo de confirmados y el grupo diagnosticado clínicamente, y los factores pronósticos fueron similares entre ellos. Edad avanzada, niveles más bajos de albúmina, niveles más altos de lactato deshidrogenasa (LDH) en suero, niveles más altos de D-D, mayor tiempo de protrombina (PT), altos niveles de IL-6, células T más bajas indicaban mal pronóstico en pacientes con neumonía por COVID-19. La célula NK tiene el AUC más alto entre todos los indicadores medidos (NK AUC = 0,926, p < 0,001).
ConclusiónLos grupos de pacientes COVID-19 confirmados en laboratorio y diagnosticados clínicamente arrojan resultados clínicos similares y tienen la mayoría de las características clínicas. Son del mismo tipo y requieren el mismo tratamiento. La edad, AST, LDH, BUN, PT, D-D, IL6, los recuentos de glóbulos blancos y neutrófilos, recuentos de subgrupos de células T y células T pueden predecir los resultados clínicos de forma eficaz.
The outbreak of the novel coronavirus, severe acute respiratory syndrome coronavirus
2 (SARS-CoV-2), that first emerged in Wuhan in December 2019, has rapidly spread throughout China in the past two months.1,2 At present, a global epidemic has been formed. As of March 31, 2020, the World Health Organization announced 719,758 confirmed cases of COVID-19 pneumonia and 33,673 deaths worldwide.3
At the peak of the outbreak in Wuhan (January and February), There are two types of COVID-19 patients: laboratory confirmation and clinical diagnosis. This was because the positive rate of nucleic acid test was low and antibody test was not mature. Some patients were diagnosed with COVID-19 mainly by imaging (lung CT) and exposure history, until death or discharge was not confirmed. Currently, there have been numerous studies on the epidemiology, toxicology, diagnosis, treatment and prognosis of COVID-19.1,4–8 Studies have reported that elderly people with multiple underlying diseases are more likely to be infected and have a worse prognosis.2,7,9 Cytokine storms, lymphocyte subset counts, and hyperviremia are important predictors of disease progression and poor prognosis.10,11 However, comparative studies on confirmed and clinically diagnosed cases are currently limited. This study aims to compare and analyze the clinical outcomes and characteristics of confirmed and clinically diagnosed COVID-19 patients to determine whether they are of the same type and require equal treatment. More importantly, the prognostic factors and predictive value of COVID-19 patients are explored.
MethodsEthical approvalThis study was approved by the Institutional Ethics Board of tongji Hospital, Tongji Medical College, Huazhong University of Science and Technology (IRB ID: TJ- IRB20200343), and all relevant personnel exempt from informed consent due to the particularity of the disease outbreak.
Study design and participantsPrior to the design of this study, scientific research cooperation was requested with relevant departments. We retrospectively recruited totally 194 patients between February 5, 2020 and March 11, 2020 in four wards of Tongji hospital, the largest comprehensive medical treatment center of the central China and “the specific hospital for the treatment of severe patients with COVID-19 in Wuhan” designated by the government. Among them, 173 were confirmed patients and 21 were clinically diagnosed patients. Confirmation criteria: 1). positive throat swab nucleic acid test by Real-time fluorescent RT-PCR detection of new coronavirus nucleic or positive in specific antibodies; 2). clinical manifestations of fever and/or respiratory symptoms; 3). chest radiographic evidence of viral pneumonia. Clinical diagnostic criteria: 1). epidemiological contact history; 2). clinical manifestations of fever and/or respiratory symptoms; 3). chest radiographic evidence of viral pneumonia; 4). nucleic acid test negative and specific antibody test negative till March 11, 2020; 5). negative for influenza virus antibodies. Demographic data, clinical characteristcs, laboratory results and prognostic information were collected by tracking and inquiring the electronic medical record system, then the data were compared and analyzed. In the prognosis analysis, patients who were discharged from hospital and those who were hospitalized were included in survival group, and those who died were divided into died group. The discharge criteria are defined as: 1). The body temperature returns to normal for 3 days; 2). Respiratory symptoms improved significantly; 3). Pulmonary imaging shows a marked improvement in acute exudative lesions; 4). Negative nucleic acid test of sputum, nasopharyngeal swabs and other respiratory specimens for two consecutive times (sampling interval at least 24hours).
Data CollectionData entry and management was handled by a trained team of physicians and medical graduates. Clinical, laboratory, radiological results and prognostic information were collected from electronic medical records. Date was obtained with standardized forms for all subjects involved. Laboratory results included blood routine, blood biochemistry, infection-related markers (such as cytokines, procalcitonin, etc.), and lymphocyte subsets.
Statistical analysisDescriptive analyses of the continuous variables were expressed as mean or median with interquartile range (IQR). Categorical variables were described as frequency rates and percentages. Differences in continuous variables were analyzed using t tests when normalized distributed, otherwise the Mann-Whitney test. Categorical variables were compared using the χ2 test. The Fisher exact test was used when the data were limited. Multiple logistic regression was used to evaluate the independent prognostic factors. The ROC curve was used to analyze the predictive factors and the area under the ROC curve (AUC) was calculated. AUC>0.75 was deemed as having a good prognostic value. Sample size varied because of missing data. The analyses regarding different factors were based on non-missing data, and missing data were not imputed. Time to events (death) were defined as the time from hospital admission to events. All statistical analyses were performed with SPSS, version 23.0 (IBM SPSS). A 2-sided α of less than 0·05 was considered statistically significant.
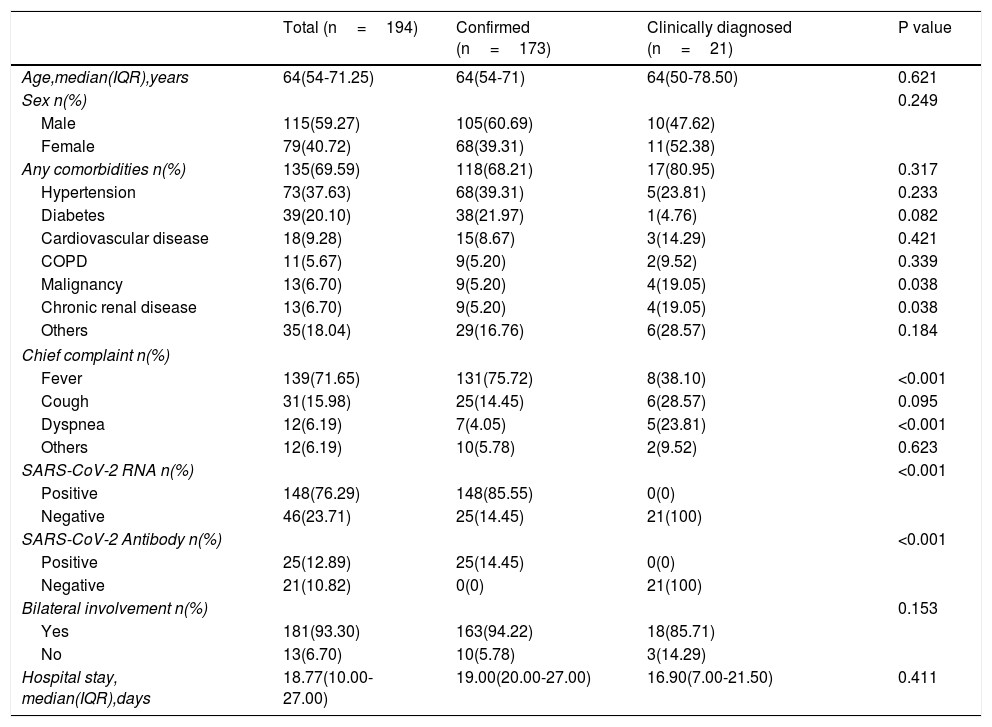
ResultsDemographics and CharacteristicsA total of 194 patients were included in this study (Table 1), including 173 confirmed cases and 21 clinically diagnosed cases. There were 115 males and 79 females with a median age of 64 years (IQR, 54.00-71.25). 135 (69.59%) patients had comorbidities, including hypertension (n=73[37.63%]), diabetes (n=39[20.10%], cardiovascular disease (n=18[9.28%]), COPD (n=11[5.67%]), malignancy (n=13[6.70%]), chronic renal disease (n=13[6.7%]) and others. Compared with the confirmed group, there were more patients with clinical history of malignant tumors and chronic renal failure in clinically diagnosed group (19.05% vs 5.20%, P=0.038; 19.05% vs 5.20%, P=0.038). The chief complaints were fever (n=139[71.65.7%]), cough (n=31[15.98%]), dyspnea (n=12[6.19%]) and other uncommon symptoms (n=12[6.19%]), such as gastrointestinal symptoms including diarrhea, nausea. Of 194 patients, 148(76.29%) cases were positive for nucleic acid detection, 25(12.89%) cases were positive for SARS-CoV-2 antibody, and 181(93.30%) patients were detected bilateral involvement in chest CT or X-ray images. The median hospitalized duration was 18.77 (10.0-27.0) days. There were no significant differences in the gender, age, hypertension, diabetes, and length of hospital stay between the confirmed and clinically diagnosed groups.
Baseline characteristics of patients included in the study.
| Total (n=194) | Confirmed (n=173) | Clinically diagnosed (n=21) | P value | |
|---|---|---|---|---|
| Age,median(IQR),years | 64(54-71.25) | 64(54-71) | 64(50-78.50) | 0.621 |
| Sex n(%) | 0.249 | |||
| Male | 115(59.27) | 105(60.69) | 10(47.62) | |
| Female | 79(40.72) | 68(39.31) | 11(52.38) | |
| Any comorbidities n(%) | 135(69.59) | 118(68.21) | 17(80.95) | 0.317 |
| Hypertension | 73(37.63) | 68(39.31) | 5(23.81) | 0.233 |
| Diabetes | 39(20.10) | 38(21.97) | 1(4.76) | 0.082 |
| Cardiovascular disease | 18(9.28) | 15(8.67) | 3(14.29) | 0.421 |
| COPD | 11(5.67) | 9(5.20) | 2(9.52) | 0.339 |
| Malignancy | 13(6.70) | 9(5.20) | 4(19.05) | 0.038 |
| Chronic renal disease | 13(6.70) | 9(5.20) | 4(19.05) | 0.038 |
| Others | 35(18.04) | 29(16.76) | 6(28.57) | 0.184 |
| Chief complaint n(%) | ||||
| Fever | 139(71.65) | 131(75.72) | 8(38.10) | <0.001 |
| Cough | 31(15.98) | 25(14.45) | 6(28.57) | 0.095 |
| Dyspnea | 12(6.19) | 7(4.05) | 5(23.81) | <0.001 |
| Others | 12(6.19) | 10(5.78) | 2(9.52) | 0.623 |
| SARS-CoV-2 RNA n(%) | <0.001 | |||
| Positive | 148(76.29) | 148(85.55) | 0(0) | |
| Negative | 46(23.71) | 25(14.45) | 21(100) | |
| SARS-CoV-2 Antibody n(%) | <0.001 | |||
| Positive | 25(12.89) | 25(14.45) | 0(0) | |
| Negative | 21(10.82) | 0(0) | 21(100) | |
| Bilateral involvement n(%) | 0.153 | |||
| Yes | 181(93.30) | 163(94.22) | 18(85.71) | |
| No | 13(6.70) | 10(5.78) | 3(14.29) | |
| Hospital stay, median(IQR),days | 18.77(10.00-27.00) | 19.00(20.00-27.00) | 16.90(7.00-21.50) | 0.411 |
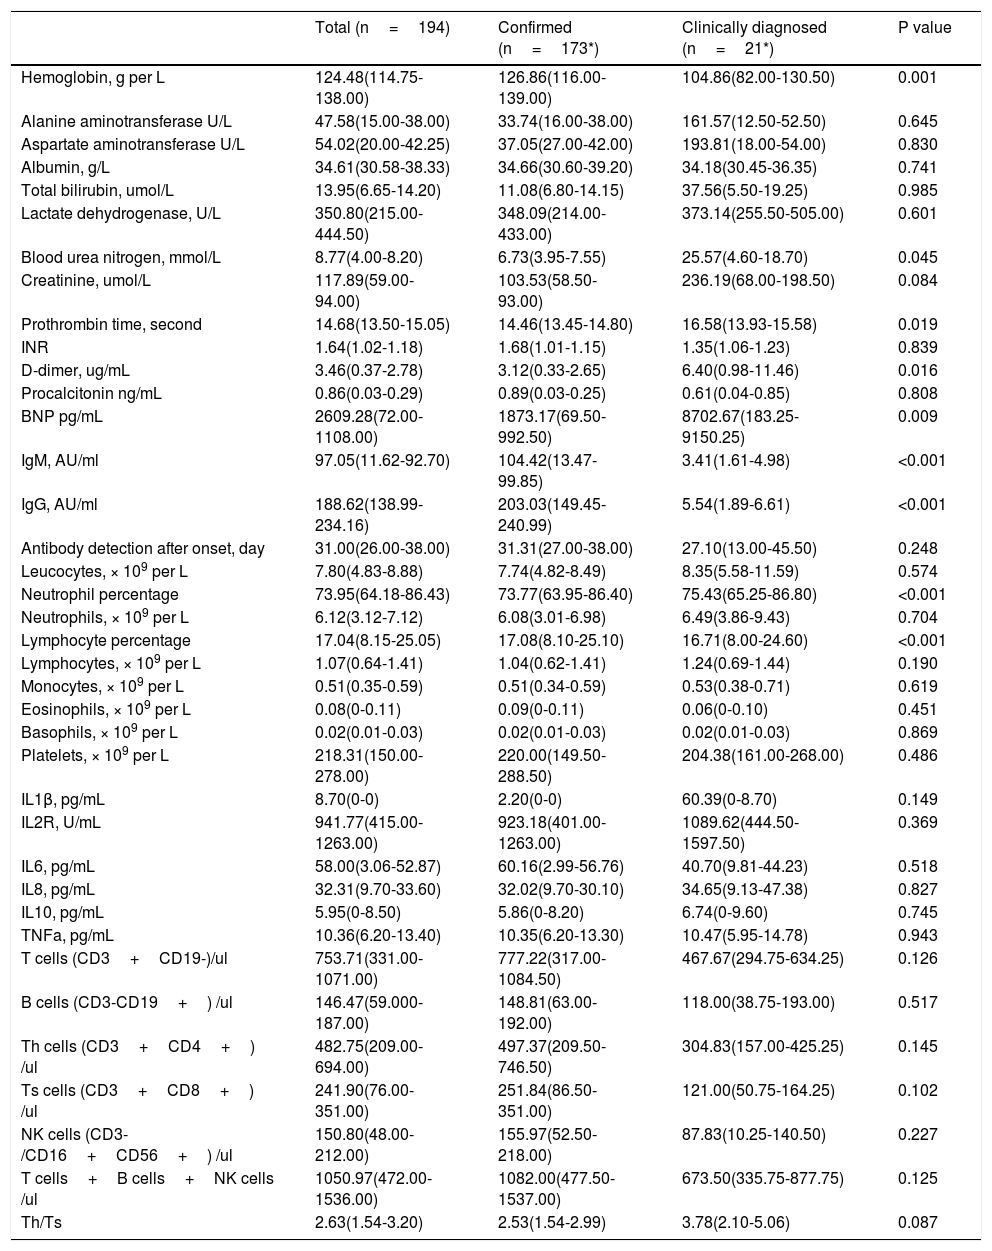
Table 2 presents the laboratory findings in patients. Of 194 patients who underwent laboratory examinations on admission, there were no differences in blood cell counts, infection related biomarkers, lymphocyte subsets between confirmed and clinically diagnosed group. But, clinically diagnosed cases tend to have higher blood urea nitrogen (25.57 vs 6.73 mmol/L, P=0.045), D-dimer (6.40 vs 3.12 ug/mL, P=0.016), BNP (8702.67 vs 1873.17 pg/mL, P=0.009), longer prothrombin time (16.58 vs 14.46seconds, P=0.019). Compared with confirmed group, clinically diagnosed cases demonstrated reduced levels of hemoglobin (104.86 vs 126.86g/L, P<0.001), IgM (3.41 vs 104.42 AU/ml, P<0.001), and IgG (5.54 vs 203.03 AU/ml, P<0.001).
Laboratory findings of patients with COVID-19 pneumonia.
| Total (n=194) | Confirmed (n=173*) | Clinically diagnosed (n=21*) | P value | |
|---|---|---|---|---|
| Hemoglobin, g per L | 124.48(114.75-138.00) | 126.86(116.00-139.00) | 104.86(82.00-130.50) | 0.001 |
| Alanine aminotransferase U/L | 47.58(15.00-38.00) | 33.74(16.00-38.00) | 161.57(12.50-52.50) | 0.645 |
| Aspartate aminotransferase U/L | 54.02(20.00-42.25) | 37.05(27.00-42.00) | 193.81(18.00-54.00) | 0.830 |
| Albumin, g/L | 34.61(30.58-38.33) | 34.66(30.60-39.20) | 34.18(30.45-36.35) | 0.741 |
| Total bilirubin, umol/L | 13.95(6.65-14.20) | 11.08(6.80-14.15) | 37.56(5.50-19.25) | 0.985 |
| Lactate dehydrogenase, U/L | 350.80(215.00-444.50) | 348.09(214.00-433.00) | 373.14(255.50-505.00) | 0.601 |
| Blood urea nitrogen, mmol/L | 8.77(4.00-8.20) | 6.73(3.95-7.55) | 25.57(4.60-18.70) | 0.045 |
| Creatinine, umol/L | 117.89(59.00-94.00) | 103.53(58.50-93.00) | 236.19(68.00-198.50) | 0.084 |
| Prothrombin time, second | 14.68(13.50-15.05) | 14.46(13.45-14.80) | 16.58(13.93-15.58) | 0.019 |
| INR | 1.64(1.02-1.18) | 1.68(1.01-1.15) | 1.35(1.06-1.23) | 0.839 |
| D-dimer, ug/mL | 3.46(0.37-2.78) | 3.12(0.33-2.65) | 6.40(0.98-11.46) | 0.016 |
| Procalcitonin ng/mL | 0.86(0.03-0.29) | 0.89(0.03-0.25) | 0.61(0.04-0.85) | 0.808 |
| BNP pg/mL | 2609.28(72.00-1108.00) | 1873.17(69.50-992.50) | 8702.67(183.25-9150.25) | 0.009 |
| IgM, AU/ml | 97.05(11.62-92.70) | 104.42(13.47-99.85) | 3.41(1.61-4.98) | <0.001 |
| IgG, AU/ml | 188.62(138.99-234.16) | 203.03(149.45-240.99) | 5.54(1.89-6.61) | <0.001 |
| Antibody detection after onset, day | 31.00(26.00-38.00) | 31.31(27.00-38.00) | 27.10(13.00-45.50) | 0.248 |
| Leucocytes, × 109 per L | 7.80(4.83-8.88) | 7.74(4.82-8.49) | 8.35(5.58-11.59) | 0.574 |
| Neutrophil percentage | 73.95(64.18-86.43) | 73.77(63.95-86.40) | 75.43(65.25-86.80) | <0.001 |
| Neutrophils, × 109 per L | 6.12(3.12-7.12) | 6.08(3.01-6.98) | 6.49(3.86-9.43) | 0.704 |
| Lymphocyte percentage | 17.04(8.15-25.05) | 17.08(8.10-25.10) | 16.71(8.00-24.60) | <0.001 |
| Lymphocytes, × 109 per L | 1.07(0.64-1.41) | 1.04(0.62-1.41) | 1.24(0.69-1.44) | 0.190 |
| Monocytes, × 109 per L | 0.51(0.35-0.59) | 0.51(0.34-0.59) | 0.53(0.38-0.71) | 0.619 |
| Eosinophils, × 109 per L | 0.08(0-0.11) | 0.09(0-0.11) | 0.06(0-0.10) | 0.451 |
| Basophils, × 109 per L | 0.02(0.01-0.03) | 0.02(0.01-0.03) | 0.02(0.01-0.03) | 0.869 |
| Platelets, × 109 per L | 218.31(150.00-278.00) | 220.00(149.50-288.50) | 204.38(161.00-268.00) | 0.486 |
| IL1β, pg/mL | 8.70(0-0) | 2.20(0-0) | 60.39(0-8.70) | 0.149 |
| IL2R, U/mL | 941.77(415.00-1263.00) | 923.18(401.00-1263.00) | 1089.62(444.50-1597.50) | 0.369 |
| IL6, pg/mL | 58.00(3.06-52.87) | 60.16(2.99-56.76) | 40.70(9.81-44.23) | 0.518 |
| IL8, pg/mL | 32.31(9.70-33.60) | 32.02(9.70-30.10) | 34.65(9.13-47.38) | 0.827 |
| IL10, pg/mL | 5.95(0-8.50) | 5.86(0-8.20) | 6.74(0-9.60) | 0.745 |
| TNFa, pg/mL | 10.36(6.20-13.40) | 10.35(6.20-13.30) | 10.47(5.95-14.78) | 0.943 |
| T cells (CD3+CD19-)/ul | 753.71(331.00-1071.00) | 777.22(317.00-1084.50) | 467.67(294.75-634.25) | 0.126 |
| B cells (CD3-CD19+) /ul | 146.47(59.000-187.00) | 148.81(63.00-192.00) | 118.00(38.75-193.00) | 0.517 |
| Th cells (CD3+CD4+) /ul | 482.75(209.00-694.00) | 497.37(209.50-746.50) | 304.83(157.00-425.25) | 0.145 |
| Ts cells (CD3+CD8+) /ul | 241.90(76.00-351.00) | 251.84(86.50-351.00) | 121.00(50.75-164.25) | 0.102 |
| NK cells (CD3-/CD16+CD56+) /ul | 150.80(48.00-212.00) | 155.97(52.50-218.00) | 87.83(10.25-140.50) | 0.227 |
| T cells+B cells+NK cells /ul | 1050.97(472.00-1536.00) | 1082.00(477.50-1537.00) | 673.50(335.75-877.75) | 0.125 |
| Th/Ts | 2.63(1.54-3.20) | 2.53(1.54-2.99) | 3.78(2.10-5.06) | 0.087 |
lymphocyte subsets were tested in 85 patients (79 confirmed, 6 Clinically diagnosed).
Data are mean (IQR), where N is the total number of patients with available data. p values comparing Confirmed and Clinically diagnosed cases are from T test, or Mann-Whitney U test. COIVD19=coronavirus disease 2019. INR,International standardized ratio,NK cells=natural killer cells, Th cells=helper T cells, Ts cells=suppressor T cells.
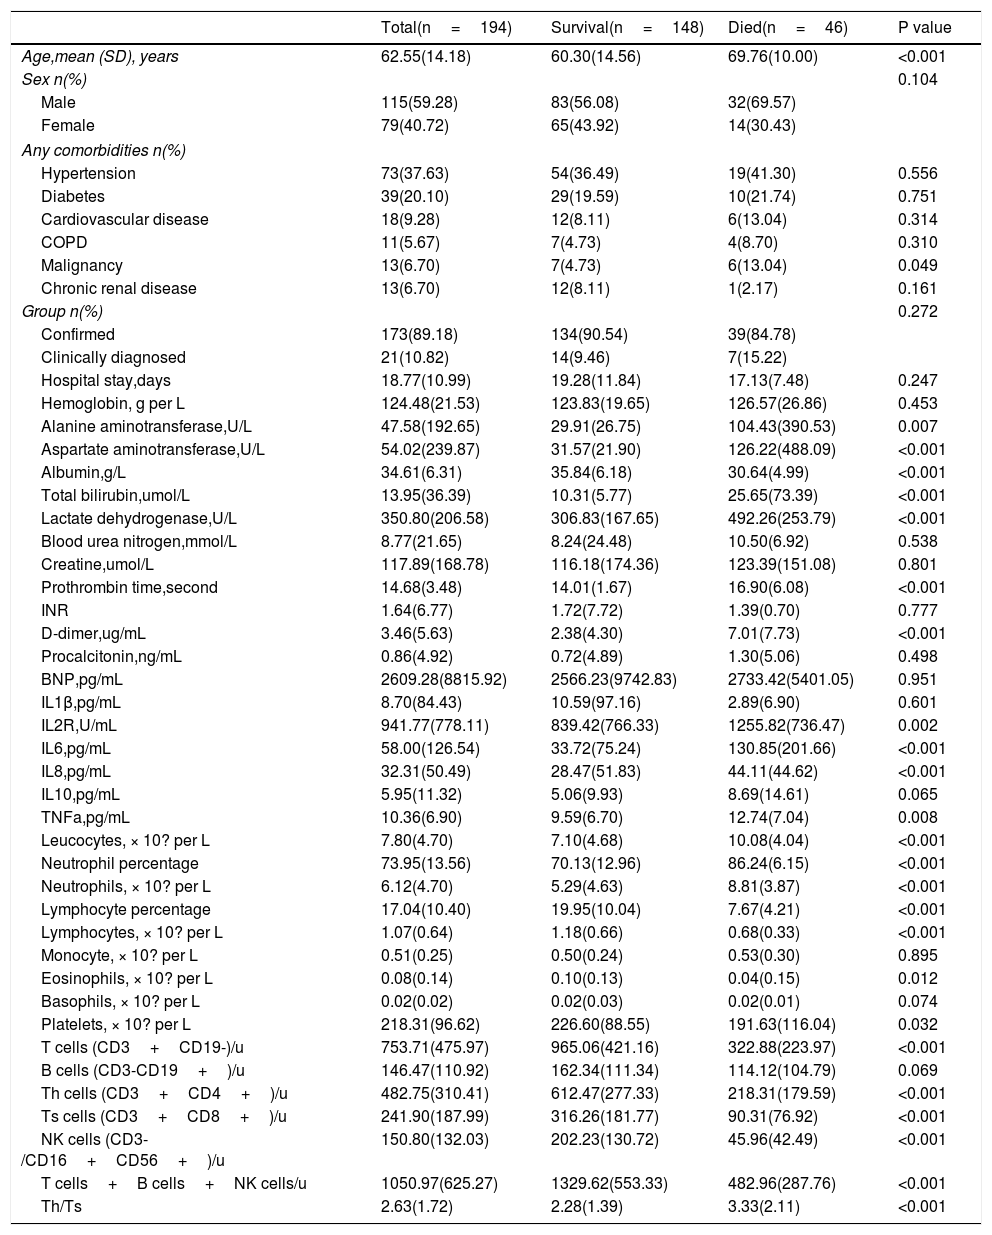
In this study, patients who were discharged from hospital or were still hospitalized were divided into one group (survival), and deaths were treated as another group (died). As shown in Table 3, 46 of the 194 patients died, 39 in the confirmed group and 7 in the clinically diagnosed group. There were no differences in clinical endpoints between the confirmed and clinically diagnosed groups (39[22.54%] vs 7[33.33%], P=0.272). People who died were significantly older (69.76 years [SD 10.00] vs 60.30 years [SD 14.56], P<0.001), more likely to have malignancies (6[13.04%] vs 7[4.73%], P=0.049), while other variables (i.e. gender, hypertension, diabetes, cardiovascular disease, COPD, chronic renal disease, hospital stay) were similar between two groups. Died patients had significant elevated leucocyte count and neutrophil count, but decreased lymphocyte counts on admission than the survival patients (leucocytes 10.08 vs 7.10 ×10? per L, P<0.001; neutrophils 8.81 vs 5.29 ×10? per L, P<0·001; lymphocytes 0.68 vs 1.18 ×10? per L, P<0·001). Consist with that, most lymphocyte subsets (T cells, Th cells, Ts cells, NK cells) detected by flow cytometry were significantly higher in survivors than in died cases (P<0.001 for all). Serum albumin level was lower in died patients than survival patients (albumin 30.64 vs 35.84g/L, P<0.001), while serum total bilirubin, lactate dehydrogenase,alanine aminotransferase and aspartate aminotransferase level was higher in died patients than survival patients (T-Bil 25.65 vs 10.31 umol/L, P<0.001; LDH 494.26 vs 306.83 U/L, P<0.001;ALT 104.43 vs 29.91 U/L, P<0.001;AST 193.81 vs 37.05 U/L, P<0.001), indicating hepatic dysfunction in more patients of died group. Prothrombin time and D-dimer level were higher in died group than survival group (PT 16.90 vs 14.01seconds, P<0.001; D-D 7.01 vs 2.38mg/L, P<0.001).
Comparison of related parameters between survival and died group.
| Total(n=194) | Survival(n=148) | Died(n=46) | P value | |
|---|---|---|---|---|
| Age,mean (SD), years | 62.55(14.18) | 60.30(14.56) | 69.76(10.00) | <0.001 |
| Sex n(%) | 0.104 | |||
| Male | 115(59.28) | 83(56.08) | 32(69.57) | |
| Female | 79(40.72) | 65(43.92) | 14(30.43) | |
| Any comorbidities n(%) | ||||
| Hypertension | 73(37.63) | 54(36.49) | 19(41.30) | 0.556 |
| Diabetes | 39(20.10) | 29(19.59) | 10(21.74) | 0.751 |
| Cardiovascular disease | 18(9.28) | 12(8.11) | 6(13.04) | 0.314 |
| COPD | 11(5.67) | 7(4.73) | 4(8.70) | 0.310 |
| Malignancy | 13(6.70) | 7(4.73) | 6(13.04) | 0.049 |
| Chronic renal disease | 13(6.70) | 12(8.11) | 1(2.17) | 0.161 |
| Group n(%) | 0.272 | |||
| Confirmed | 173(89.18) | 134(90.54) | 39(84.78) | |
| Clinically diagnosed | 21(10.82) | 14(9.46) | 7(15.22) | |
| Hospital stay,days | 18.77(10.99) | 19.28(11.84) | 17.13(7.48) | 0.247 |
| Hemoglobin, g per L | 124.48(21.53) | 123.83(19.65) | 126.57(26.86) | 0.453 |
| Alanine aminotransferase,U/L | 47.58(192.65) | 29.91(26.75) | 104.43(390.53) | 0.007 |
| Aspartate aminotransferase,U/L | 54.02(239.87) | 31.57(21.90) | 126.22(488.09) | <0.001 |
| Albumin,g/L | 34.61(6.31) | 35.84(6.18) | 30.64(4.99) | <0.001 |
| Total bilirubin,umol/L | 13.95(36.39) | 10.31(5.77) | 25.65(73.39) | <0.001 |
| Lactate dehydrogenase,U/L | 350.80(206.58) | 306.83(167.65) | 492.26(253.79) | <0.001 |
| Blood urea nitrogen,mmol/L | 8.77(21.65) | 8.24(24.48) | 10.50(6.92) | 0.538 |
| Creatine,umol/L | 117.89(168.78) | 116.18(174.36) | 123.39(151.08) | 0.801 |
| Prothrombin time,second | 14.68(3.48) | 14.01(1.67) | 16.90(6.08) | <0.001 |
| INR | 1.64(6.77) | 1.72(7.72) | 1.39(0.70) | 0.777 |
| D-dimer,ug/mL | 3.46(5.63) | 2.38(4.30) | 7.01(7.73) | <0.001 |
| Procalcitonin,ng/mL | 0.86(4.92) | 0.72(4.89) | 1.30(5.06) | 0.498 |
| BNP,pg/mL | 2609.28(8815.92) | 2566.23(9742.83) | 2733.42(5401.05) | 0.951 |
| IL1β,pg/mL | 8.70(84.43) | 10.59(97.16) | 2.89(6.90) | 0.601 |
| IL2R,U/mL | 941.77(778.11) | 839.42(766.33) | 1255.82(736.47) | 0.002 |
| IL6,pg/mL | 58.00(126.54) | 33.72(75.24) | 130.85(201.66) | <0.001 |
| IL8,pg/mL | 32.31(50.49) | 28.47(51.83) | 44.11(44.62) | <0.001 |
| IL10,pg/mL | 5.95(11.32) | 5.06(9.93) | 8.69(14.61) | 0.065 |
| TNFa,pg/mL | 10.36(6.90) | 9.59(6.70) | 12.74(7.04) | 0.008 |
| Leucocytes, × 10? per L | 7.80(4.70) | 7.10(4.68) | 10.08(4.04) | <0.001 |
| Neutrophil percentage | 73.95(13.56) | 70.13(12.96) | 86.24(6.15) | <0.001 |
| Neutrophils, × 10? per L | 6.12(4.70) | 5.29(4.63) | 8.81(3.87) | <0.001 |
| Lymphocyte percentage | 17.04(10.40) | 19.95(10.04) | 7.67(4.21) | <0.001 |
| Lymphocytes, × 10? per L | 1.07(0.64) | 1.18(0.66) | 0.68(0.33) | <0.001 |
| Monocyte, × 10? per L | 0.51(0.25) | 0.50(0.24) | 0.53(0.30) | 0.895 |
| Eosinophils, × 10? per L | 0.08(0.14) | 0.10(0.13) | 0.04(0.15) | 0.012 |
| Basophils, × 10? per L | 0.02(0.02) | 0.02(0.03) | 0.02(0.01) | 0.074 |
| Platelets, × 10? per L | 218.31(96.62) | 226.60(88.55) | 191.63(116.04) | 0.032 |
| T cells (CD3+CD19-)/u | 753.71(475.97) | 965.06(421.16) | 322.88(223.97) | <0.001 |
| B cells (CD3-CD19+)/u | 146.47(110.92) | 162.34(111.34) | 114.12(104.79) | 0.069 |
| Th cells (CD3+CD4+)/u | 482.75(310.41) | 612.47(277.33) | 218.31(179.59) | <0.001 |
| Ts cells (CD3+CD8+)/u | 241.90(187.99) | 316.26(181.77) | 90.31(76.92) | <0.001 |
| NK cells (CD3-/CD16+CD56+)/u | 150.80(132.03) | 202.23(130.72) | 45.96(42.49) | <0.001 |
| T cells+B cells+NK cells/u | 1050.97(625.27) | 1329.62(553.33) | 482.96(287.76) | <0.001 |
| Th/Ts | 2.63(1.72) | 2.28(1.39) | 3.33(2.11) | <0.001 |
Data are mean (SD).n (%), or n/N (%), where N is the total number of patients with available data. p values comparing survival and died cases are from T test, or Mann-Whitney U test. COIVD19=coronavirus disease 2019, NK cells=natural killer cells, Th cells=helper T cells, Ts cells=suppressor T cell.
As for the inflammatory biomarkers (IL2R, IL6, IL8 and TNF-α), died patients had significant elevate in died group than survivors (P<0.05 for all). No significant differences existed in serumcreatine, BUN, INR, procalcitonin, hemoglobin and BNP levels between two groups (P> 0.05).
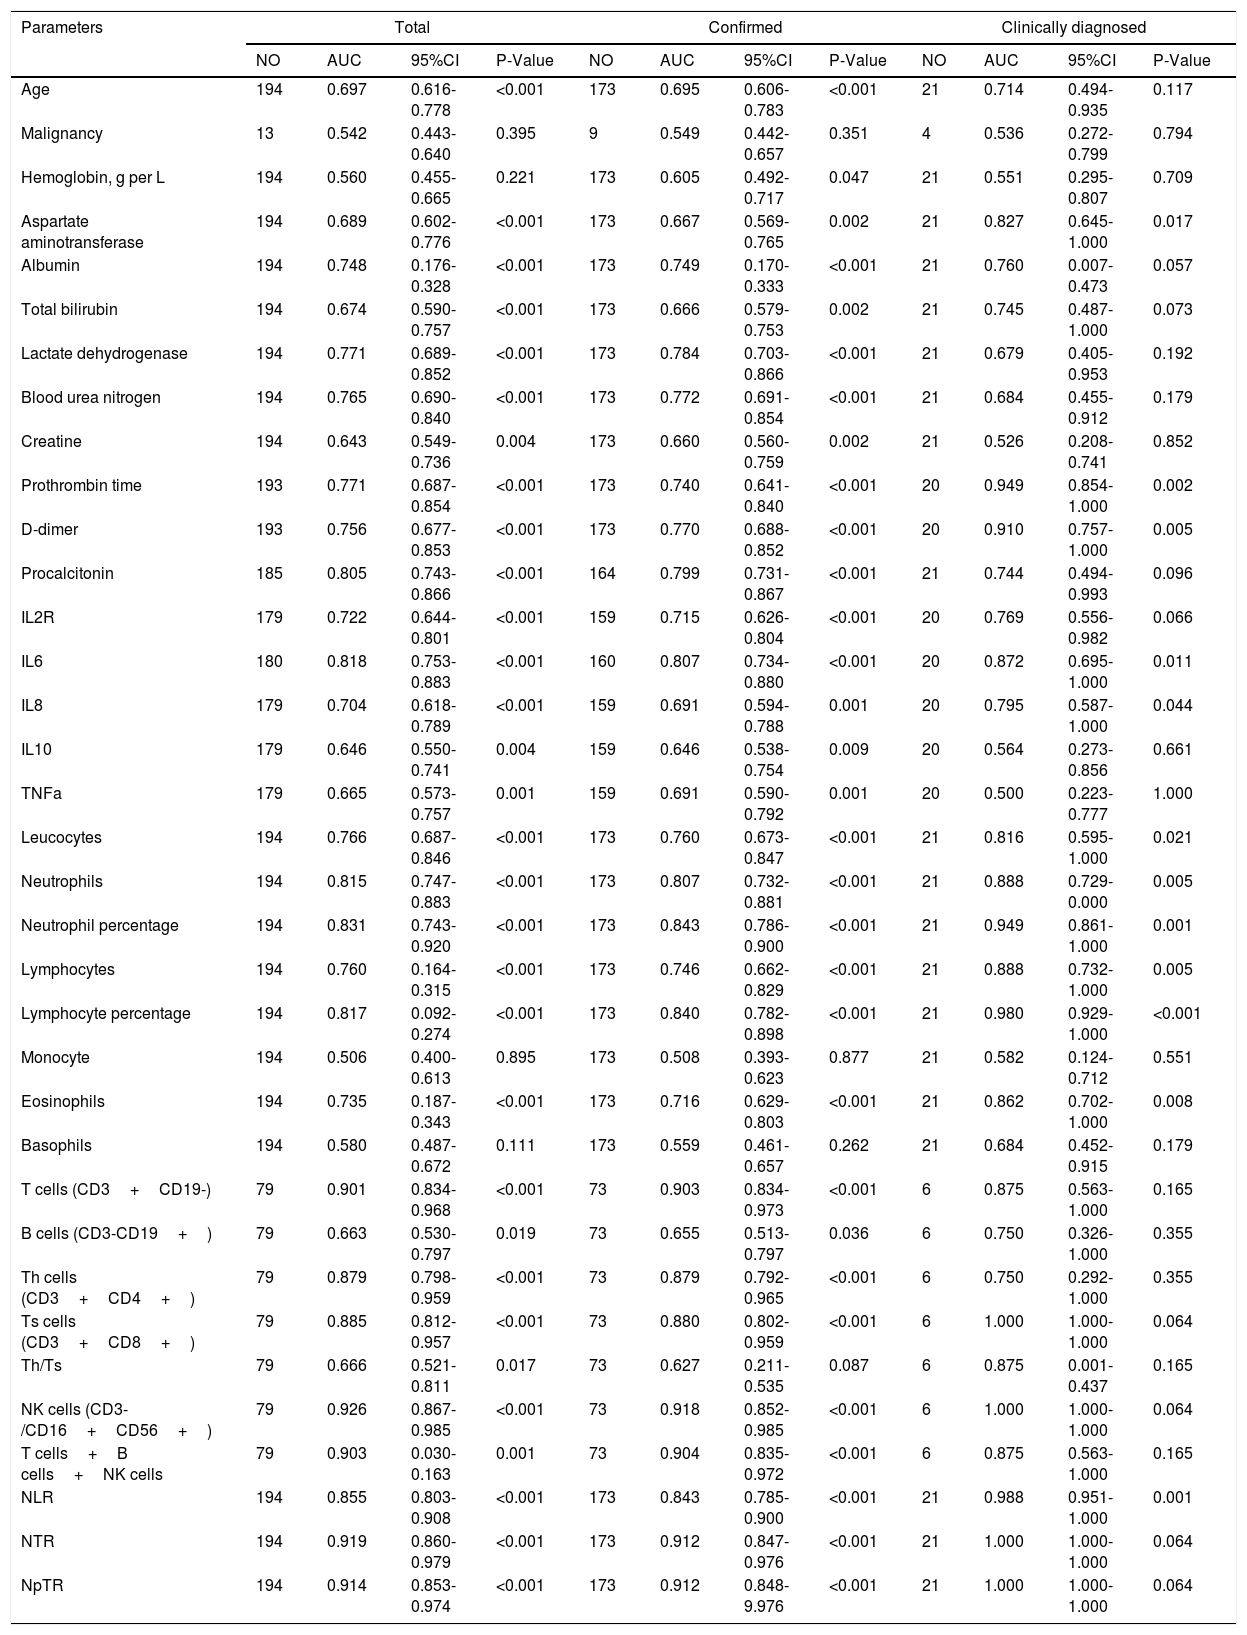
Prognostic Values of related parameters between Confirmed and Clinically diagnosed groupIn this study, death was regarded as the clinical endpoint event, and recovery from discharge or hospitalization was regarded as another event, thus making the dependent variable a dichotomous variable. ROC curve analysis was performed to evaluate the prognostic factors for COVID-19. As shown in Table 4, factors associated with peripheral blood cell count (Leucocytes, Neutrophils, Neutrophil percentage, Lymphocyte percentage, T cells, Th cells, Ts cells, NK cells, T cells+B cells+NK cells, NLR, NTR, NpTR), inflammation associated factors (Procalcitonin, IL6) and biochemical indicators (Lactate dehydrogenase, Blood urea nitroge, Prothrombin time, D-dimer) showed good prognostic values. among which NK cells and NTR were the most predominant predictive factors for the clinical outcome (NK AUC=0.926, 95% CI: 0.867-0.985, P<0.001; NTR AUC=0.919,95% CI: 0.860-0.979, P<0.001).Factors related to the prognosis of confirmed and clinically diagnosed group were similar, although the differences were likely due to the insufficient number of clinically diagnosed cases. Lower LDH levels, higher D-D levels, longer PT, higher IL-6 levels, lower T cells indicated poor prognosis in patients with COVID-19 pneumonia.
Prognostic value of the clinical parameters.
| Parameters | Total | Confirmed | Clinically diagnosed | |||||||||
|---|---|---|---|---|---|---|---|---|---|---|---|---|
| NO | AUC | 95%CI | P-Value | NO | AUC | 95%CI | P-Value | NO | AUC | 95%CI | P-Value | |
| Age | 194 | 0.697 | 0.616-0.778 | <0.001 | 173 | 0.695 | 0.606-0.783 | <0.001 | 21 | 0.714 | 0.494-0.935 | 0.117 |
| Malignancy | 13 | 0.542 | 0.443-0.640 | 0.395 | 9 | 0.549 | 0.442-0.657 | 0.351 | 4 | 0.536 | 0.272-0.799 | 0.794 |
| Hemoglobin, g per L | 194 | 0.560 | 0.455-0.665 | 0.221 | 173 | 0.605 | 0.492-0.717 | 0.047 | 21 | 0.551 | 0.295-0.807 | 0.709 |
| Aspartate aminotransferase | 194 | 0.689 | 0.602-0.776 | <0.001 | 173 | 0.667 | 0.569-0.765 | 0.002 | 21 | 0.827 | 0.645-1.000 | 0.017 |
| Albumin | 194 | 0.748 | 0.176-0.328 | <0.001 | 173 | 0.749 | 0.170-0.333 | <0.001 | 21 | 0.760 | 0.007-0.473 | 0.057 |
| Total bilirubin | 194 | 0.674 | 0.590-0.757 | <0.001 | 173 | 0.666 | 0.579-0.753 | 0.002 | 21 | 0.745 | 0.487-1.000 | 0.073 |
| Lactate dehydrogenase | 194 | 0.771 | 0.689-0.852 | <0.001 | 173 | 0.784 | 0.703-0.866 | <0.001 | 21 | 0.679 | 0.405-0.953 | 0.192 |
| Blood urea nitrogen | 194 | 0.765 | 0.690-0.840 | <0.001 | 173 | 0.772 | 0.691-0.854 | <0.001 | 21 | 0.684 | 0.455-0.912 | 0.179 |
| Creatine | 194 | 0.643 | 0.549-0.736 | 0.004 | 173 | 0.660 | 0.560-0.759 | 0.002 | 21 | 0.526 | 0.208-0.741 | 0.852 |
| Prothrombin time | 193 | 0.771 | 0.687-0.854 | <0.001 | 173 | 0.740 | 0.641-0.840 | <0.001 | 20 | 0.949 | 0.854-1.000 | 0.002 |
| D-dimer | 193 | 0.756 | 0.677-0.853 | <0.001 | 173 | 0.770 | 0.688-0.852 | <0.001 | 20 | 0.910 | 0.757-1.000 | 0.005 |
| Procalcitonin | 185 | 0.805 | 0.743-0.866 | <0.001 | 164 | 0.799 | 0.731-0.867 | <0.001 | 21 | 0.744 | 0.494-0.993 | 0.096 |
| IL2R | 179 | 0.722 | 0.644-0.801 | <0.001 | 159 | 0.715 | 0.626-0.804 | <0.001 | 20 | 0.769 | 0.556-0.982 | 0.066 |
| IL6 | 180 | 0.818 | 0.753-0.883 | <0.001 | 160 | 0.807 | 0.734-0.880 | <0.001 | 20 | 0.872 | 0.695-1.000 | 0.011 |
| IL8 | 179 | 0.704 | 0.618-0.789 | <0.001 | 159 | 0.691 | 0.594-0.788 | 0.001 | 20 | 0.795 | 0.587-1.000 | 0.044 |
| IL10 | 179 | 0.646 | 0.550-0.741 | 0.004 | 159 | 0.646 | 0.538-0.754 | 0.009 | 20 | 0.564 | 0.273-0.856 | 0.661 |
| TNFa | 179 | 0.665 | 0.573-0.757 | 0.001 | 159 | 0.691 | 0.590-0.792 | 0.001 | 20 | 0.500 | 0.223-0.777 | 1.000 |
| Leucocytes | 194 | 0.766 | 0.687-0.846 | <0.001 | 173 | 0.760 | 0.673-0.847 | <0.001 | 21 | 0.816 | 0.595-1.000 | 0.021 |
| Neutrophils | 194 | 0.815 | 0.747-0.883 | <0.001 | 173 | 0.807 | 0.732-0.881 | <0.001 | 21 | 0.888 | 0.729-0.000 | 0.005 |
| Neutrophil percentage | 194 | 0.831 | 0.743-0.920 | <0.001 | 173 | 0.843 | 0.786-0.900 | <0.001 | 21 | 0.949 | 0.861-1.000 | 0.001 |
| Lymphocytes | 194 | 0.760 | 0.164-0.315 | <0.001 | 173 | 0.746 | 0.662-0.829 | <0.001 | 21 | 0.888 | 0.732-1.000 | 0.005 |
| Lymphocyte percentage | 194 | 0.817 | 0.092-0.274 | <0.001 | 173 | 0.840 | 0.782-0.898 | <0.001 | 21 | 0.980 | 0.929-1.000 | <0.001 |
| Monocyte | 194 | 0.506 | 0.400-0.613 | 0.895 | 173 | 0.508 | 0.393-0.623 | 0.877 | 21 | 0.582 | 0.124-0.712 | 0.551 |
| Eosinophils | 194 | 0.735 | 0.187-0.343 | <0.001 | 173 | 0.716 | 0.629-0.803 | <0.001 | 21 | 0.862 | 0.702-1.000 | 0.008 |
| Basophils | 194 | 0.580 | 0.487-0.672 | 0.111 | 173 | 0.559 | 0.461-0.657 | 0.262 | 21 | 0.684 | 0.452-0.915 | 0.179 |
| T cells (CD3+CD19-) | 79 | 0.901 | 0.834-0.968 | <0.001 | 73 | 0.903 | 0.834-0.973 | <0.001 | 6 | 0.875 | 0.563-1.000 | 0.165 |
| B cells (CD3-CD19+) | 79 | 0.663 | 0.530-0.797 | 0.019 | 73 | 0.655 | 0.513-0.797 | 0.036 | 6 | 0.750 | 0.326-1.000 | 0.355 |
| Th cells (CD3+CD4+) | 79 | 0.879 | 0.798-0.959 | <0.001 | 73 | 0.879 | 0.792-0.965 | <0.001 | 6 | 0.750 | 0.292-1.000 | 0.355 |
| Ts cells (CD3+CD8+) | 79 | 0.885 | 0.812-0.957 | <0.001 | 73 | 0.880 | 0.802-0.959 | <0.001 | 6 | 1.000 | 1.000-1.000 | 0.064 |
| Th/Ts | 79 | 0.666 | 0.521-0.811 | 0.017 | 73 | 0.627 | 0.211-0.535 | 0.087 | 6 | 0.875 | 0.001-0.437 | 0.165 |
| NK cells (CD3-/CD16+CD56+) | 79 | 0.926 | 0.867-0.985 | <0.001 | 73 | 0.918 | 0.852-0.985 | <0.001 | 6 | 1.000 | 1.000-1.000 | 0.064 |
| T cells+B cells+NK cells | 79 | 0.903 | 0.030-0.163 | 0.001 | 73 | 0.904 | 0.835-0.972 | <0.001 | 6 | 0.875 | 0.563-1.000 | 0.165 |
| NLR | 194 | 0.855 | 0.803-0.908 | <0.001 | 173 | 0.843 | 0.785-0.900 | <0.001 | 21 | 0.988 | 0.951-1.000 | 0.001 |
| NTR | 194 | 0.919 | 0.860-0.979 | <0.001 | 173 | 0.912 | 0.847-0.976 | <0.001 | 21 | 1.000 | 1.000-1.000 | 0.064 |
| NpTR | 194 | 0.914 | 0.853-0.974 | <0.001 | 173 | 0.912 | 0.848-9.976 | <0.001 | 21 | 1.000 | 1.000-1.000 | 0.064 |
Notes: NO,Actual number of cases;AUC,area under the receiver operating characteristic curve;CI,confident interval;NLR, neutrophil-to-lymphocyte ratio; NTR, neutrophil to T lymphocyte count ratio; NpTR, neutrophil percentage to T lymphocyte ratio;NK cells=natural killer cells, Th cells=helper T cells, Ts cells=suppressor T cells.NLR,neutrophil to lymphocyte ratio;NTR, neutrophil to T lymphocyte count ratio;NpTR,neutrophil percentage to T lymphocyte ratio.
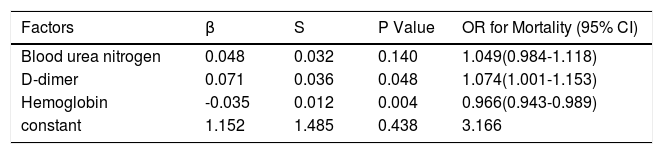
Furthermore, multivariate logistic regression analysis showed that D-dimer (OR=1.074, P=0.048) and haemoglobin (OR=0.966, P=0.004) were independent prognostic factors for death (Table 5).
Multivariate logistic regression of independent prognostic factors for mortality.
| Factors | β | S | P Value | OR for Mortality (95% CI) |
|---|---|---|---|---|
| Blood urea nitrogen | 0.048 | 0.032 | 0.140 | 1.049(0.984-1.118) |
| D-dimer | 0.071 | 0.036 | 0.048 | 1.074(1.001-1.153) |
| Hemoglobin | -0.035 | 0.012 | 0.004 | 0.966(0.943-0.989) |
| constant | 1.152 | 1.485 | 0.438 | 3.166 |
To our knowledge, this was the first study to compare and analyze the differences between clinically diagnosed and confirmed patients. According to previous studies,12 COVID-19 mainly invades the lower respiratory tract, and the positive rate of nucleic acid detection by pharyngeal swab is low, about 30%-50%.In addition, the study found that the expressions of IgM and IgG in the clinically diagnosed group were significantly lower than those in the confirmed group (IgM 3.41 vs 104.42 AU/ml, P<0.001; IgG 5.54 vs 203.03 AU/ml, P<0.001).The history of malignant tumors and chronic renal failure was more in the clinical diagnosis group, and the difference was statistically significant. These reasons may be related to a negative laboratory diagnosis in the clinically diagnosed group.
In this study, we found that the BUN, BNP, Prothrombin time, and D-dimer were significantly higher in the clinical diagnosis group than in the diagnosed group, while the hemoglobin was lower than that in the diagnosed group. This may be due to the large number of patients with renal failure, malignant tumors, and cardiac dysfunction in the clinical diagnosis group, which led to the destruction of red blood cells, cardiac machinery damage, metabolic waste discharge disorders, and coagulation dysfunction.
When the 194 patients were divided into a survival group and a died group for comparative analysis, there was no difference in clinical endpoints between the confirmed group and the clinical diagnosis group (39 [22.54%] vs 7 [33.33%]; P=0.272).We found that the white blood cell count and neutrophil count in the death group were significantly higher than those in the survival group, suggesting that there may be potential bacterial or fungal infections. Therefore, it is very important that we detect potential infections and apply antibiotics in a timely manner during the treatment process. In addition, the T cell and its subtype counts in the death group were significantly lower than those in the survival group, while the number of B cells was not significantly different, which may be related to the fact that T lymphocytes, rather than B lymphocytes, are mainly involved in the immune process of viral infection during the course of the disease, which is consistent with the observation of a recently published death case.13 The report found that the number of T-lymphocytes decreased significantly in the early stage of the disease, which was related to the over activation of T-lymphocytes. A large number of studies 10,13–16also have confirmed that COVID-19 can cause the decline of lymphocytes, especially the death group of T cells and their subtype counts is significantly lower than the survival group. We also found that patients in the died group were older, with lower albumin levels, higher serum LDH levels, higher D-D levels, longer PT, which were consistent with previous studies that showed the age, coagulopathy, bacterial infections, liver, heart, kidney dysfunction, and changes in blood cell counts are associated with the prognosis of patients with COVID-19.14,15
Despite a series of studies on the causes of death in patients with COVID-19, the specific factors leading to high mortality are not fully understood. Respiratory failure is the leading cause of death in older people.13,14 High viral load, cytokine storm, immune escape and delay are the mechanisms of disease progression and death.10,11 We found that the imaging examination of the lungs of patients with COVID-19 death showed extensive white lung, mainly infiltrated by a large number of white blood cells, with over-activated T lymphocytes as the main cell type. Superinflammatory cytokines can amplify the inflammatory response by promoting uncontrolled viral replication,11,13 which was consistent with laboratory examinations that IL2R, IL6, IL8, and TNF-α in the death group are significantly higher than those in the survival group, suggesting a poor prognosis. Therefore, non-self-limiting inflammatory response and lymphocyte dysfunction may be the key mechanisms for fatal pneumonia caused by SARS-CoV-2 infection. IL-6 is a powerful predictor of death and is closely related to the counts of white blood cells, neutrophils, lymphocytes and eosinophils.17–19 Therefore, IL6 receptor blocker (tocilizumab) is a new and promising antitumor. The drug has been approved for clinical trials in China (ChiCTR2000029765).
This study also has shortcomings. First, the laboratory test data of the clinical diagnosis group is relatively less and more missing, which has certain influence on the study of predictive factors and prognostic value. Second, this is a single-center retrospective study, which lacks verification of multi-center data.
ConclusionIn summary, this study found no difference in clinical outcomes between the confirmed and clinical diagnosis groups, and similar prognostic factors. They are of the same type and require equal treatment. Older age, lower albumin levels, higher serum LDH levels, higher D-D levels, longer PT, higher IL-6 levels, lower T cells indicated poor prognosis in patients with COVID-19 pneumonia. Non-self-limiting inflammatory response and lymphocyte dysfunction maybe the key mechanism in fatal pneumonia induced by SARS-CoV-2 infection, providing evidence for laboratory diagnostics and clinical interventions.
ContributorsChunguang Yang and Zhiquan Hu made substantial contributions to the study design. Chunjin Ke was in charge of the manuscript draft. Chunguang Yang took responsibility for obtaining ethical approval. Chong Yu and Daoyuan Yue took responsibility for data acquisition. Chunjin Ke and Chunguang Yang made main contributions to data analysis and interpretation. Xing Zeng and Chunguang Yang participated in the diagnosis and treatment of health professionals. Chunguang Yang and Zhiquan Hu made substantial revisions to the manuscript.
Data sharingWith the permission of the corresponding authors, the raw data without names and identifers are available on reasonable request. Data can be provided after publication of this study. Once the data are approved to be made public, the researchers will provide an email address for communication. The corresponding authors will make a decision based on based on the research objectives and plan provided.
Declaration of interestsThe manuscript is an original work and has not been submitted or is under consideration for publication in another journal. We also confirm that all the listed authors have participated actively in the study, and approved the submitted manuscript. The authors do not have any possible conflicts of interest.
This work was supported by National Natural Science Foundation of China (No.81702989)
