


Children and adolescents with cerebral palsy (CP) are at a greater risk of malnutrition and micronutrient deficiencies. Two deficiencies that we can study and treat are vitamin D (VD) and iron deficiencies; however, no studies have described these deficiencies in Chile.
ObjectiveTo describe the status of VD and iron in patients with CP and evaluate the relationship with certain factors associated with deficiencies of these micronutrients.
Patients and methodWe performed a descriptive, cross-sectional study including 69 patients aged between 2 and 21years, from two public hospitals. Data were obtained on demographic variables, motor function, use of feeding tube, and pharmacological treatment. We performed a nutritional assessment according to patterns of CP and determined 25-hydroxyvitamin D (25[OH]D) ferritin, and albumin levels.
ResultsPatients’ mean age was 11.1±4.9years; 43 (62.3%) were male; and 56 (81.2%) had moderate-to-severe CP. Thirty-five (50.7%) used a nasogastric tube and/or gastrostomy; 15.4% were underweight and 73.8% were eutrophic, all with normal height. Twenty (29%) and 4 patients (6.2%) received VD and iron supplementation, respectively. Albuminaemia was normal in all patients. Mean 25(OH)D level was 24.3±8.8ng/mL; 33 patients (47.8%) had insufficiency and 21 (30.4%) deficiency; 36 patients (52.2%) had low ferritin levels. There was no association between 25(OH)D level and the other variables studied. Low ferritin levels were found to be associated with older age (P=.03), being male (P=.006), and feeding tube use (P=.006).
ConclusionsThe patients studied mainly had moderate-to-severe CP, with a high frequency of suboptimal VD values and low plasma ferritin; few patients received VD and/or iron supplementation. We suggest monitoring 25(OH)D and ferritin levels due to the high rate of deficiency of these nutrients; public hospitals should be equipped with drugs to treat these deficiencies.
Los niños y adolescentes con parálisis cerebral (PC) tienen mayor riesgo de desnutrición y deficiencias de micronutrientes. Dos de los que podemos estudiar y tratar son la vitamina D (VD) y el hierro. No disponemos de estudios que describan estas deficiencias en Chile.
ObjetivoDescribir el estado de ambos micronutrientes y evaluar la asociación con algunos factores que favorecen su déficit.
Pacientes y métodoEstudio descriptivo, corte transversal. Se estudiaron 69 sujetos, de entre 2 a 21años de edad, de dos hospitales públicos. Se obtuvieron datos demográficos, función motora, uso de sonda de alimentación y fármacos en uso. Se realizó evaluación nutricional según patrones para PC, y se determinó 25-hidroxivitaminaD (25OHD), ferritinemia y albuminemia.
ResultadosEdad promedio 11,1±4,9años, 43 (62,3%) varones, 56 (81,2%) tenían PC moderada-severa. Utilizaban sonda nasogástrica y/o gastrostomía 35 (50,7%), el 15,4% estaban con peso bajo y el 73,8% eutróficos, todos con talla normal. Recibían suplementación de VD 20 (29%), y de hierro, 4 (6,1%). La albuminemia fue normal en todos. El promedio de 25OHD fue 24,3±8,8ng/ml, 33 (47,8%) presentaron insuficiencia y 21 (30,4%) deficiencia. Tuvieron ferritina baja 36 (52,2%). No se encontró asociación entre 25OHD y variables estudiadas. Se encontró asociación entre ferritina baja y mayor edad (p=0,03), ser hombre (p=0,006) y uso de sonda de alimentación (p=0,006).
ConclusionesEl grupo estudiado fue principalmente PC moderada-severa, con alta frecuencia de valores subóptimos de VD y baja ferritina plasmática, además de escasa suplementación de ambos. Sugerimos realizar seguimiento de 25OHD y ferritina, por su alta frecuencia de deficiencia y por contar con fármacos para su tratamiento en los hospitales públicos.
Children with cerebral palsy (CP) are at greater risk of malnutrition than the healthy paediatric population. Malnutrition is associated with greater cognitive impairment and more severe gross motor dysfunction.1
Feeding difficulties influence nutrition, with many of these patients needing caregiver support. Feeding difficulties increase in parallel with severity of gross motor dysfunction.2–4
Feeding difficulties, the feeding route used (oral, nasogastric tube, gastrostomy), and the type of food play a role in energy and micronutrient deficiencies (potassium, iron, magnesium, zinc, selenium, calcium, niacin, copper, folate, and vitamins A, D, and E).4–8
Nutritional deficiencies are not only identifiable by analysing these patients’ diet; laboratory analysis reveals lower levels of iron, vitamin D, copper, magnesium, folate, vitamin E, vitamin B6, zinc, and selenium in these patients than in the healthy paediatric population.5,8 Each type of deficiency is associated with specific factors.9
In Chile, children with CP can access multidisciplinary care through the public healthcare system; however, micronutrient deficiencies are not routinely evaluated. No information is available on nutritional deficiencies in children with CP in our setting; given their high overall survival rate, thorough, personalised nutritional assessment is required.
Vitamin D and iron deficiencies are frequent in children with CP; the levels of these 2 micronutrients are easily analysed and corrected with supplements. The objective of this study was to describe vitamin D and iron levels in patients with CP and to evaluate some of the main factors involved in vitamin D and iron deficiencies.
Patients and methodsWe conducted a prospective, descriptive, cross-sectional study of a sample of patients with CP gathered between April 2014 and March 2015. Participants were selected by convenience sampling; the sample included 69 patients aged 2-21 years. We initially selected all outpatients with CP included in the healthcare programme for children and adolescents with special needs (NANEAS, for its Spanish initials) of Hospital Padre Hurtado and Hospital Dr. Sótero del Río; both healthcare centres belong to the South East Metropolitan Health Service. Candidate patients were invited to participate through a telephone call to their primary caregiver, or at routine follow-up consultations. Caregivers read and signed informed consent forms before patients were included in the study; participants were not required to give informed consent due to intellectual and/or motor impairment preventing them from understanding the aims of the study or signing the form.
We included all patients diagnosed with CP by a paediatric neurologist and under follow-up at one of the 2 participating hospitals. We excluded all patients admitted to hospital in the month previous to study onset, and/or those with acute diseases; a minimum period of one month after symptom resolution was established for these patients to be included in the study.
We gathered demographic data and information about the primary caregiver, the feeding route (oral, nasogastric tube, gastrostomy), history of bone fractures, and use of antiepileptics or other drugs or nutritional supplements.
The physical examination evaluated gross motor function with the Gross Motor Function Classification System (GMFCS),10 which establishes the following levels: level I, walks without difficulty; level II, walks with limitations; level III, walks using a hand-held mobility device; level IV, self-mobility is limited and patients may use a powered wheelchair; and level V, cannot walk independently, transported in a wheelchair. Gross motor dysfunction was regarded as mild for GMFCS levels I–III and moderate-to-severe for levels IV and V.
Weight was measured with a scale; patients unable to stand were weighed with a chair scale. Height was either measured with an infantometer or estimated based on tibia length using the equation proposed by Stevenson11: [height=(length from the superomedial edge of the tibia to the inferior edge of the medial malleolus [cm]×3.26)+30.8]. We recorded each patient's GMFCS level and feeding route, and evaluated their nutritional status according to the reference patterns for CP, expressed in percentiles, for each sex.12 The normal height-for-age percentile was set at p5 to p95. The nutritional status was established based on body mass index – for-age (BMI/A): a BMI/A≤p10 was regarded as low weight, BMI/A between p10 and p75 was considered to indicate normal weight, and BMI/A≥p75 was considered overweight.
Fasting blood samples were taken to determine plasma levels of 25-hydroxyvitamin D (25[OH]D), albumin, and ferritin; analyses were performed by a nurse. A 25(OH)D level≥30ng/mL was regarded as vitamin D sufficiency, levels ranging from 21 to 29ng/mL were considered vitamin D insufficiency, and levels≤20ng/mL were regarded as vitamin D deficiency. 25(OH)D levels were determined with liquid chromatography–tandem mass spectrometry.
Serum ferritin levels were determined with electrochemiluminescence immunoassay (Cobas, Roche): normal values range from 13 to 150ng/mL for females and from 30 to 400ng/mL for males.
Serum albumin levels were determined using the colorimetric method; concentrations≥3.5g/dL were considered normal. All analyses were performed at the central laboratory of the UC CHRISTUS Healthcare Network.
Statistical analysisData were anonymised and analysed with Stata, version 12. We performed a descriptive statistical analysis. Continuous variables were tested for normality with the Shapiro–Wilk test; all variables were normally distributed, and are therefore expressed as means (SD). The t test, Pearson correlation coefficient, chi-square test, and Fisher exact test were used to analyse data, with statistical significance set at P<.05.
The study complies with the ethical principles of the Declaration of Helsinki (2013) and was approved by the research ethics committees of the South East Metropolitan Health Service (22 August 2013) and the Pontificia Universidad Católica de Chile (No. 14-124).
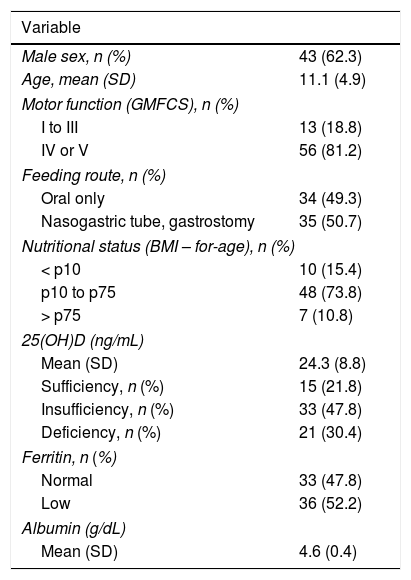
ResultsOur study included 69 patients. Table 1 summarises participants’ demographic and clinical characteristics. Information on gestational age was available for 66 participants: 19 (28.8%) were born before 37 weeks.
Demographic characteristics of our sample.
| Variable | |
|---|---|
| Male sex, n (%) | 43 (62.3) |
| Age, mean (SD) | 11.1 (4.9) |
| Motor function (GMFCS), n (%) | |
| I to III | 13 (18.8) |
| IV or V | 56 (81.2) |
| Feeding route, n (%) | |
| Oral only | 34 (49.3) |
| Nasogastric tube, gastrostomy | 35 (50.7) |
| Nutritional status (BMI – for-age), n (%) | |
| < p10 | 10 (15.4) |
| p10 to p75 | 48 (73.8) |
| > p75 | 7 (10.8) |
| 25(OH)D (ng/mL) | |
| Mean (SD) | 24.3 (8.8) |
| Sufficiency, n (%) | 15 (21.8) |
| Insufficiency, n (%) | 33 (47.8) |
| Deficiency, n (%) | 21 (30.4) |
| Ferritin, n (%) | |
| Normal | 33 (47.8) |
| Low | 36 (52.2) |
| Albumin (g/dL) | |
| Mean (SD) | 4.6 (0.4) |
Normal ferritin levels: females, 13-150ng/mL; males, 30-400ng/mL.
25(OH)D: 25-hydroxyvitamin D; BMI: body mass index12; GMFCS: Gross Motor Function Classification System10; SD: standard deviation.
Vitamin D sufficiency: 25(OH)D level≥30ng/mL; vitamin D insufficiency: 25(OH)D level 21–29ng/mL; vitamin D deficiency, 25(OH)D level≤20ng/mL.
Thirty-four patients (49.3%) were fed orally, 4 (5.8%) via nasogastric tube exclusively, 26 (37.7%) via gastrostomy exclusively, 2 (2.9%) orally plus via nasogastric tube, and the remaining 3 (4.3%) were fed orally plus via gastrostomy. For the purposes of our analysis, patients were classified as feeding either orally (34 [49.3%]) or via nasogastric tube or gastrostomy, either alone or in combination (35 [50.7%]).
The primary caregiver was the patient's mother in 58 cases (84.1%), the patient's grandmother in 7 (10.1%), and another person in 4 (5.8%).
During the study period, 26 patients (37.7%) were admitted to hospital during autumn and winter, and 43 (62.3%) during spring and summer.
One of the hospitals provided data on history of bone fractures, which was recorded in 4 of the 32 patients attended at that hospital (6.6%). Fractures affected the femur in 2 patients, the ribs in one, and a foot in the remaining patient.
Regarding pharmacological treatment, 7.6% of patients were receiving no medication, 33.3% were taking 1-2 drugs daily, 43.9% were taking 3-5 drugs, and 15.2% received 6 or more drugs daily; 16.1% were not taking antiepileptics, 62.9% were taking 1-2 antiepileptic drugs, and 21% were receiving 3-5 antiepileptic drugs.
Twenty patients (29%) were receiving vitamin D supplements: 14 at a dose ≤ 400IU/day and the remaining 6 at a dose>400IU/day. Doses ranged from 200IU/day to 800IU/day. Four patients (6.1%) were receiving iron supplementation; none of these were being treated for iron-deficiency anaemia.
All patients showed normal albumin levels, with a mean (SD) of 4.6 (0.4) g/dL (range, 3.6-5.4).
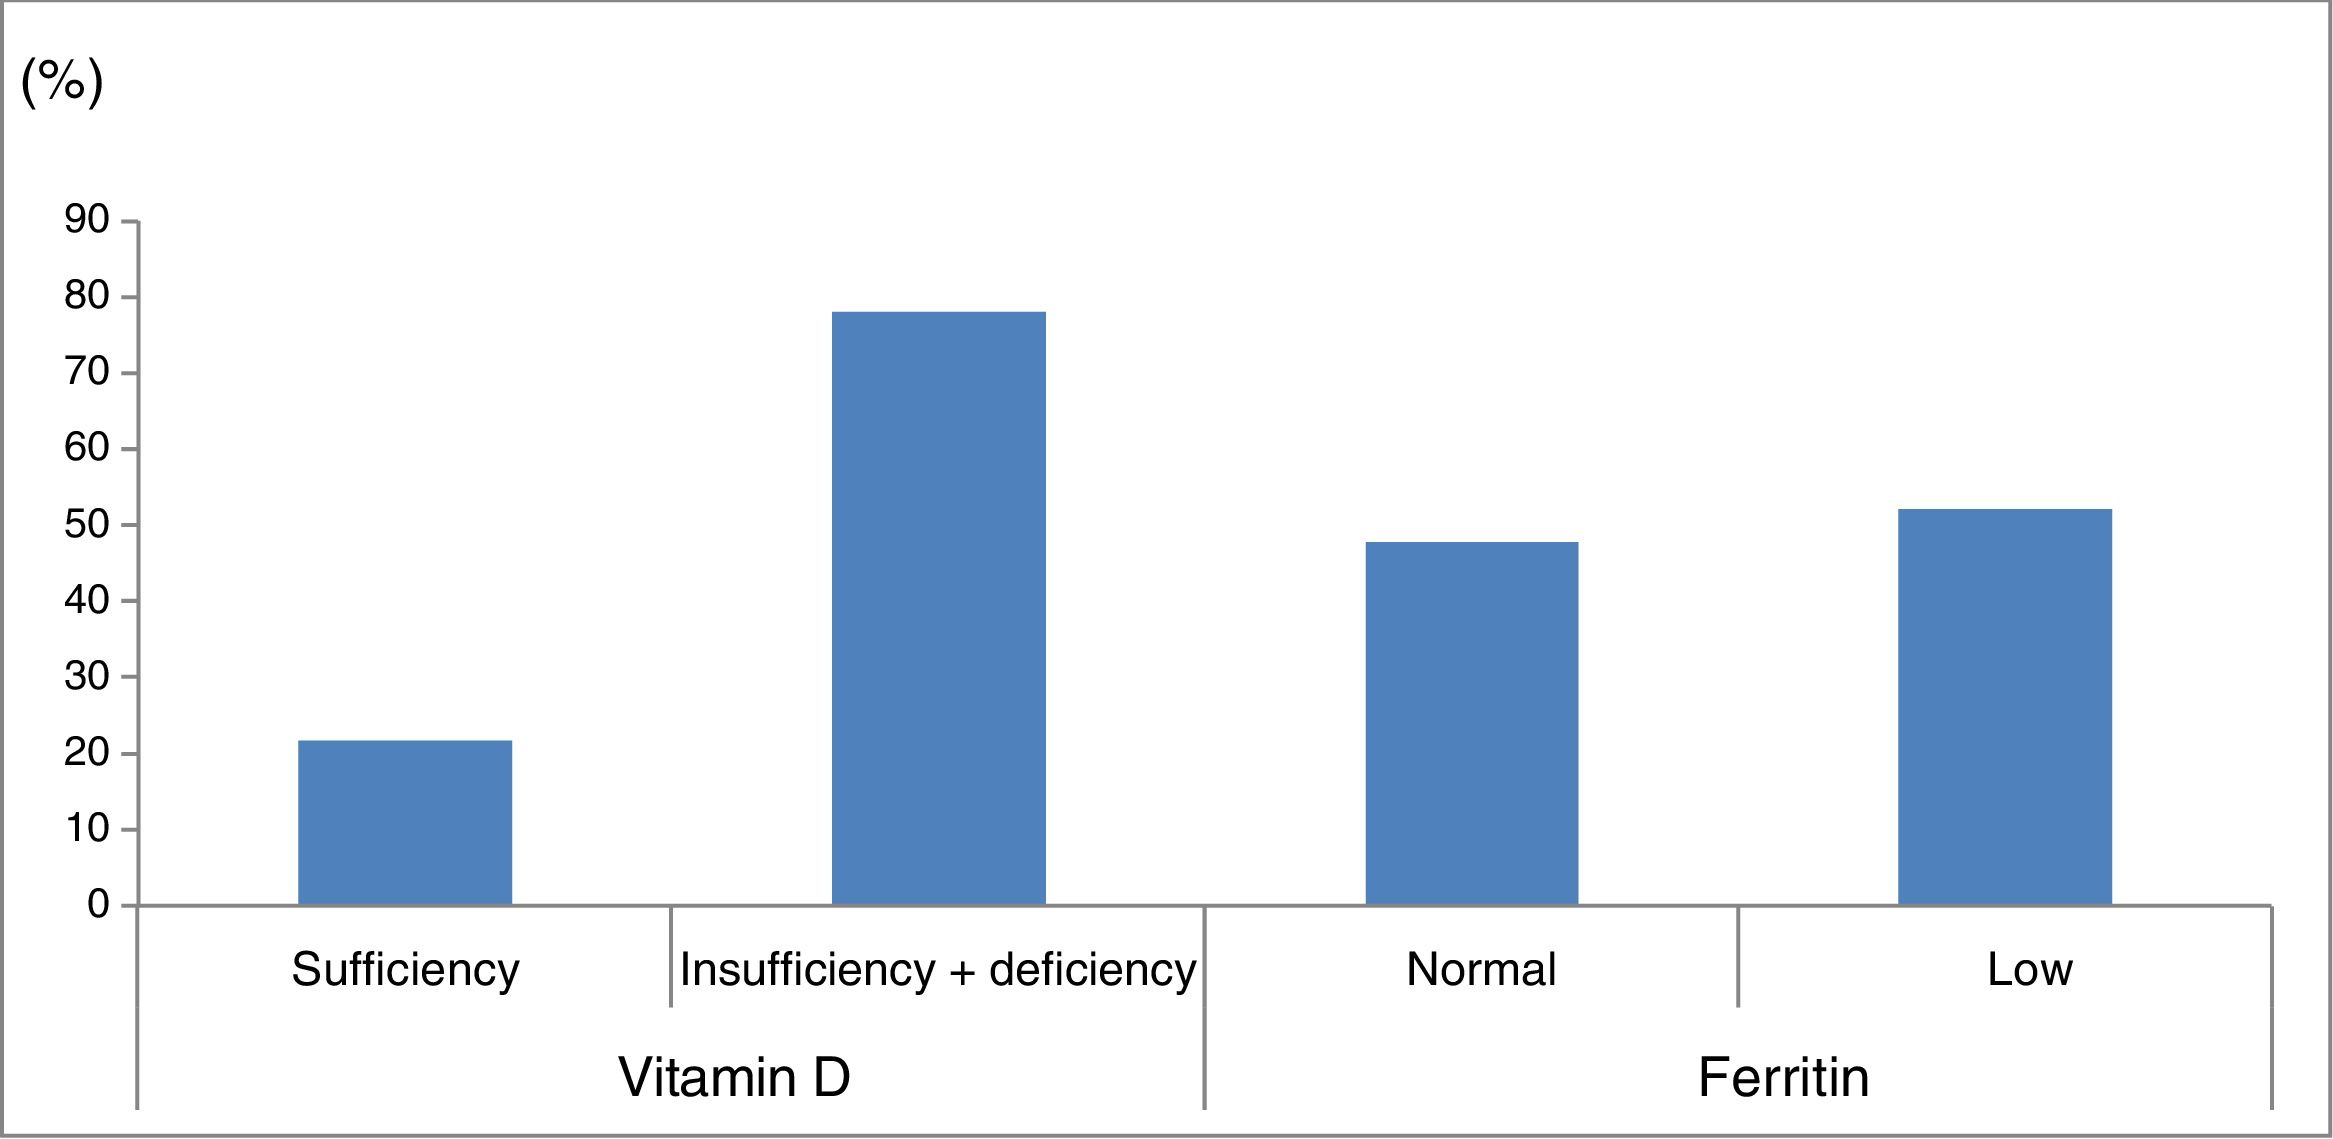
Mean 25(OH)D concentration was 24.3 (8.8) ng/mL (range, 5.4-48.7). Fifteen patients (21.8%) presented vitamin D sufficiency, 33 (47.8%) vitamin D insufficiency, and 21 (30.4%) vitamin D deficiency; therefore, vitamin D levels were suboptimal in 78.2% of patients.
Ferritin levels were normal in 33 patients (47.8%) and below the normal range in 36 (52.2%) (Fig. 1).

Percentage of patients with vitamin D and ferritin deficiency in our sample of patients with cerebral palsy. Vitamin D sufficiency: 25-hydroxyvitamin D level≥30ng/mL; vitamin D insufficiency+deficiency: 25-hydroxyvitamin D level<30ng/mL. Normal ferritin levels: females, 13-150ng/mL; males, 30-400ng/mL.
No association was observed between nutritional status and sex, pre-term birth, GMFCS level, feeding route, and use of vitamin D or iron supplements.
No association was found between risk of bone fractures and GMFCS level. No other variables were analysed in association with the risk of bone fractures, as they were not evaluated at the time of the fracture.
We found no association between GMFCS level and number of drugs taken, although we did observe a correlation between GMFCS level and antiepileptic drug use: patients with moderate-to-severe CP received more antiepileptic drugs than those with mild CP (P=.04).
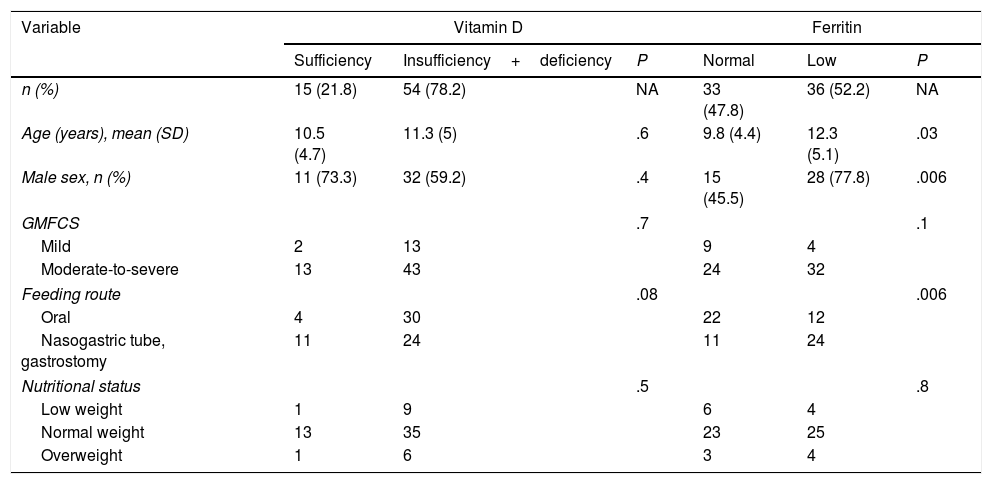
No association was observed between 25(OH)D concentration and sex, GMFCS level, nutritional status, pre-term birth, seasonality (autumn-winter vs spring-summer), feeding route, vitamin D supplementation, or number of medications or antiepileptic drugs used (regardless of whether the drugs induced vitamin D metabolism). No correlation was observed between 25(OH)D concentration and age (Table 2).
Factors associated with vitamin D and ferritin levels in 69 children and adolescents with cerebral palsy.
| Variable | Vitamin D | Ferritin | ||||
|---|---|---|---|---|---|---|
| Sufficiency | Insufficiency+deficiency | P | Normal | Low | P | |
| n (%) | 15 (21.8) | 54 (78.2) | NA | 33 (47.8) | 36 (52.2) | NA |
| Age (years), mean (SD) | 10.5 (4.7) | 11.3 (5) | .6 | 9.8 (4.4) | 12.3 (5.1) | .03 |
| Male sex, n (%) | 11 (73.3) | 32 (59.2) | .4 | 15 (45.5) | 28 (77.8) | .006 |
| GMFCS | .7 | .1 | ||||
| Mild | 2 | 13 | 9 | 4 | ||
| Moderate-to-severe | 13 | 43 | 24 | 32 | ||
| Feeding route | .08 | .006 | ||||
| Oral | 4 | 30 | 22 | 12 | ||
| Nasogastric tube, gastrostomy | 11 | 24 | 11 | 24 | ||
| Nutritional status | .5 | .8 | ||||
| Low weight | 1 | 9 | 6 | 4 | ||
| Normal weight | 13 | 35 | 23 | 25 | ||
| Overweight | 1 | 6 | 3 | 4 | ||
GMFCS: Gross Motor Function Classification System.10
Nutritional status was established based on body mass index (BMI).12
Low weight: BMI – for-age<p10; normal weight: BMI – for-age p10-p75; overweight: BMI – for-age>p75.
Normal ferritin levels: females, 13-150ng/mL; males, 30-400ng/mL.
Mild gross motor dysfunction: levels I to III; moderate-to-severe gross motor dysfunction: levels IV and V.
Vitamin D sufficiency: 25-hydroxyvitamin D level≥30ng/mL; vitamin D insufficiency+deficiency: 25-hydroxyvitamin D level<30ng/mL.
An association was observed between ferritin level and age: patients with low ferritin levels had a mean age (SD) of 12.3 (5.1) years, whereas those with normal ferritin levels had a mean age of 9.8 (4.4) years (P=.03). Low ferritin levels were associated with male sex (P=.006) and feeding via nasogastric tube/gastrostomy (P=.006). We observed no correlation between ferritin level and any of the remaining study variables (Table 2).
DiscussionOur sample included a large percentage of patients with moderate to severe CP (81%); these patients are more likely to have more health problems, difficulties feeding, and nutritional deficiencies.4,12 Levels of the 2 micronutrients studied (vitamin D and ferritin) were low in a large percentage of the sample.
Prevalence of CP is inversely correlated with gestational age.13,14 One-third of our sample were born pre-term; this proportion is higher than that observed in the Chilean population (8.4%) and among children and adolescents with CP (11%-14%).8,15,16
Primary carers were most frequently the patients’ mothers, followed by grandmothers; 95% of patients were cared for by direct relatives. This is consistent with the results of previous studies published in the United States.4
Half of our patients were fed via nasogastric tube or gastrostomy; this proportion is similar to those reported by other studies including children with moderate-to-severe CP.3,7 Feeding difficulties are closely linked to more severe motor impairment. This finding was therefore to be expected, given the high percentage of patients with moderate-to-severe CP in our sample.2–4
Our study participants require moderate-to-high complexity care, since they have greater needs involving different areas of healthcare; most patients were receiving long-term pharmacological treatment, and 60% were taking more than 3 drugs daily.17
All patients presented normal albumin levels, as reported in previous series; nutritional intake met patients’ protein requirements.4,5,18,19
These patients are at a greater risk of presenting vitamin D deficiency.20–24 We determined serum vitamin D concentrations in children and adolescents with CP attended at NANEAS units from 2 public hospitals; these units have no protocol for routine determination of 25(OH)D levels or vitamin D supplementation, which may explain the low percentage of patients receiving vitamin D supplements in our sample. Mean 25(OH)D concentrations were lower in our sample than in the healthy school-age population of Santiago de Chile, with a high percentage of participants displaying suboptimal vitamin D levels. Several studies into the healthy school-age population of Santiago de Chile have reported mean 25(OH)D levels ranging from 25.2 (8.3) to 32.1 (9.2)ng/mL. One study reported suboptimal vitamin D concentrations in 39.7% of the sample, a significantly lower rate than that found in our study (78.2%).25,26
However, our sample showed a lower rate of vitamin D deficiency than those including children and adolescents with similar GMFCS levels from the United States, Turkey, and Norway (30.4% vs 52.6%-72%).7,19,27
No association was observed with known risk factors for vitamin D deficiency, such as severe gross motor dysfunction, use of antiepileptic drugs, and insufficient vitamin D supplementation. This may be explained by the fact that our sample included a large percentage of patients with moderate-to-severe CP and few patients receiving vitamin D supplements.19,27–29 Dietary vitamin D intake is insufficient in these patients, even in those patients consuming vitamin D – fortified milk.5,6,29
Other studies of patients with CP report no differences in 25(OH)D concentrations over the course of the year, which suggests low exposure to sunlight at all times of year.6,7,27
Bone mineral density is lower in children with CP than the healthy population, resulting in an increased risk of fractures. Factors including severe gross motor dysfunction, poor calcium intake, use of antiepileptic drugs, feeding difficulties, and malnutrition have been reported in association with low bone mineral density.7,19,27,30 Few studies have analysed the prevalence of bone fractures in children with CP. Two studies conducted in the United States report prevalence rates of 12% (N=418) and 15.5% (N=297).31,32 The small size of our sample prevents comparison with these findings. We did not perform a factor analysis for bone fractures since the study variables were not evaluated at the time of fracture.
No association was found between bone mineral density and 25(OH)D levels, although the former improves with vitamin D supplementation.7,19,27,33–35 In line with the available evidence, vitamin D supplementation is regarded as a measure potentially affecting bone mineral density; experts recommend calcium and vitamin D supplementation in these patients.23,24 Vitamin D doses in our sample were similar to those recommended for the general paediatric population (400-600IU/day); risk populations are advised to take 600-1000IU/day.36 The main goal of vitamin D supplementation is to achieve vitamin D sufficiency; 25(OH)D concentrations should be closely monitored.23,24 Weight-bearing activities, such as assisted standing, may improve or maintain bone mineral density; the effectiveness and indications for this type of intervention are currently under study.23,24,37
Adequate 25(OH)D levels are associated with multiple benefits, including a lower risk of respiratory tract infections, according to studies on the general paediatric population.38
Serum ferritin concentrations reflect iron deposits, acting as an early marker of iron deficiency; however, determination of ferritin is not routinely performed in all public hospitals. None of our patients presented anaemia, although half of the sample showed low ferritin concentrations, in line with the data reported in other studies. These patients have been found to have a lower iron intake, low serum iron and ferritin concentrations, and iron-deficiency anaemia. Factors associated with low ferritin levels include male sex, older age, feeding by gastrostomy, and high proportion of milk intake; the first 3 factors were observed to be significantly associated with low ferritin levels in our study.1,4,8,39 Another factor associated with anaemia is gastro-oesophageal reflux, which may cause chronic blood loss secondary to oesophagitis: a study of patients with CP found more cases of anaemia and malnutrition among patients with gastro-oesophageal reflux than among those without.40 Ferritin concentrations should therefore be closely monitored.
One limitation of our study is that the sample was relatively homogeneous in terms of GMFCS level; the fact that most of our patients had moderate-to-severe gross motor dysfunction may have limited the association between GMFCS level and nutritional deficiencies. Our sample was drawn from medium-to-low-income populations, which prevents us from generalising our results.
In conclusion, we identified a high frequency of vitamin D deficiency and low ferritin levels in children and adolescents with moderate-to-severe CP, and analysed some of the associated risk factors. Vitamin D and iron levels should be determined in these patients, given the availability of pharmacological treatments for vitamin D and iron deficiency, which may improve overall health in this vulnerable patient population.
FundingThis study was funded by the Nutrition section of the Chilean Society of Paediatrics and FONDECYT 1131012 (M. Álvarez).
Conflicts of interestThe authors have no conflicts of interest to declare.
Please cite this article as: Le Roy C, Barja S, Sepúlveda C, Guzmán ML, Olivarez M, Figueroa MJ, et al. Deficiencia de vitamina D y de hierro en niños y adolescentes con parálisis cerebral. Neurología. 2021;36:112–118.
This study was presented in poster format at the 55th Congress of the Chilean Society of Paediatrics in Puerto Varas, Chile, 2015.
articles

Neurología (English Edition) follows the Recommendations for the Conduct, Reporting, Editing and Publication of Scholarly Work in Medical Journals