

This article analyses the diffusion of milk consumption in Spain between 1865 and 1980, and uses a new statistical approach to estimate consumer groups and their milk consumption. This new methodology shows that these variables increased at different speeds chronologically and geographically. Two main phases can be distinguished in terms of the diffusion of milk consumption. The first phase, between the mid-19th century and the 1950s, was characterised by concentrated consumption in producer regions and big cities and the persistence of stark differences between regions. The second, between the 1950s and the 1980s, was chiefly characterised by an increase in the total number of consumers and the disappearance of these regional differences.
En este artículo, analizamos la difusión del consumo de leche en España entre (1865-1980), tomando en consideración una nueva aproximación estadística para estimar las poblaciones y el consumo de leche en estos colectivos. Con la nueva metodología, mostramos que estas variables aumentaron con diferente intensidad, a lo largo del tiempo y a escala regional. Esta circunstancia nos permite distinguir dos grandes etapas en la difusión de la leche en la dieta. En la primera, hasta los años 1950, destacaría, sobre todo, el aumento del consumo en las poblaciones consumidoras y las grandes ciudades, y la pervivencia de elevados niveles de desigualdad a escala regional. En la segunda, hasta los años 1980, destacaría el aumento del número de consumidores, y la desaparición de aquellas desigualdades.
The European nutritional transition in the 19th and 20th centuries was not only the consequence of an increase in income levels caused by economic growth. It was also caused, perhaps to a greater extent, by significant changes in consumption preferences, as clearly demonstrated by milk consumption.1 As late as the second half of the 19th century, medical specialists and the population in general regarded foodstuffs on the basis of their calorie, protein and fat content, and liquid milk was, therefore, not highly esteemed. By the 1930s, however, milk was considered a staple food throughout Europe. Three factors contributed to increase consumer preference for milk.2 These factors are: (a) scientific advances that identified new nutritional qualities in milk (calcium, vitamins, good-quality proteins) and its bacteriological composition; (b) the development of new methods to slow down its deterioration (pasteurisation, refrigeration, sterilisation); and (c) the implementation of numerous initiatives by public bodies, the sanitary sector and the dairy companies to boost consumption.3
As a result of these changes, milk went from playing a secondary role in the diet of Europeans, especially in the Mediterranean, where climatic conditions were unfavourable, to become a product which was consumed in high quantities. However, while milk consumption in numerous regions of Central and Northern Europe rose above 100 litres/person/year (l/p/y) before World War II, this level was not reached in Spain until the 1980s. Moreover, during this process national consumption figures tended to converge, and eventually levelled out around 100/p/y during the second half of the 20th century.4 This trend is also attested in Spain on a regional scale. In Spain, regional differences in consumption were still substantial in the 1930s, but they tend to disappear after that time.5
Previous studies on these changes in milk consumption have, however, a significant flaw: they only take into consideration the overall average consumption. This involves assuming that changes in per capita consumption and in the number of consumers are commensurate: that is, that these variables had increased simultaneously and at the same pace. The analysis of the diffusion of new products and services, however, demonstrates that such an assumption is not necessarily justified: the proportion of consumers and their average consumption can change independently of each other.6 This article will examine this circumstance from a new methodological perspective that may be of application to other diffusion processes. With this purpose we shall propose new ways to estimate per capita consumption, consumer populations and milk consumption among these between 1865 and 1981, and we shall re-examine the dissemination of milk consumption in Spain during this period. Ours is, doubtless, a risky approach, and it will have to be fine-tuned in future studies. In our opinion, however, the new methodology that we propose can provide further evidence for the diffusion of milk consumption, and of the different converging and diverging trends at a regional scale. We also expect our results to trigger new research hypotheses both in Spain and in other European countries.
In order to achieve these targets, the text is divided into three sections. The first is methodological in nature, and is divided into two parts: (a) a critical examination of the statistical sources used in the analysis; and (b) a brief explanation of the methodological strategy followed for estimating consumer groups and the consumption of milk among them. The second section presents new indicators for the three key variables in Spain, and proposes a new sequence of the diffusion of milk consumption in this country between the mid-19th century and 1981. The third sections analyses provincial and regional trends and their main differences. The conclusions compare our results to those obtained by other studies and propose future avenues of research. In order to make the text more readable, the statistical references are presented in an Appendix.
2Sources, estimations and methodologyIn our study, we shall take into consideration the consumption of all forms of liquid milk: that is, cow and goat milk (which could reach the consumer either without having undergone any preliminary treatment or after pasteurisation, sterilisation and/or bottling), as well as evaporated and powdered milk. Our estimates for these variables may be found in Appendix 1. In the following paragraphs, we shall make reference only to their more significant features. Until the mid-1950s, the Spanish population consumed almost exclusively cow and goat milk, but statistics offer evidence concerning only its production and commercialisation. Like other studies, for the period 1865–1955 only apparent consumption can be estimated and do not take into consideration product loss throughout the distribution chain. These estimates will be based on livestock censuses undertaken by different agencies in 1865, 1925 and 1933, and annual production statistics issued by the Ministry of Agriculture between 1954 and 1957.7 Furthermore, these statistics offer uneven information on the number of animals and their productivity, the quantity of milk consumed by calves and kids and the destination of the net milk produced (direct consumption or industrial uses); for this reason, some preliminary estimates have had to be calculated. These estimations affect especially the years 1865 and 1933.
The livestock census of 1865 provides information on the total number of bovine and caprine units and their distribution by sex, age and productive use, but not on the production of milk or its final destination. In addition, the available information does not include the total number of adult cows and goats. This lack of information is particularly problematic with regard to cows, which were, by far, the main source of milk in Spain (Appendix 1.1). In order to estimate apparent consumption, therefore, we have had to estimate the number of adult animals, their productivity and the proportion of the production used in calf-rearing. For this purpose, we assume: that 50% of calves born were female,8 that 66% of female goats were older than two years, and that the data provided by the Junta Consultiva Agronómica in 1891 on yields and the consumption of rearing animals can be extrapolated to 1865. As is well known, in the late 19th century the Spanish agricultural sector specialised in the production of cereal and other vegetal foodstuffs, and the stock-breeding sector was largely focused on the production of working animals and meat.9 Meat usually from adult animals. Different studies have also shown that the number of bovine animals and the breeds used did not change significantly in 19th century.10 Concerning the estimates for 1865, finally, we also assumed that only a small proportion of the net yield was used for the production of cheese and butter, and is not considered here. As illustrated in Appendix 1.1: (a) milk production was very low in most Spanish regions; and (b) the amount of milk used for calf-rearing was very high. In the 1920s and 1930s, in addition, although net milk production was much higher, the production of dairy products was still very low.
It is also important to note that stock-keeping statistics did not always include urban milk production, probably because those in charge of data-compilation (the engineers of the Junta Consultiva Agronómica) regarded the keeping of urban dairies as an industrial, rather than an agrarian, activity. This is clearly the case with the 1933 figures for Madrid and Barcelona.11 By this time, milk consumption was already quite high in these cities, and the urban dairies were a major source of milk. These points were less relevant in other provinces. In the central and southern regions, urban milk consumption was still very low in 1933. In the northern stock-keeping regions, the relative importance of urban dairies was always much smaller than in Barcelona and Madrid.12 This is probably also applicable to Valencia and other eastern cities, which bordered on extensive huertas (irrigated agricultural landscape). Most of the milk consumed in Valencia came from that area and was included in the statistics.13 For all these reasons, only the information concerning Barcelona and Madrid has been adjusted, with the addition of the production of urban dairies to net provincial production: 29 and 20 million litres respectively.14
Finally, it is likely that our estimate of apparent milk consumption in 1955 (1954–1957) is too low, and thus we should be cautious when dealing with data between 1955 and 1965. It is possible that the consumption of powdered and condensed milk already increased as early as the 1950s, but reliable estimates are impossible.15 Likewise, the data available does not allow us to determine to what extent was urban milk consumption estimated in the new statistics elaborated by the ministry.16
From 1965 onwards, the data available are more reliable because Encuestas de Presupuestos Familiares (FBS; Family Budget Surveys) provide direct milk consumption data. The 1965 FBS, however, did not take into consideration powdered and condensed milk, and we have had to estimate it. For this purpose, we have used the information collected by the Instituto Nacional de Estadística in 1969. In conclusion, stock-breeding statistics only allow for a reasonably accurate estimation of milk consumption for 1865, 1925, 1933 and, less accurately, for consumption in 1955. IN addition, for this period, statistics only allow for the estimation of apparent consumption. Between 1965 and 1981, in contrast, the data reflect real consumption. The dearth of information for the periods 1865–1925 and 1933–1955 is, in any case, of little relevance for our purposes. As shown by previous studies, until the early 20th century milk consumption was very low in Spain. Afterwards, milk consumption increased continuously until the 1930s, decreased during the Civil War and post-war years, and increased again from the 1950s onwards.17 Similarly, the use of apparent consumption data before 1955 and of the FBS from 1965 onwards does not cause difficulty. The differences between apparent consumption and that reflected in the FBS for the late 1960s are not so wide.18 Furthermore, it is no longer justified to continue using apparent consumption estimates for 1965 and 1981. We must not forget that the interprovincial milk trade increased continuously from the 1950s onwards, and that this is only reflected in the FBS. Until the 1930s, this trade was close to inexistent, and could have decreased even further during early Francoism.19
Finally, we must point out that some of the changes detected on milk consumption at the provincial level (Appendix 1), will need to be confirmed by future research, but that this has little effect on subsequent estimates concerning consumer populations and milk consumption among these. For instance, for the period 1925–1933, our data suggest that milk consumption decreased in Oviedo and Santander, but that it always was above 200l/p/y. Similar trends, however, can also be detected in Switzerland in this same period, and after World War II in other countries where consumption was high.20 Conversely, the reduction in consumption attested in Huesca and León is of little relevance because milk consumption in these provinces was always very low. Concerning the increase in milk consumption in Gerona, La Coruña, Salamanca or Málaga, there is not much more evidence available. In Gerona, however, we know that milk consumption in the capital was around 25l/p/y shortly before World War I, and that in the 1930s consumption rocketed to over 80l/p/y. The consumption in hospital institutions also increased significantly in the province. In the hospital of Sant Jaume, in Olot, milk consumption was less than 5l/patient/year in 1885, and shortly before the Civil War was 180l.21 Concerning the period 1955–1965, it should not be surprising that milk consumption increased quickly in central and southern provinces. On the one hand, the interprovincial milk trade was increasing during that period, and local production in many of these provinces was also on the rise. On the other hand, migration from these regions intensified in the 1950s and 1960s, as did the urbanisation process. As a consequence of these phenomena, the population increased but only a little in Andalusia, Murcia and Aragón, and decreased in Extremadura and both Castiles. At the same time, the proportion of the population living in cities with over 100,000 inhabitants increased from 45% to 60% between 1940 and 1970.
In order to carry out our calculations of the two new variables that we propose, we shall follow the methodology proposed by Muñoz Pradas (2011) in Histoire & Measure. The most technically relevant aspects of this proposal are synthesised in Appendix 3. The following pages will merely examine the methodology from a conceptual perspective. We hope that, by choosing this way to present our study, we shall help historians to appreciate the basic outlines of our proposal while giving those with statistical knowledge enough material to revise our figures.
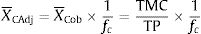
The estimation of total average consumption, per person per year (or any other time unit), it is a useful variable, but limited in scope. For instance, let us assume two provinces A and B, with the same population (100,000), but with different consumption levels. A consumes 7 million litres, and the average consumption is, therefore, 70l/p/y. B consumes 130 million litres, and the average consumption is 130l/p/y. The automatic conclusion is that per capita consumption in B is higher than in A. However, if the proportion of consumers in A is 50% of the total population and 100% in B, that means the average consumption among consumers in A is higher (140l/p/y) than in B (130l/p/y). This is due, obviously, to the fact that the average consumption, as reflected in the statistics (X¯Cob), is the total milk consumption (TMC) divided by total population (TP), and that, when the consumer population (CP) is less than the TP, the resulting statistical average is lower than if only the CP was taken into consideration. This average will be referred to as adjusted consumption (X¯CAj). In formal terms:
If observed consumption is
and adjusted consumption isthe relationship between these coefficients iswhere fc=CP(Consumer Population)/TP(Total population) is the ‘correction factor’, or the proportion of consumers in the total population. If fc=1, then the two estimations of consumption per capita in the expression (1) are identical. If fc is less than 1, then observed consumption is lower than adjusted consumption (fc cannot be higher than 1).

The distinction between observed and adjusted consumption is relevant not only in statistical terms but also in analytical terms because it reflects those factors which affected the evolution of per capita consumption (observed consumption) most directly: in expression (1), the ‘correction factor’ (proportion of consumers) and ‘adjusted consumption’ (average consumption among the consumer population). In order for expression (1) to be practicable, however, the consumer population must be estimated beforehand, or the expression would include two unknown variables. In this regard, our methodology relies on a first indirect estimation of adjusted consumption which is based on three assumptions that we regard as reasonable. These assumptions refer to the format and frequency of liquid milk consumption, the diffusion process of the product and the statistical model used in order to represent the distribution of consumption among the total population. These variables will be used to estimate the adjusted consumption and, with the aid of the available data on observed consumption and total population, also to estimate the consumer populations solving expression (1).
Concerning the format of milk consumption, we shall assume that consumer groups drank milk from containers of around 250ml or fractions thereof.22 This is a reasonable assumption because milk was generally drunk from mugs, glasses or other similar containers of this approximate capacity (or half). We shall also assume that milk was drunk on a daily basis, or at least on alternate days; a more sporadic consumption pattern would require conservation techniques that would not become available until well into the 20th century. The evidence provided by local doctors (medical-sanitary topographies) between the mid-19th century and the 1930s, and in a wide variety of studies and surveys, supports this assumption.23 These texts, also, distinguish between three types of consumer: (a) those who never drank milk; (b) those who drank milk only when they were proscribed liquid diets (for example, as a consequence of an illness); and (c) those who drank milk frequently.24 Based on this, we may assume that, in the second half of the 19th century, there were already social groups which consumed milk habitually and which drank it from 250 or 125ml containers. Thus, we understand that an observed average consumption of, say, 13l/p/y (35ml/p/day), in a given province and year, is more reflective of the existence of an elevated percentage of non-consumers than of the occasional consumption of most of the population. Similarly, if observed consumption is 130l/p/y (356ml/p/day), we shall assume that milk consumption was habitual among the majority of the population.
Concerning milk consumption diffusion patterns, we presume that they will follow Rogers’ (2003) ‘diffusion of innovation’ trends. In the most simplified version of these statistical models, those processes are divided into three sequential stages – initial, intermediate and final – among which the population is distributed according to a Standard Normal Distribution. Following Rogers, we shall begin by assuming that the proportion of consumer population was initially between 2.5 and 13.5% of the population (‘early adopters’), that in the intermediate phase this proportion would reach 50% and that the process would be completed during the final stage. It has to be taken into account that, in the long term, diffusion processes are irreversible.25 Some historical evidence supports our assumption. According to recent research, in the late 19th and the early 20th centuries milk consumption was habitual among high-income groups or in stockbreeding areas in the north of Spain,26 but negligible among the rest of the population. Later, consumption increased, but not evenly. This was partially due to the incorporation of new groups into the category of consumers: children and young people, chiefly, at an early stage, and healthy adults later (Nicolau and Pujol-Andreu, 2008).
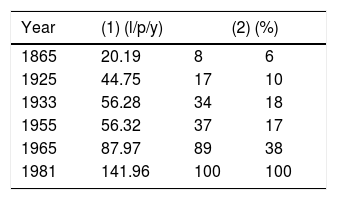
Also, a new piece of evidence concerning of this diffusion pattern is the proportion of the population that could have consumed between 125 and 250ml of milk daily between 1865 and 1981, assuming that nobody else consumed milk. Table 1 shows that the proportion of the population that could have consumed those quantities of milk closely matches the proposed trend for innovation diffusion processes. Around 1865, the proportion of the population that could drink milk habitually would be below 10% (initial phase). Afterwards, consumer populations could have increased to between 20% and 30%, shortly before the Civil War, and to 40y 60% in the 1960s (intermediate phase), covering the practical totality of the population in the 1980s (final phase).27 Concerning the initial diffusion of milk consumption among children, the references to the founding of Milk Depots (Gota de Leche) and other promotion campaigns in schools and charitable institutions in the first third of the 20th century are abundant.28
Observed consumption (1) and population that could consume between 125 and 250ml per day (2): Spain, 1865–1981.
| Year | (1) (l/p/y) | (2) (%) | |
|---|---|---|---|
| 1865 | 20.19 | 8 | 6 |
| 1925 | 44.75 | 17 | 10 |
| 1933 | 56.28 | 34 | 18 |
| 1955 | 56.32 | 37 | 17 |
| 1965 | 87.97 | 89 | 38 |
| 1981 | 141.96 | 100 | 100 |
Concerning our third assumption (the statistical model), we suggest that milk consumption patterns respond to a log-normal distribution. This distribution is often used for the modelling of economic activities and the consumption of products and services (Lawrence, 1988), and it is also frequently used in historical nutrition analysis (Fogel, 1992; Floud et al., 2011). Following this line of thought, we estimate the distribution of consumer population using the density function:
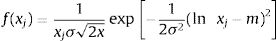
This expression, f(xj), represents the total population that consumes daily a xj quantity of milk; and ‘m’ and ‘σ’ refer to the average and the standard deviation of consumption distribution among the total population.29 This modelling of milk consumption patterns will be used for two different purposes. Firstly, in this section, in order to simulate consumer distributions on the basis of hypothetical provincial adjusted consumption averages and standard deviations. These simulations will allow us to obtain the average adjusted consumption levels at the beginning of the diffusion process. Secondly, in the next section, we shall apply the model in order to reconstruct the distribution of milk consumption among consumer groups, after estimating adjusted consumption. Finally, it is worth stressing that log-normal distribution allows for the representation of asymmetrical distributions, which is particularly useful in the analysis of consumption habits. In these processes, averages and modes can change drastically and even follow diverging trajectories.
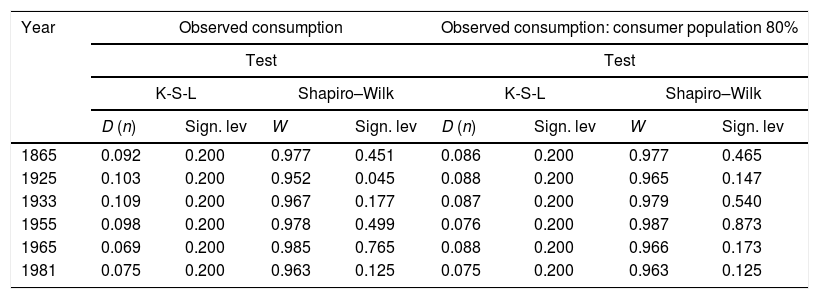
The only way to test the reliability of the third assumption, given the lack of individual data, is through the observed average consumption on the provincial level. As previously noted, these averages are calculated for the total population of each province and do not take into consideration, therefore, the specific consumer groups to which the assumption applies. In our opinion, however, we can assume that the range of variation of average consumption among consumer populations will be lower than among the whole population, at least up to consumption levels which are in the range of 250ml/day (91l/p/y). In order to explore this, we extend the initial normality contrast to provincial distributions in which the overall average consumption increases but is always below 91l/p/y, and assuming consumer populations that represent 80%, 60% and 40% of the total population. This exercise is presented in Table 2.30 The result is significant, with the exception of Shapiro–Wilk test for 1925 (0.045) and 1965 (0.017, assuming a consumer population of 40%). In both cases, the level of significance is above 1% but below 5%, and the null hypothesis must be accepted.31 In the rest of cases, the null hypothesis of normality is not rejected at the usual levels of significance. It is reasonable, therefore, to assume that milk consumption followed that distribution model.
Spain (1865–1981): distribution of provincial observed milk consumption. Normality tests for observed consumption and different adjustments made in order to reflect the proportion of consumer groups.
| Year | Observed consumption | Observed consumption: consumer population 80% | ||||||
|---|---|---|---|---|---|---|---|---|
| Test | Test | |||||||
| K-S-L | Shapiro–Wilk | K-S-L | Shapiro–Wilk | |||||
| D (n) | Sign. lev | W | Sign. lev | D (n) | Sign. lev | W | Sign. lev | |
| 1865 | 0.092 | 0.200 | 0.977 | 0.451 | 0.086 | 0.200 | 0.977 | 0.465 |
| 1925 | 0.103 | 0.200 | 0.952 | 0.045 | 0.088 | 0.200 | 0.965 | 0.147 |
| 1933 | 0.109 | 0.200 | 0.967 | 0.177 | 0.087 | 0.200 | 0.979 | 0.540 |
| 1955 | 0.098 | 0.200 | 0.978 | 0.499 | 0.076 | 0.200 | 0.987 | 0.873 |
| 1965 | 0.069 | 0.200 | 0.985 | 0.765 | 0.088 | 0.200 | 0.966 | 0.173 |
| 1981 | 0.075 | 0.200 | 0.963 | 0.125 | 0.075 | 0.200 | 0.963 | 0.125 |
| Year | Observed consumption: consumer population 60% | Observed consumption: consumer population 40% | ||||||
|---|---|---|---|---|---|---|---|---|
| Test | Test | |||||||
| K-S-L | Shapiro–Wilk | K-S-L | Shapiro–Wilk | |||||
| D (n) | Sign. lev | W | Sign. lev | D (n) | Sign. lev | W | Sign. lev | |
| 1865 | 0.083 | 0.200 | 0.977 | 0.452 | 0.084 | 0.200 | 0.975 | 0.370 |
| 1925 | 0.082 | 0.200 | 0.970 | 0.234 | 0.077 | 0.200 | 0.975 | 0.362 |
| 1933 | 0.069 | 0.200 | 0.987 | 0.853 | 0.065 | 0.200 | 0.988 | 0.897 |
| 1955 | 0.069 | 0.200 | 0.989 | 0.933 | 0.069 | 0.200 | 0.989 | 0.926 |
| 1965 | 0.101 | 0.200 | 0.962 | 0.110 | 0.109 | 0.200 | 0.942 | 0.017 |
| 1981 | 0.075 | 0.200 | 0.963 | 0.125 | 0.075 | 0.200 | 0.963 | 0.125 |
K-S-L: Test Kolgomorov–Smirnov–Lilliefors.
Source: Authors’ own after indications contained in the text.
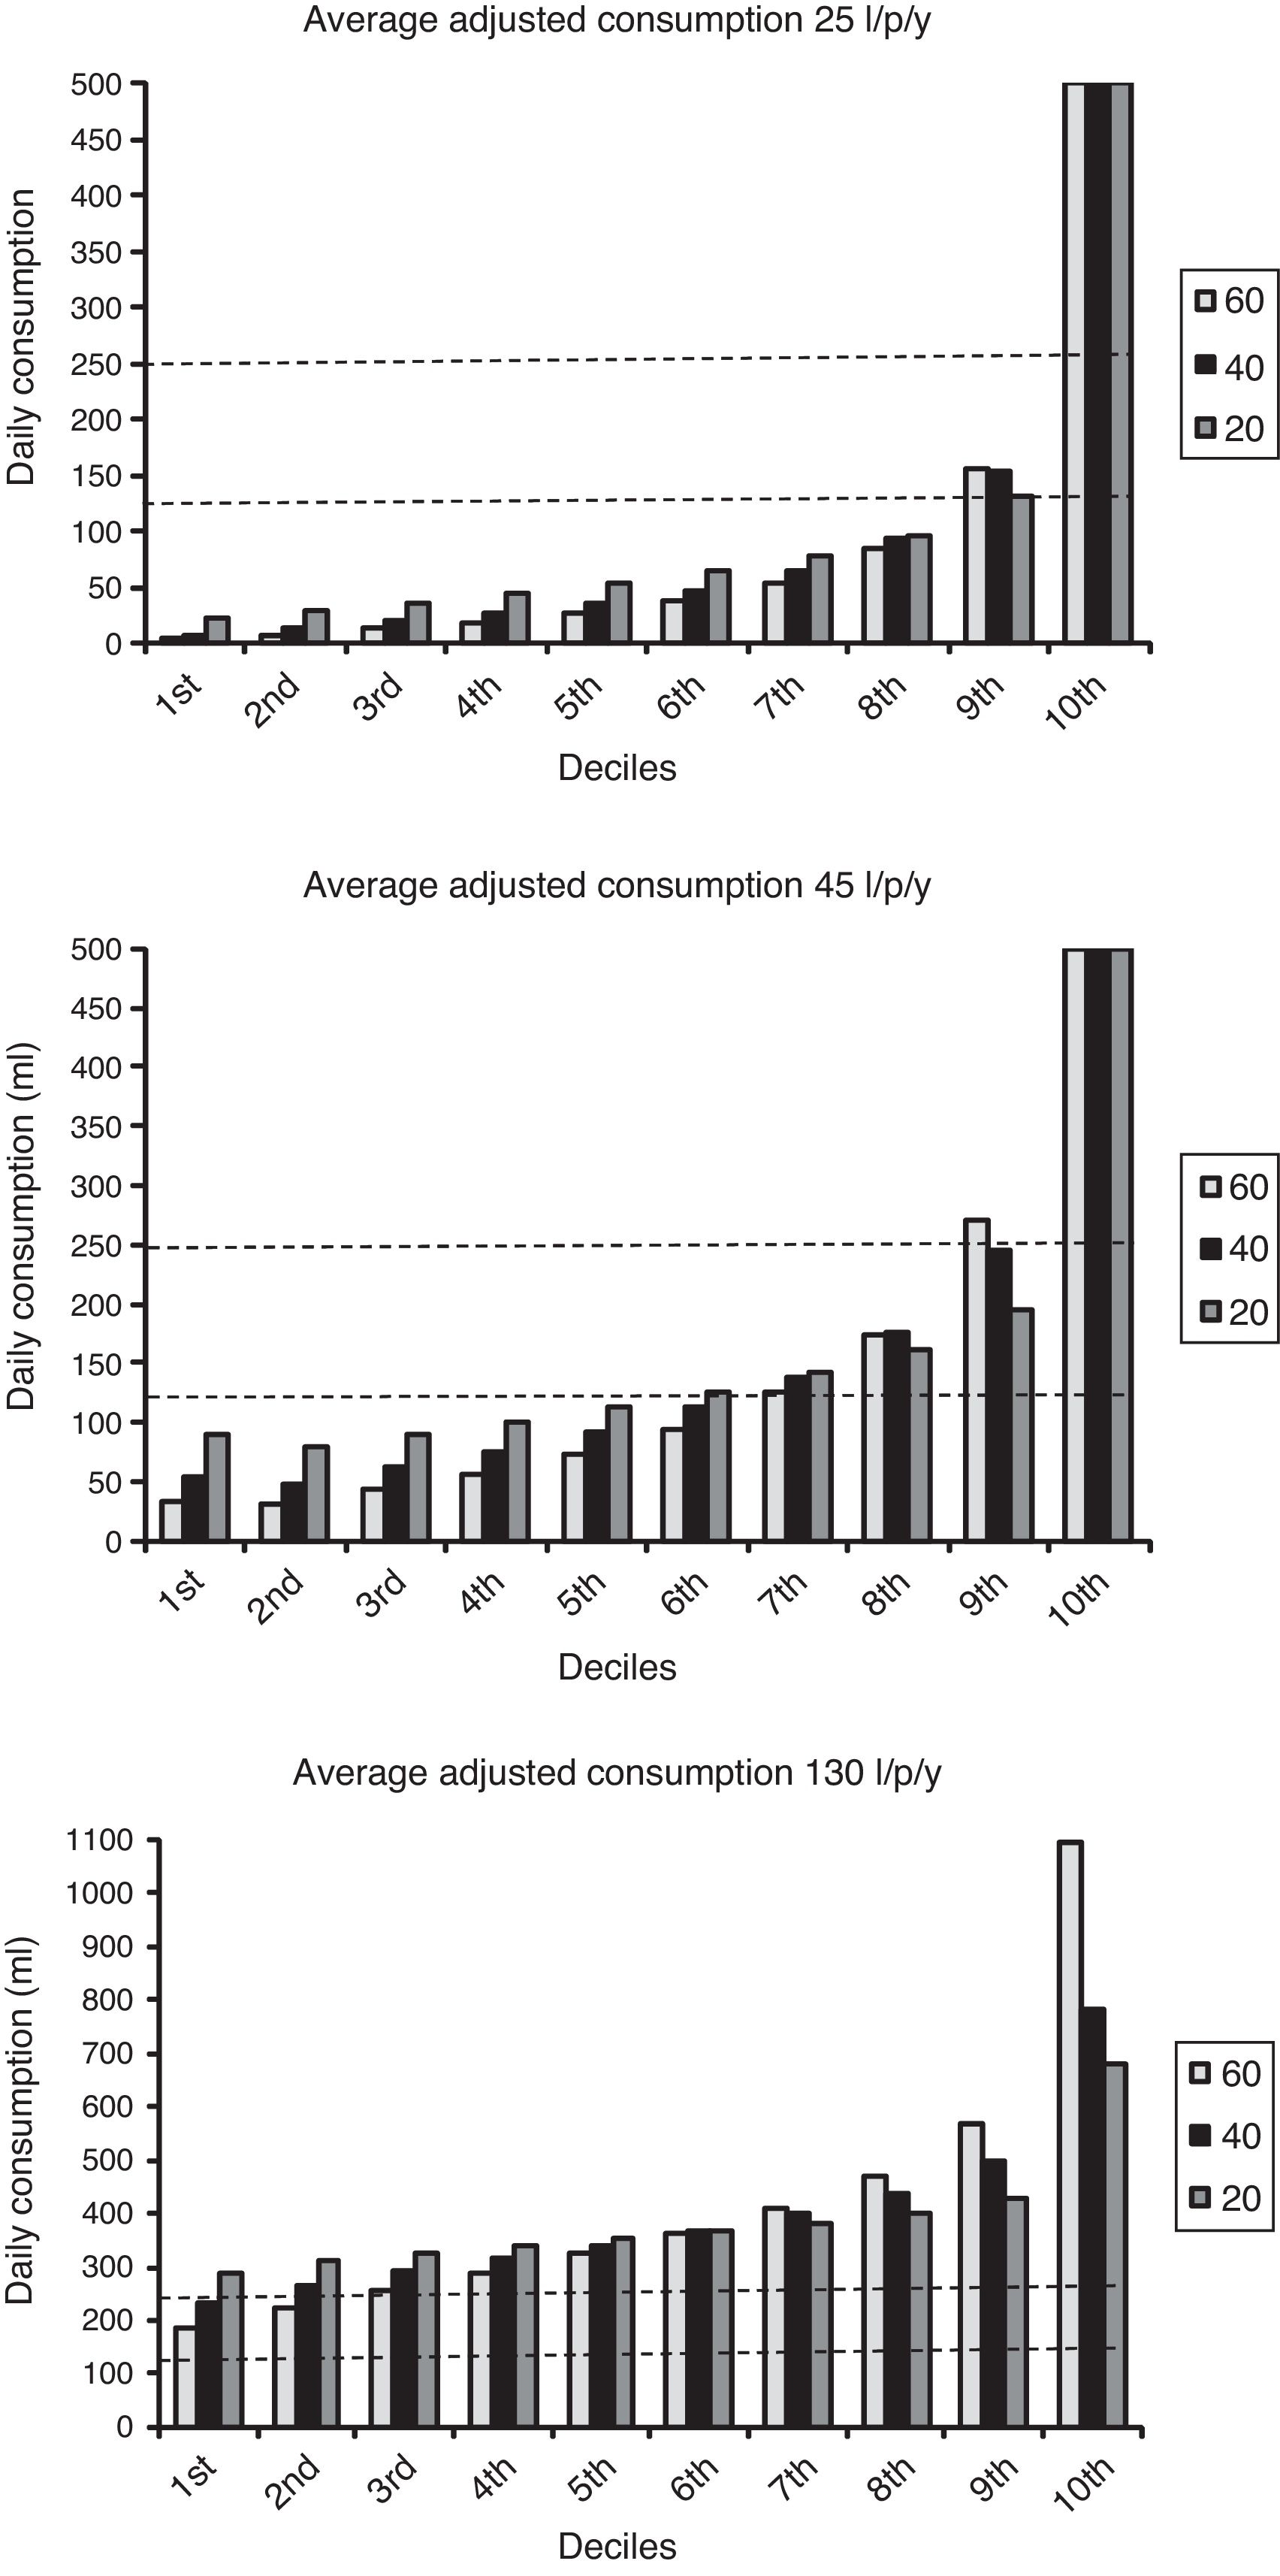
Once our assumption is accepted, the next step will be to use the log-normal distribution in order to estimate the adjusted consumption among consumer populations. In this way, we shall be able to estimate the proportion of consumer populations which correspond to given levels of adjusted consumption, always assuming that consumption was, as a minimum, in the range of 125–250ml/p/day (our first assumption). Fig. 1 presents the different levels of daily consumption among consumer populations, with an average level of adjusted total consumption of 25, 45 and 130l/p/y, and a standard deviation of 20, 40 and 60l. We suggest that these magnitudes accurately reflect most possible variations in adjusted consumption on the provincial level in the 20th century.32 The horizontal lines indicate adjusted consumption levels between 125 and 250ml/p/day, and those above 250ml.

The results of these simulations indicate that an adjusted total consumption level of 25l/p/y means that barely 10% of the population consumed 125ml of milk or more daily. If we consider 45l/p/y, at least a quarter of the population (two deciles and a fraction of the third), could consume the equivalent of half a mug of milk daily, or a mug every two days. That is, the former figures equate to the ‘early adopters’ stage while the second to the intermediate phase.33 According to the simulation, an average of 130l/p/y indicates that the adjusted total consumption would approach 250ml, and that some groups (the top three deciles) could even reach half a litre. These magnitudes indicate generalised milk consumption.
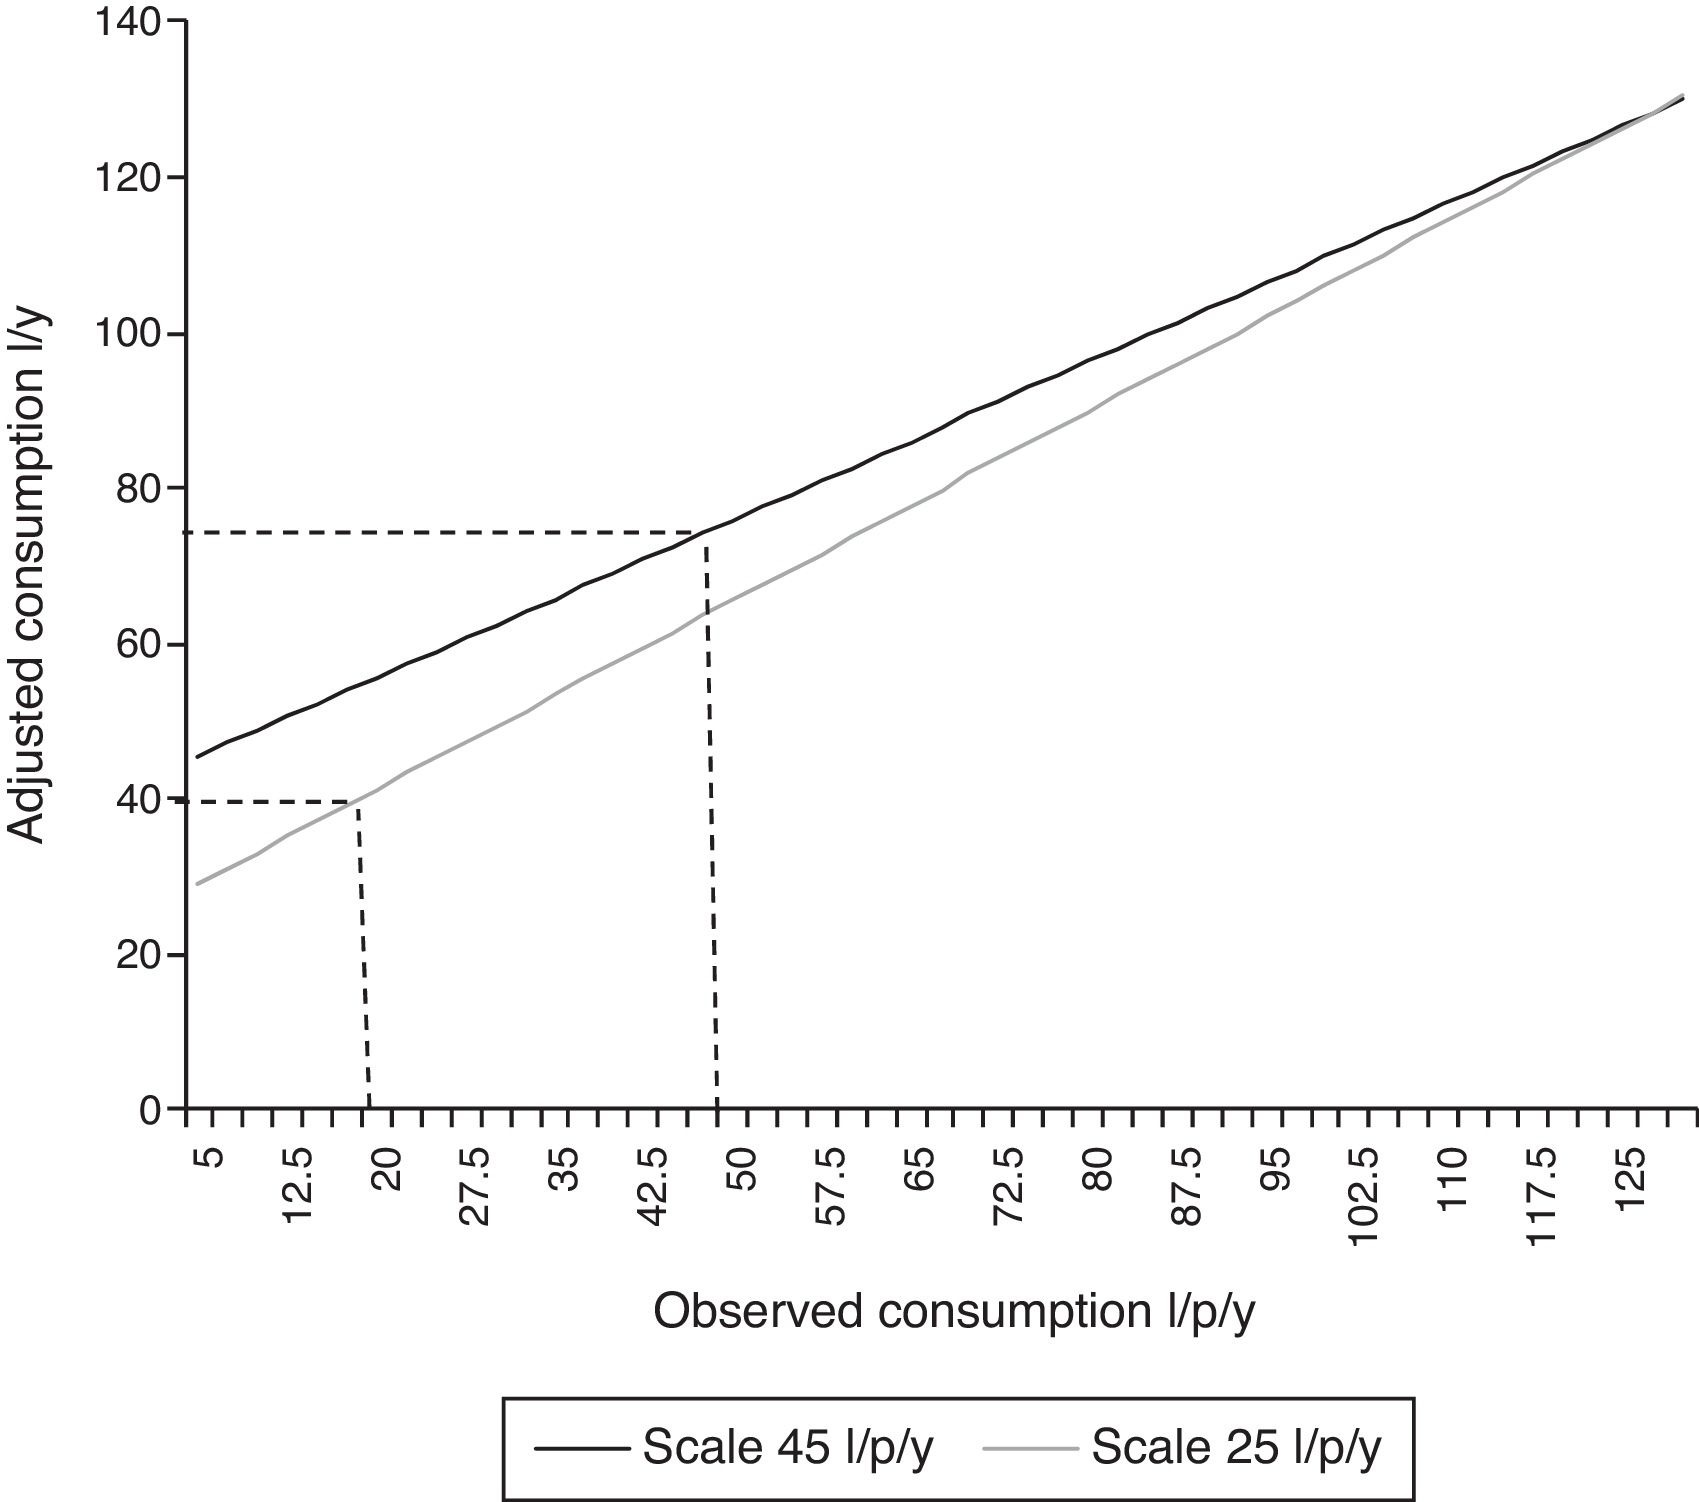
On the basis of the simulations and our assumptions concerning the diffusion of milk consumption, we shall adopt therefore as characteristic consumption levels among consumer groups 25l/p/y for the mid-19th century, and 45l/p/y for the early decades of the 20th century. These two magnitudes will be used as initial levels of adjusted consumption, in two lineal scales progressing towards 130l/p/y. These scales cover, according to the available information, the potential consumption patterns in the 19th and 20th centuries. The values corresponding to these scales are tabulated in Appendix 2 and represented in Fig. 2.

This figure also illustrates the adjustment applied for a given amount of milk consumed, based on the statistics (horizontal axis), to the amount of milk supposedly consumed by the consumer population (vertical axis), according to our second assumption regarding the diffusion process. For example, an average observed consumption of 50l/p/y would correspond to an average consumption among the consumer population (adjusted consumption) of nearly 80l/p/y. These adjustments will be applied to all estimations of average observed consumption in the provincial level, and will be the starting point for the methodology developed in Section 2. As an illustration, Appendix 3 explains our estimates of provincial consumer populations and their consumption levels in 1925.
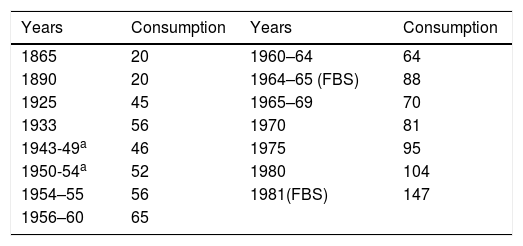
3Milk consumption in Spain: evolution and distributionTable 3 summarises the main trends in observed milk consumption in Spain since 1865 (without considering consumer populations). As can be appreciated, consumption increased chiefly during two periods, between the late 19th century and the Second Spanish Republic and in the second half of the 20th century. Observed consumption remained low throughout the 19th century, and never surpassed 20l/p/y. During the 20th century, consumption grew progressively and reached 56l in the 1930s; it decreased in the following decade and did not reach pre-Civil War levels until the mid-1950s. After that, consumption grew again in a sustained manner until it broke the 100l/p/y barrier.34
Observed milk consumption: Spain, 1865–1981 (l/p/y).
| Years | Consumption | Years | Consumption |
|---|---|---|---|
| 1865 | 20 | 1960–64 | 64 |
| 1890 | 20 | 1964–65 (FBS) | 88 |
| 1925 | 45 | 1965–69 | 70 |
| 1933 | 56 | 1970 | 81 |
| 1943-49a | 46 | 1975 | 95 |
| 1950-54a | 52 | 1980 | 104 |
| 1954–55 | 56 | 1981(FBS) | 147 |
| 1956–60 | 65 |
In these cases, the source presents a single figure, which includes the quantity of milk earmarked for human consumption and the quantity consumed by rearing animals; we have assumed that the former amounted to 65% of the total. See Anuario Estadístico de España (1943–54).
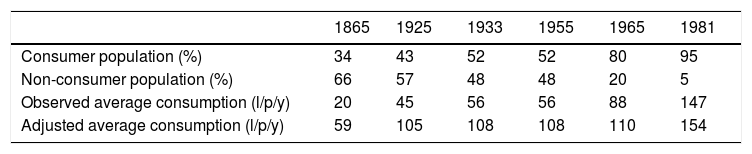
If we apply our methodology here, we appreciate that the significance of the two variables that we have estimated – consumer population and their average milk consumption (adjusted consumption) – is very different.35 According to our estimates (Table 4), in the late 19th century most of the Spanish population did not consume milk on a daily basis, and although this situation improved over the three following decades, this improvement affected only some social groups. Around 1865, the percentage of consumer population was still below 35%,36 increasing later until it reached between 40% and 45% in the mid-1920s, and nearly 50% during the Second Spanish Republic. Consumption among consumer populations (adjusted consumption), conversely, must have grown considerably. Around 1865, the average consumption among these groups in the whole of Spain would be close to 60/l/p/y, and around 110l/p/y in 1925 and 1933. Finally, from the 1950s onwards, consumption increased again, but owing to two different circumstances. Until the mid-1960s, the increase in consumption was largely due to the growth of consumer populations. After this, consumption chiefly grew due to the increase in consumption within consumer groups. Between 1955 and 1965, the adjusted average consumption remained almost the same, while the proportion of daily consumers grew from 50% to nearly 80% of the total population. Between 1965 and 1981, the proportion of consumer populations reached its biological maximum,37 and the average adjusted consumption grew by nearly 30% (from 110 to 143l/p/y).
Basic statistical data concerning milk consumption: Spain, 1865–1981.
| 1865 | 1925 | 1933 | 1955 | 1965 | 1981 | |
|---|---|---|---|---|---|---|
| Consumer population (%) | 34 | 43 | 52 | 52 | 80 | 95 |
| Non-consumer population (%) | 66 | 57 | 48 | 48 | 20 | 5 |
| Observed average consumption (l/p/y) | 20 | 45 | 56 | 56 | 88 | 147 |
| Adjusted average consumption (l/p/y) | 59 | 105 | 108 | 108 | 110 | 154 |
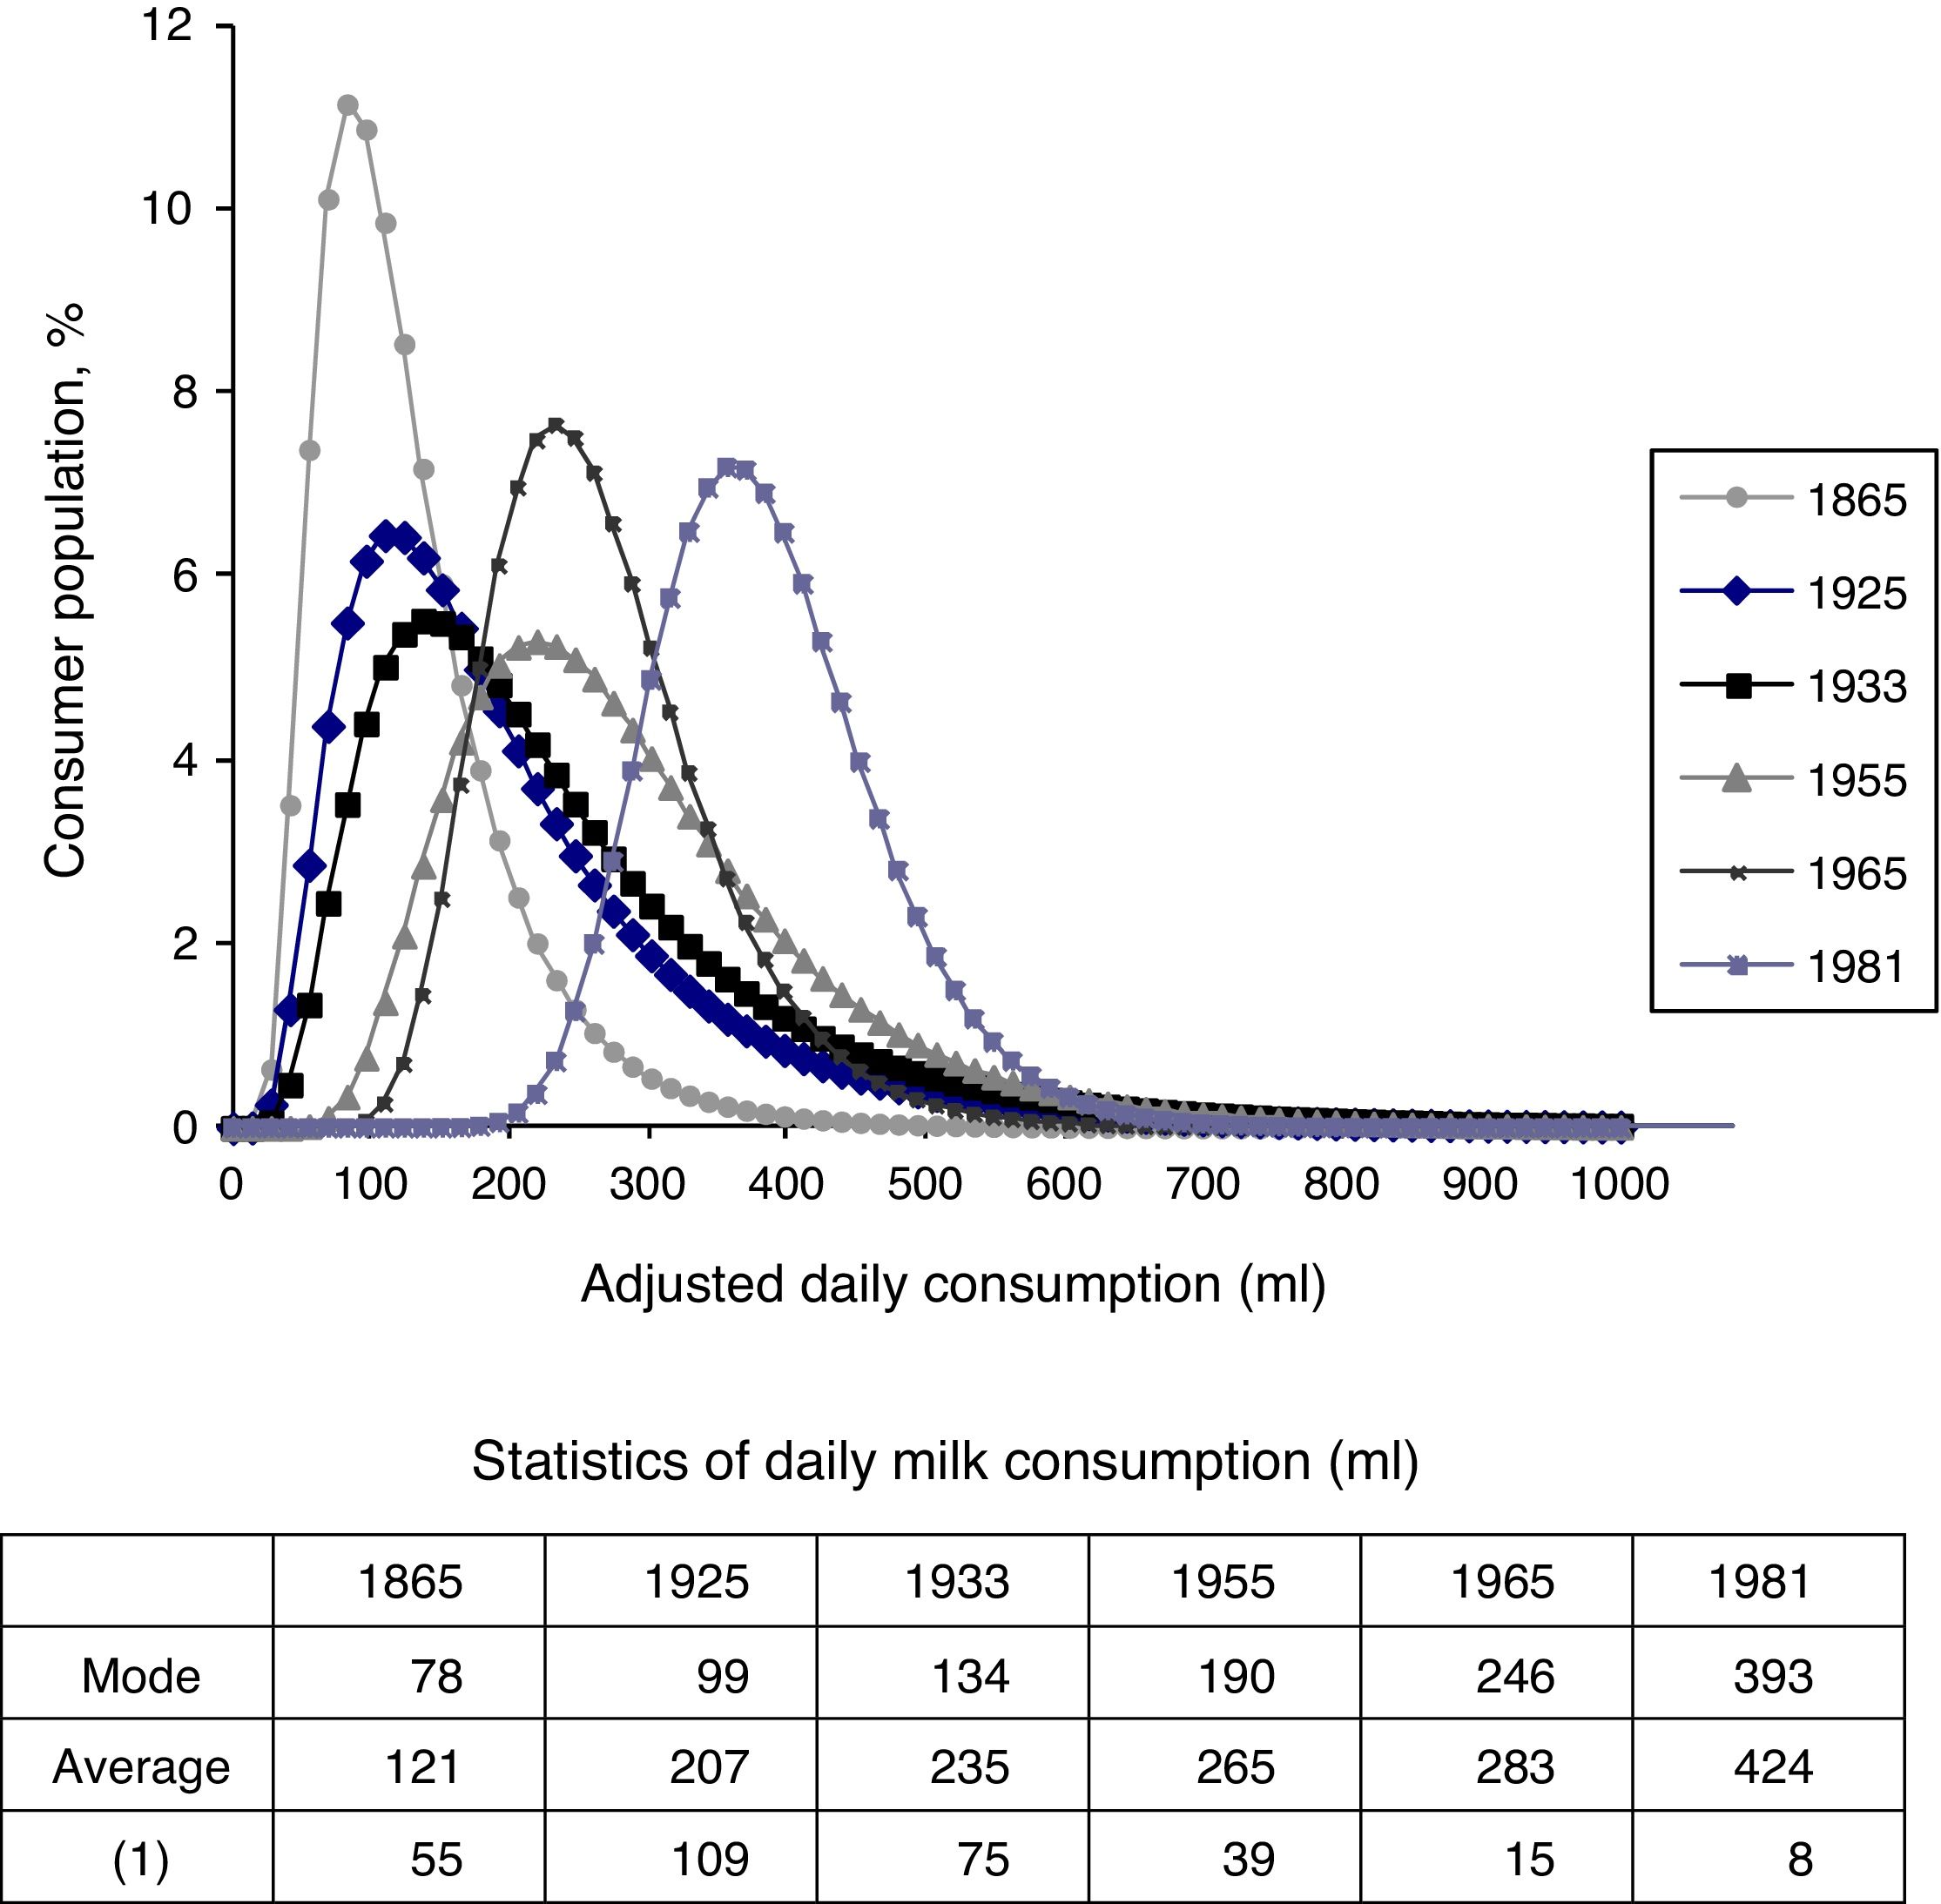
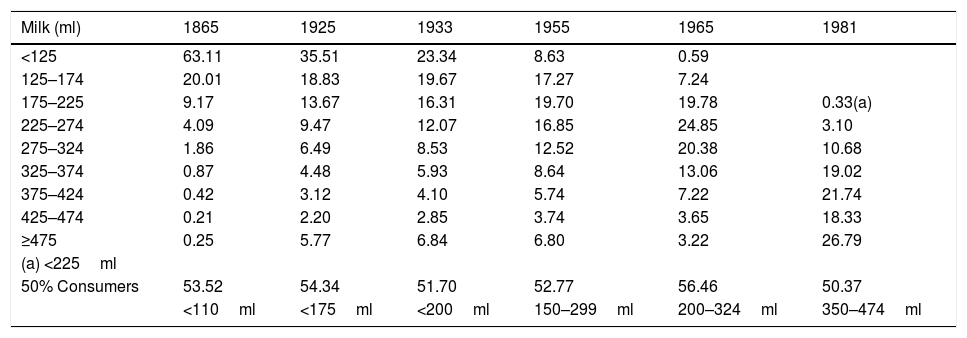
Table 5 and Fig. 3 show the frequency distribution of consumers between different consumption levels, after the application of expression (2) (log-normal model) to the averages and standard deviations of adjusted consumption, previously estimated province by province.38 According to these new indicators, and as could be expected in a context of growing and increasingly generalised consumption: (a) frequency distributions tended to move towards the right, (b) their profile became more symmetrical, and (c) the mode and the average converged (see table associated with Fig. 3). The bottom of Table 5 – the consumption levels of 50% of the consumer population – presents a numerical representation of this trend. These levels increased from under 110ml/p/day around 1865 to almost 200ml in 1933, and more than 350ml in 1981.
Distribution of population according to adjusted consumption levels, 1865–1981 (%).
| Milk (ml) | 1865 | 1925 | 1933 | 1955 | 1965 | 1981 |
|---|---|---|---|---|---|---|
| <125 | 63.11 | 35.51 | 23.34 | 8.63 | 0.59 | |
| 125–174 | 20.01 | 18.83 | 19.67 | 17.27 | 7.24 | |
| 175–225 | 9.17 | 13.67 | 16.31 | 19.70 | 19.78 | 0.33(a) |
| 225–274 | 4.09 | 9.47 | 12.07 | 16.85 | 24.85 | 3.10 |
| 275–324 | 1.86 | 6.49 | 8.53 | 12.52 | 20.38 | 10.68 |
| 325–374 | 0.87 | 4.48 | 5.93 | 8.64 | 13.06 | 19.02 |
| 375–424 | 0.42 | 3.12 | 4.10 | 5.74 | 7.22 | 21.74 |
| 425–474 | 0.21 | 2.20 | 2.85 | 3.74 | 3.65 | 18.33 |
| ≥475 | 0.25 | 5.77 | 6.84 | 6.80 | 3.22 | 26.79 |
| (a) <225ml | ||||||
| 50% Consumers | 53.52 | 54.34 | 51.70 | 52.77 | 56.46 | 50.37 |
| <110ml | <175ml | <200ml | 150–299ml | 200–324ml | 350–474ml | |
 Difference between average and mode in %.")
Our indicators also allow for a clearer appreciation of the singularities of each stage in the diffusion of milk consumption. In 1865, nearly 60% of the consumer populations consumed less than 125ml per day. If we also take into consideration that the mode was 78ml (see table associated with Fig. 3), we shall also conclude that most of the consumption must have been sporadic, as is confirmed by the historical record.39 In 1925, the consumer populations and, mostly, consumption among this group (adjusted consumption) were higher, but a more detailed examination reveals that nearly 75% of the consumer populations drank less than 225ml (one mug) a day, and 34% less than half that Moreover, in 1925, the relative difference between daily consumption mode (99) and average (207) reached its historical maximum (109%). According to our calculations, therefore, this was the period during which inequality in milk consumption in Spain reached its peak. If, finally, we compare the number of consumers who drank over 275ml per day in 1925 and 1933, it is also reasonable to conclude that a selective improvement in consumption must have taken place in the 1930s. In 1933 almost 30% of the population consumed over 275ml of milk per day (22% in 1925), and nearly 7% of the population drank over 475ml (175l/p/y). It is also significant that the differences between mode and average tended to decrease from the mid-1920s onwards.
The trend towards higher levels of consumption among the consumer populations can also be attested for 1955, when the difference between mode and average also shrank substantially. It is, therefore, quite likely that the stagnation of milk consumption in the 1940s and the early 1950s was linked to a significant change in the distribution pattern. Between 1933 and 1955, the percentage of the population that consumed 275ml of milk or more per day increased from nearly 28% to 37%.
The frequency distributions for 1965 and 1981, finally, clearly indicate the increase and generalisation of milk consumption and the progressive reduction of inequality (convergence of mode and average). The data for 1965 correspond to an advanced stage of the nutritional transition process: 25% of habitual consumers consumed between 225 and 274ml/p/day. Around 1980, most people consumed more than 325ml of milk per day, and those who drank less than 275ml made up below 5% of the total population. All of this suggests, in agreement with Collantes (2015), that the 1980s witnessed the beginning of a new trend in milk consumption.
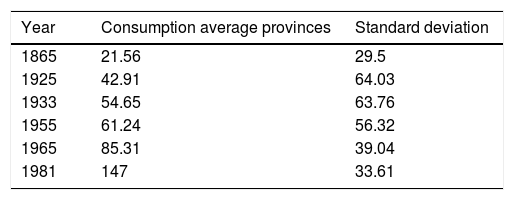
4Territorial diffusion patterns in milk consumption in Spain in the 20th centuryThe diffusion of milk consumption proceeded at a very different pace in different regions. Evidence for this is provided in Table 6, which shows the evolution of provincial aggregate average consumption and the standard deviation. Two issues must be stressed. Firstly, the average consumption increased and the provincial differences shrank. Secondly, this was not a linear process, but follows the characteristic sequence of diffusion processes. An early stage characterised by low and homogeneous average consumption levels was followed by a stage of expansion, in which standard deviation increased and the differences between provinces widened, and by a last stage with higher and converging consumption levels and a decrease in standard deviation: a typical inverted ‘U’ pattern (Williamson, 1965). As can be appreciated, differences became more accentuated until they reached their historical maximum between 1925 and 1933 (divergence stage), and decreased later in a sustained manner until the 1980s (convergence stage).
Observed milk consumption (l/p/y) and standard deviation: Spain, 1865–1900.
| Year | Consumption average provinces | Standard deviation |
|---|---|---|
| 1865 | 21.56 | 29.5 |
| 1925 | 42.91 | 64.03 |
| 1933 | 54.65 | 63.76 |
| 1955 | 61.24 | 56.32 |
| 1965 | 85.31 | 39.04 |
| 1981 | 147 | 33.61 |
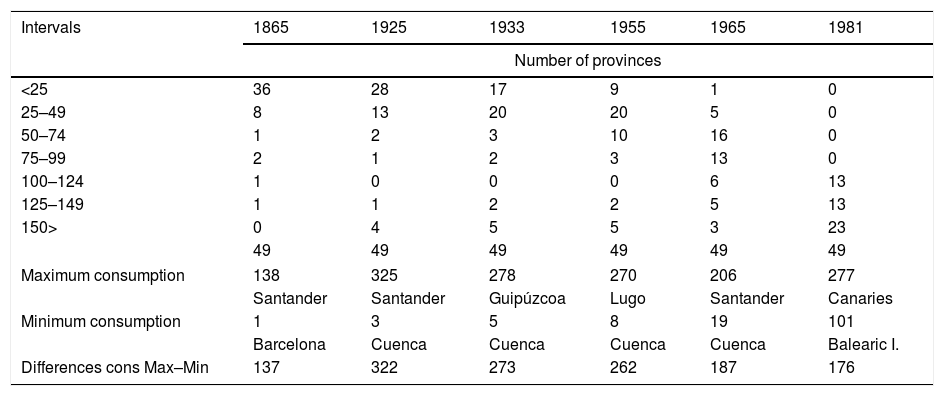
Table 7 presents the sequence more accurately. In 1865, observed consumption in 36 of the 49 provinces was below 25l/p/y. In 1925, however, this occurred in only 28 provinces, and in only one in 1965. Until 1955, on the other hand, observed consumption in more than half the provinces was under 50l/p/y, while in 1981 a similar proportion of provinces presented a consumption of 125l or more. Similarly, as previously noted, the differences between provinces with the highest and the lowest consumption levels were very great in 1925 and 1933, and tended to decrease thereafter. These differences, on the other hand, were very stable. The provinces of Santander and Cuenca, for instance, remained in the same position most years.
Distribution of Spanish provinces into intervals of observed consumption, 1865–1981 (l/p/y).
| Intervals | 1865 | 1925 | 1933 | 1955 | 1965 | 1981 |
|---|---|---|---|---|---|---|
| Number of provinces | ||||||
| <25 | 36 | 28 | 17 | 9 | 1 | 0 |
| 25–49 | 8 | 13 | 20 | 20 | 5 | 0 |
| 50–74 | 1 | 2 | 3 | 10 | 16 | 0 |
| 75–99 | 2 | 1 | 2 | 3 | 13 | 0 |
| 100–124 | 1 | 0 | 0 | 0 | 6 | 13 |
| 125–149 | 1 | 1 | 2 | 2 | 5 | 13 |
| 150> | 0 | 4 | 5 | 5 | 3 | 23 |
| 49 | 49 | 49 | 49 | 49 | 49 | |
| Maximum consumption | 138 | 325 | 278 | 270 | 206 | 277 |
| Santander | Santander | Guipúzcoa | Lugo | Santander | Canaries | |
| Minimum consumption | 1 | 3 | 5 | 8 | 19 | 101 |
| Barcelona | Cuenca | Cuenca | Cuenca | Cuenca | Balearic I. | |
| Differences cons Max–Min | 137 | 322 | 273 | 262 | 187 | 176 |
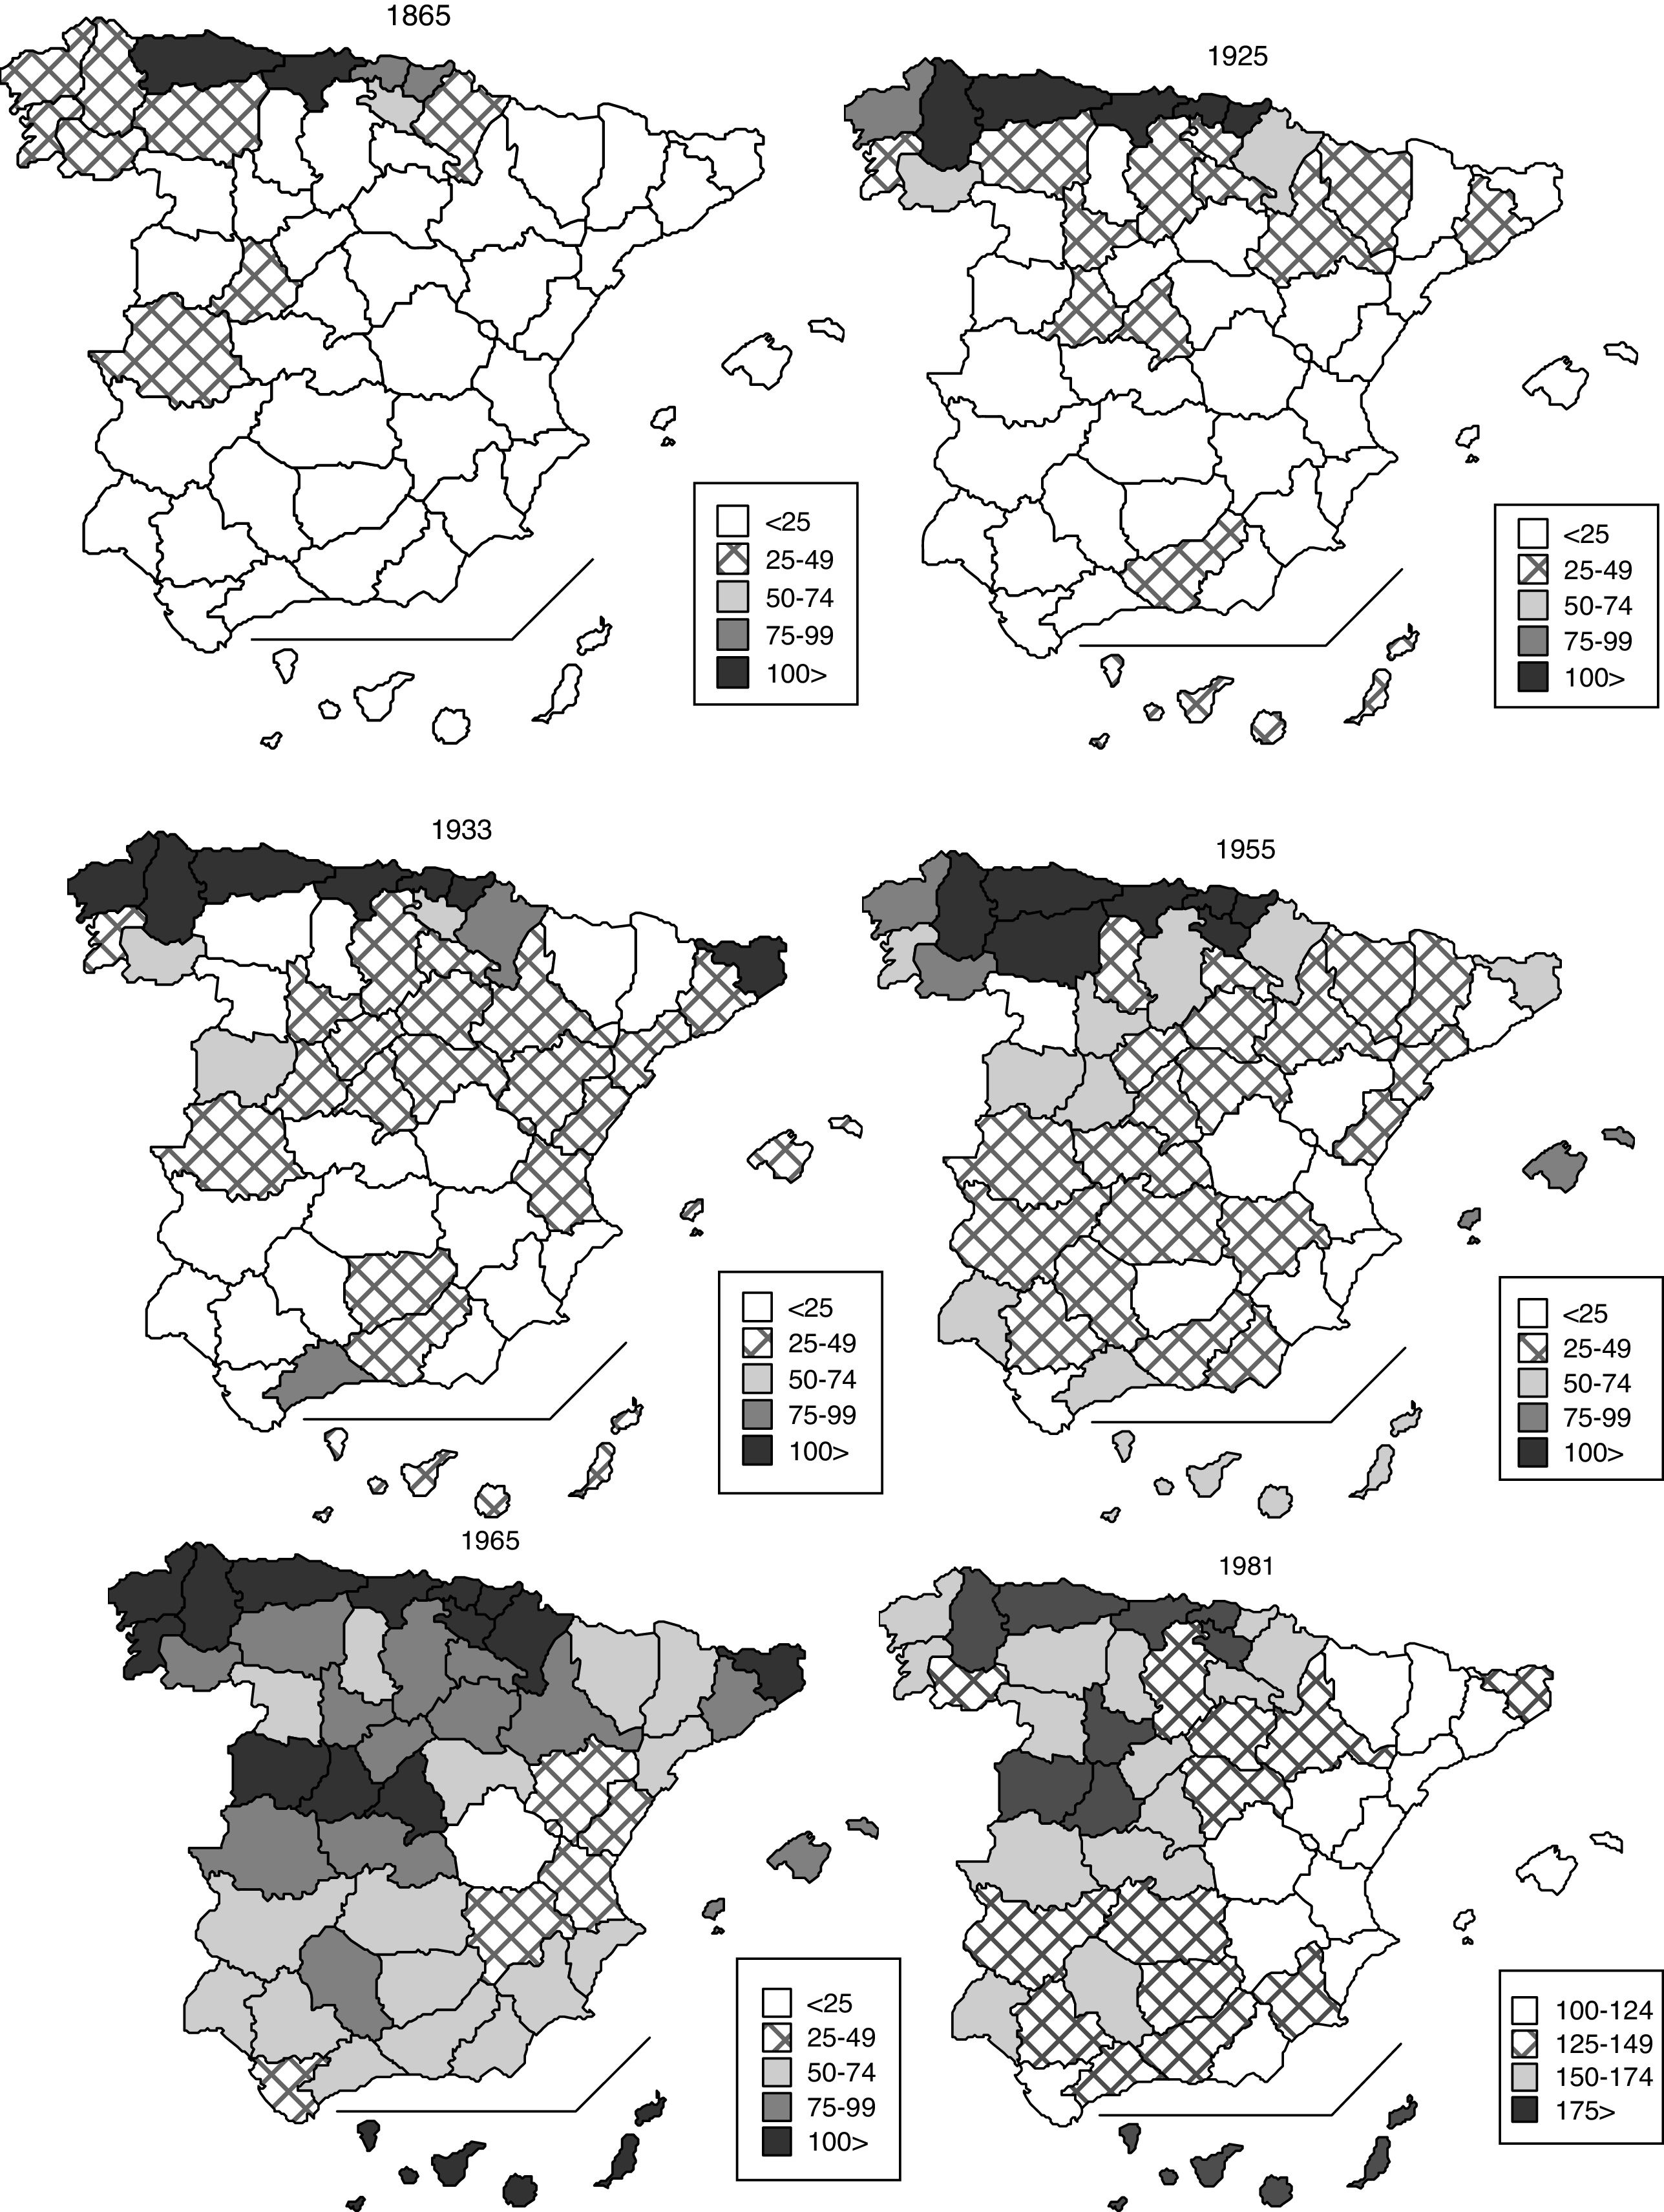
Map 1 illustrates the territorial trends in more detail. Three main trends may be observed between 1865 and 1965. Firstly, that of the north of the Peninsula (Cantabrian and Atlantic provinces), where consumption was always higher than elsewhere. Secondly, that of the northern half of the peninsula, with the exception of the northernmost fringe, where consumption increased until the 1930s. Thirdly, that of the provinces where consumption was always lowest and which joined the diffusion process at a later date (region of Valencia and provinces of Teruel and Cuenca). Between 1965 and 1981, average consumption levels grew and reached 100l/p/y in all regions.
.")
Average observed consumption by province: Spain, 1865–1981 (l/p/y).
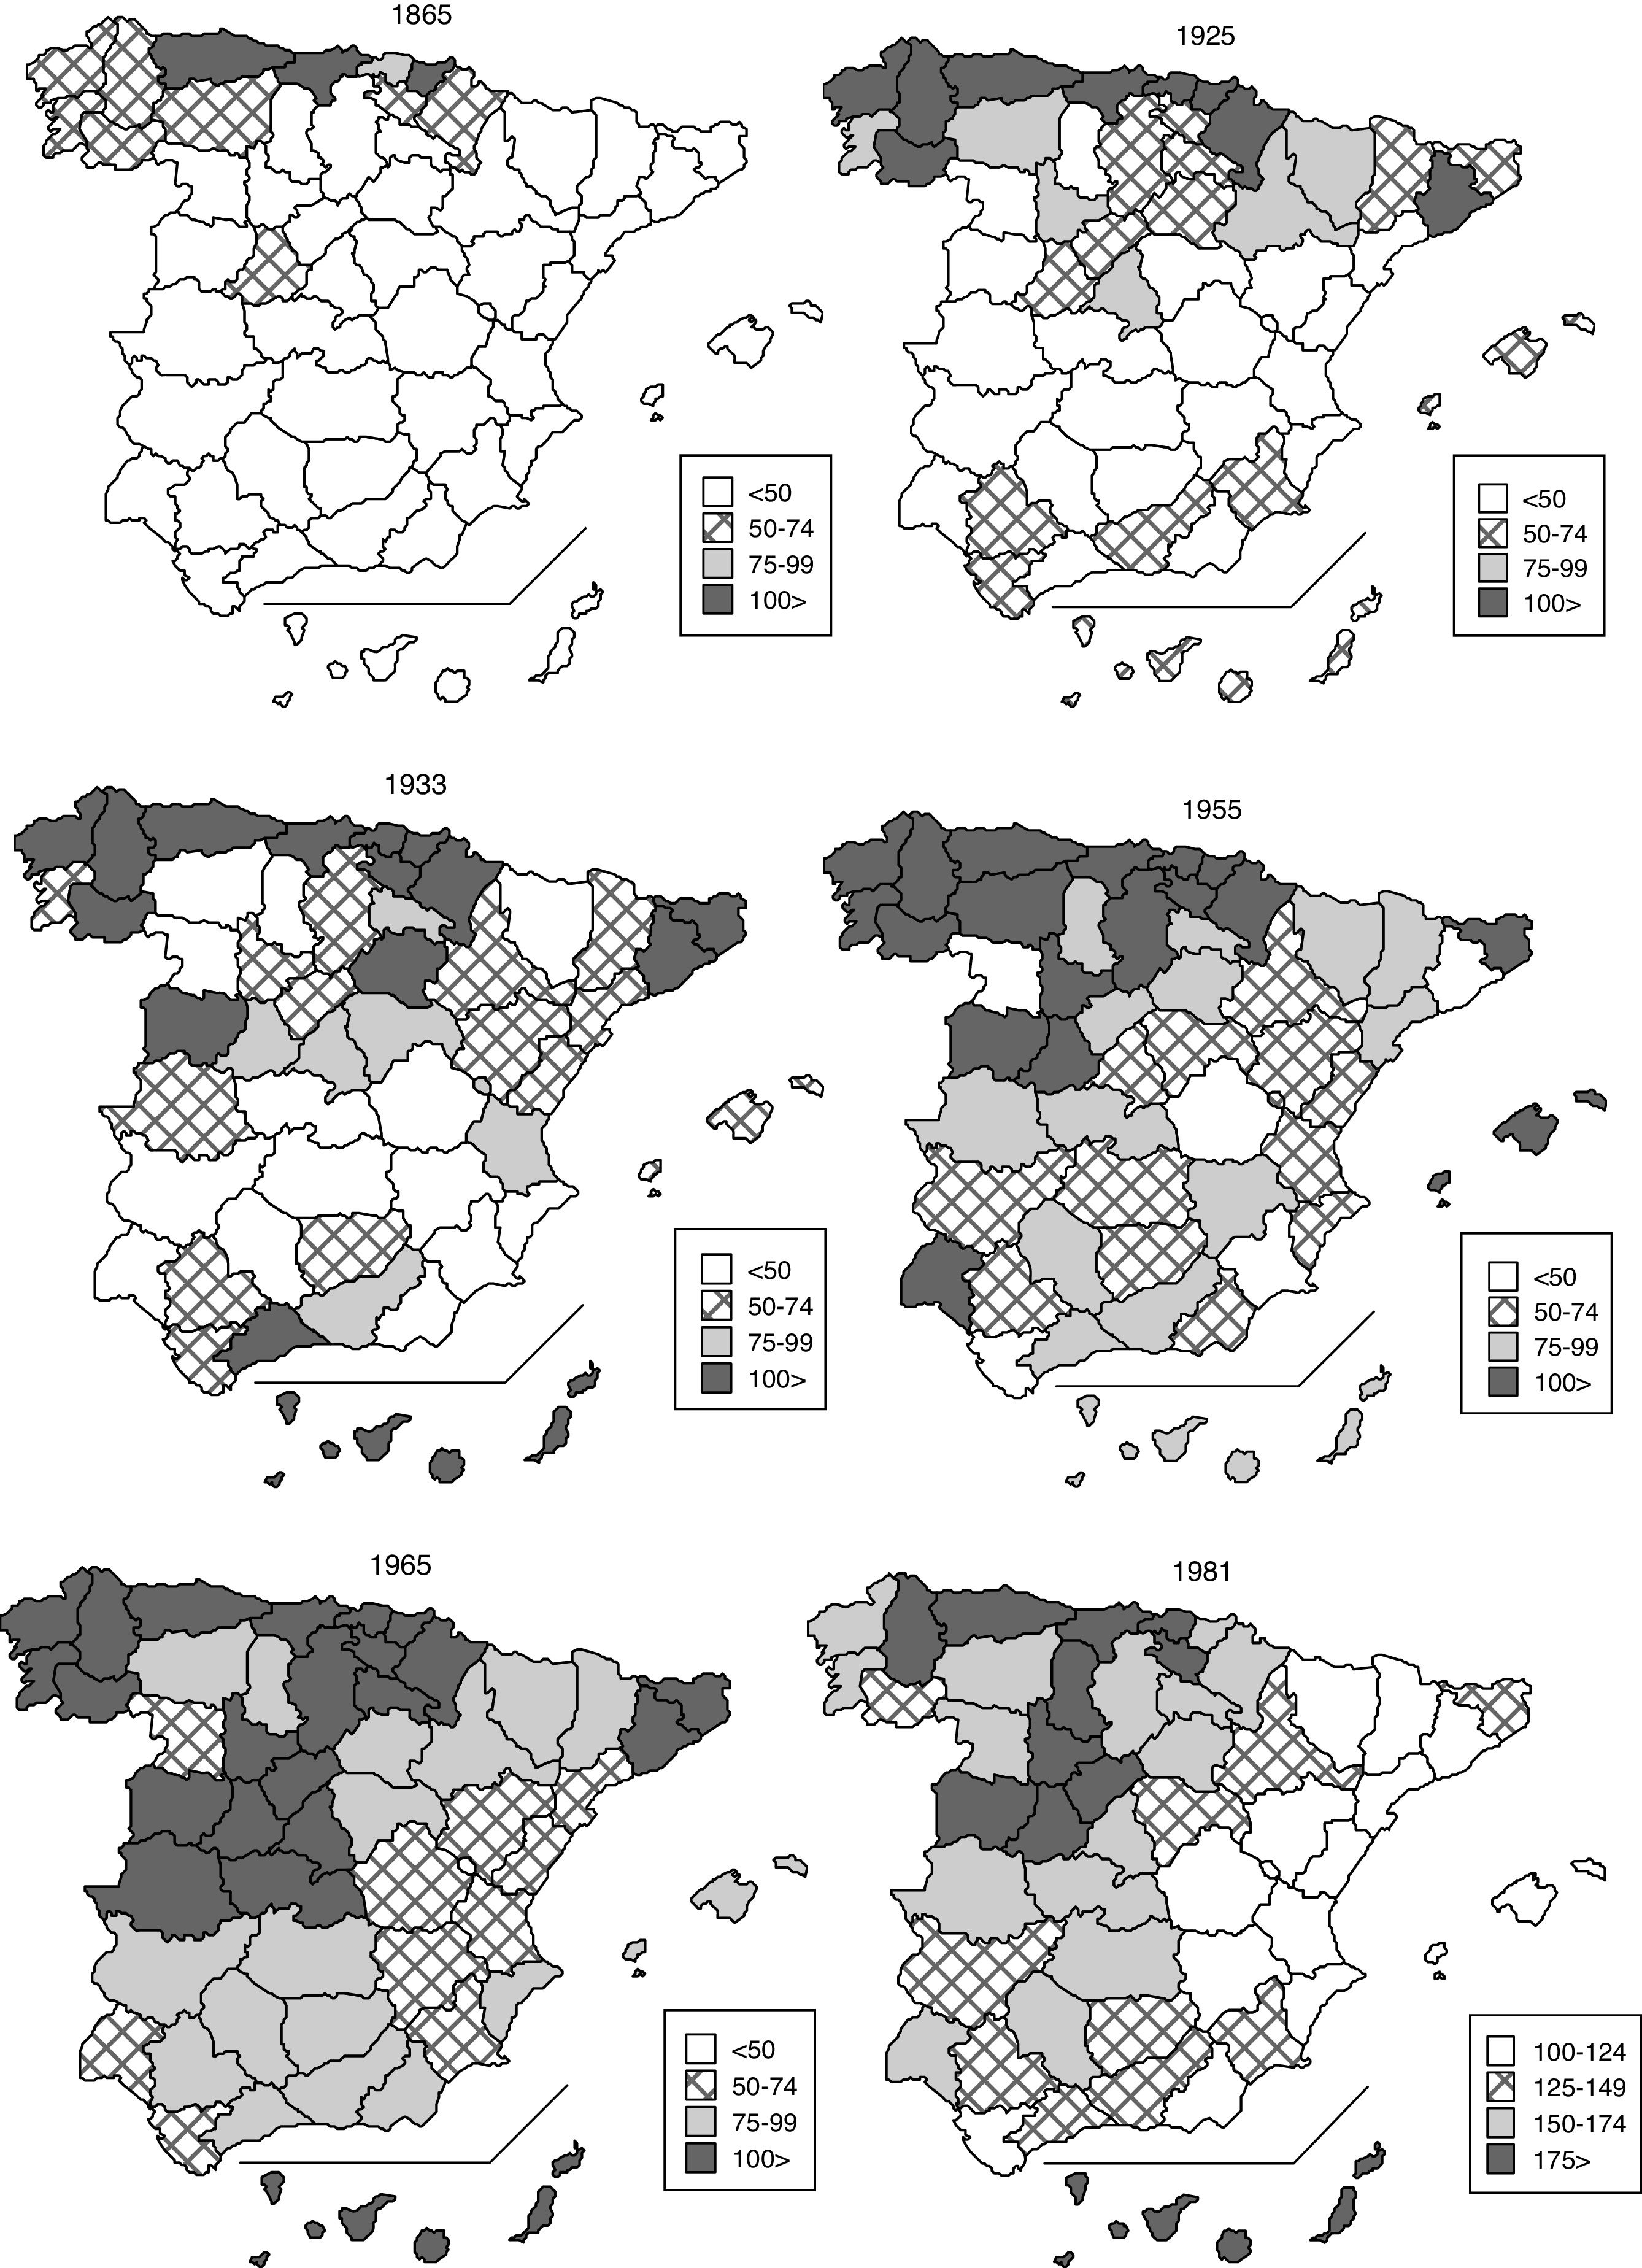
Map 2 presents adjusted consumption. It repeats some features already seen in Map 1, but it also illustrates other issues. In some cases, territorial patterns vary, especially between 1925 and 1933. During this period, a number of provinces in Old Castile, the south of the Peninsula, and Barcelona and Girona show an increase in consumption, compared to Map 1.
.")
Average adjusted consumption by province: Spain, 1865–1981 (l/p/y).
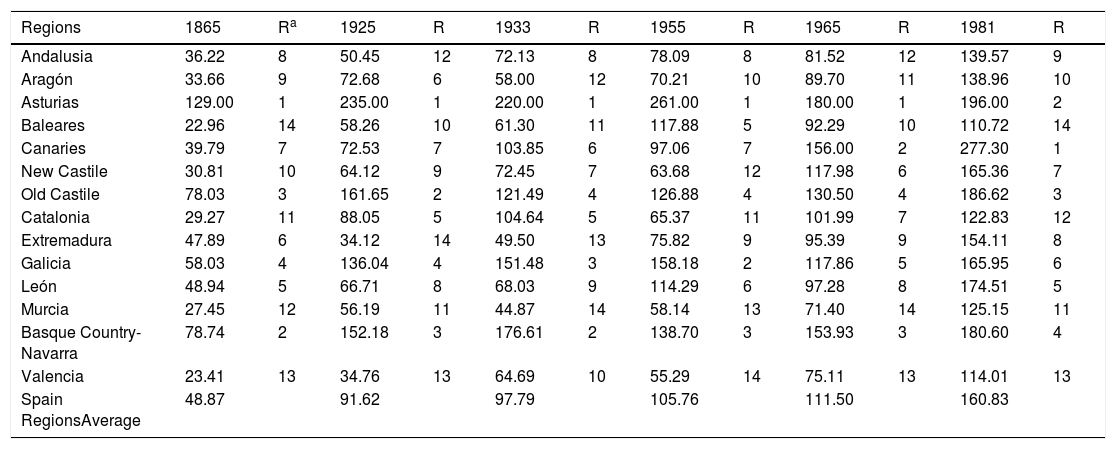
Table 8 provides additional information about regional patterns in the diffusion of milk consumption. The table shows the adjusted consumption per person per year according to historical regions, and the relative position of each region. In some regions, consumption was always above the national average: Asturias, the Basque Country and Navarre, from the beginning, and later also Galicia and Old Castile. The Canaries join this group in 1981, owing to the high consumption of powdered milk in this region.40 Previously, the Canaries held a position around the middle of the table, with values not far from the national average.
Adjusted milk consumption by historical region: Spain, 1865–1981 (l/p/y).
| Regions | 1865 | Ra | 1925 | R | 1933 | R | 1955 | R | 1965 | R | 1981 | R |
|---|---|---|---|---|---|---|---|---|---|---|---|---|
| Andalusia | 36.22 | 8 | 50.45 | 12 | 72.13 | 8 | 78.09 | 8 | 81.52 | 12 | 139.57 | 9 |
| Aragón | 33.66 | 9 | 72.68 | 6 | 58.00 | 12 | 70.21 | 10 | 89.70 | 11 | 138.96 | 10 |
| Asturias | 129.00 | 1 | 235.00 | 1 | 220.00 | 1 | 261.00 | 1 | 180.00 | 1 | 196.00 | 2 |
| Baleares | 22.96 | 14 | 58.26 | 10 | 61.30 | 11 | 117.88 | 5 | 92.29 | 10 | 110.72 | 14 |
| Canaries | 39.79 | 7 | 72.53 | 7 | 103.85 | 6 | 97.06 | 7 | 156.00 | 2 | 277.30 | 1 |
| New Castile | 30.81 | 10 | 64.12 | 9 | 72.45 | 7 | 63.68 | 12 | 117.98 | 6 | 165.36 | 7 |
| Old Castile | 78.03 | 3 | 161.65 | 2 | 121.49 | 4 | 126.88 | 4 | 130.50 | 4 | 186.62 | 3 |
| Catalonia | 29.27 | 11 | 88.05 | 5 | 104.64 | 5 | 65.37 | 11 | 101.99 | 7 | 122.83 | 12 |
| Extremadura | 47.89 | 6 | 34.12 | 14 | 49.50 | 13 | 75.82 | 9 | 95.39 | 9 | 154.11 | 8 |
| Galicia | 58.03 | 4 | 136.04 | 4 | 151.48 | 3 | 158.18 | 2 | 117.86 | 5 | 165.95 | 6 |
| León | 48.94 | 5 | 66.71 | 8 | 68.03 | 9 | 114.29 | 6 | 97.28 | 8 | 174.51 | 5 |
| Murcia | 27.45 | 12 | 56.19 | 11 | 44.87 | 14 | 58.14 | 13 | 71.40 | 14 | 125.15 | 11 |
| Basque Country-Navarra | 78.74 | 2 | 152.18 | 3 | 176.61 | 2 | 138.70 | 3 | 153.93 | 3 | 180.60 | 4 |
| Valencia | 23.41 | 13 | 34.76 | 13 | 64.69 | 10 | 55.29 | 14 | 75.11 | 13 | 114.01 | 13 |
| Spain RegionsAverage | 48.87 | 91.62 | 97.79 | 105.76 | 111.50 | 160.83 |
Secondly, Table 8 also shows that the bottom positions in the ranking were always occupied by the same regions (Valencia, Murcia and Balearic Islands). Other regions with consumption levels that were below the national average but which did not always occupy the bottom tiers are Andalusia, Aragon and Extremadura. The overall stability of the rankings, however, must not obscure two other issues. Firstly, adjusted consumption always grew in most regions: between 1865 and 1925, it grew in 13 of the 14 historical regions; between 1925 and 1933, it grew in 10; between 1933 and 1955, it grew in 9; between 1955 and 1965, it again grew in 10; and between 1965 and 1981, it grew in all of them. Secondly, there are significant shifts in the ranking over time. On the one hand, Catalonia entered the group of regions with the highest consumption among consumer populations in the first third of the 20th century, but then dropped below the national average. New Castile followed an opposing trajectory, staying below the national average until 1955 and surpassing it between 1965 and 1981.
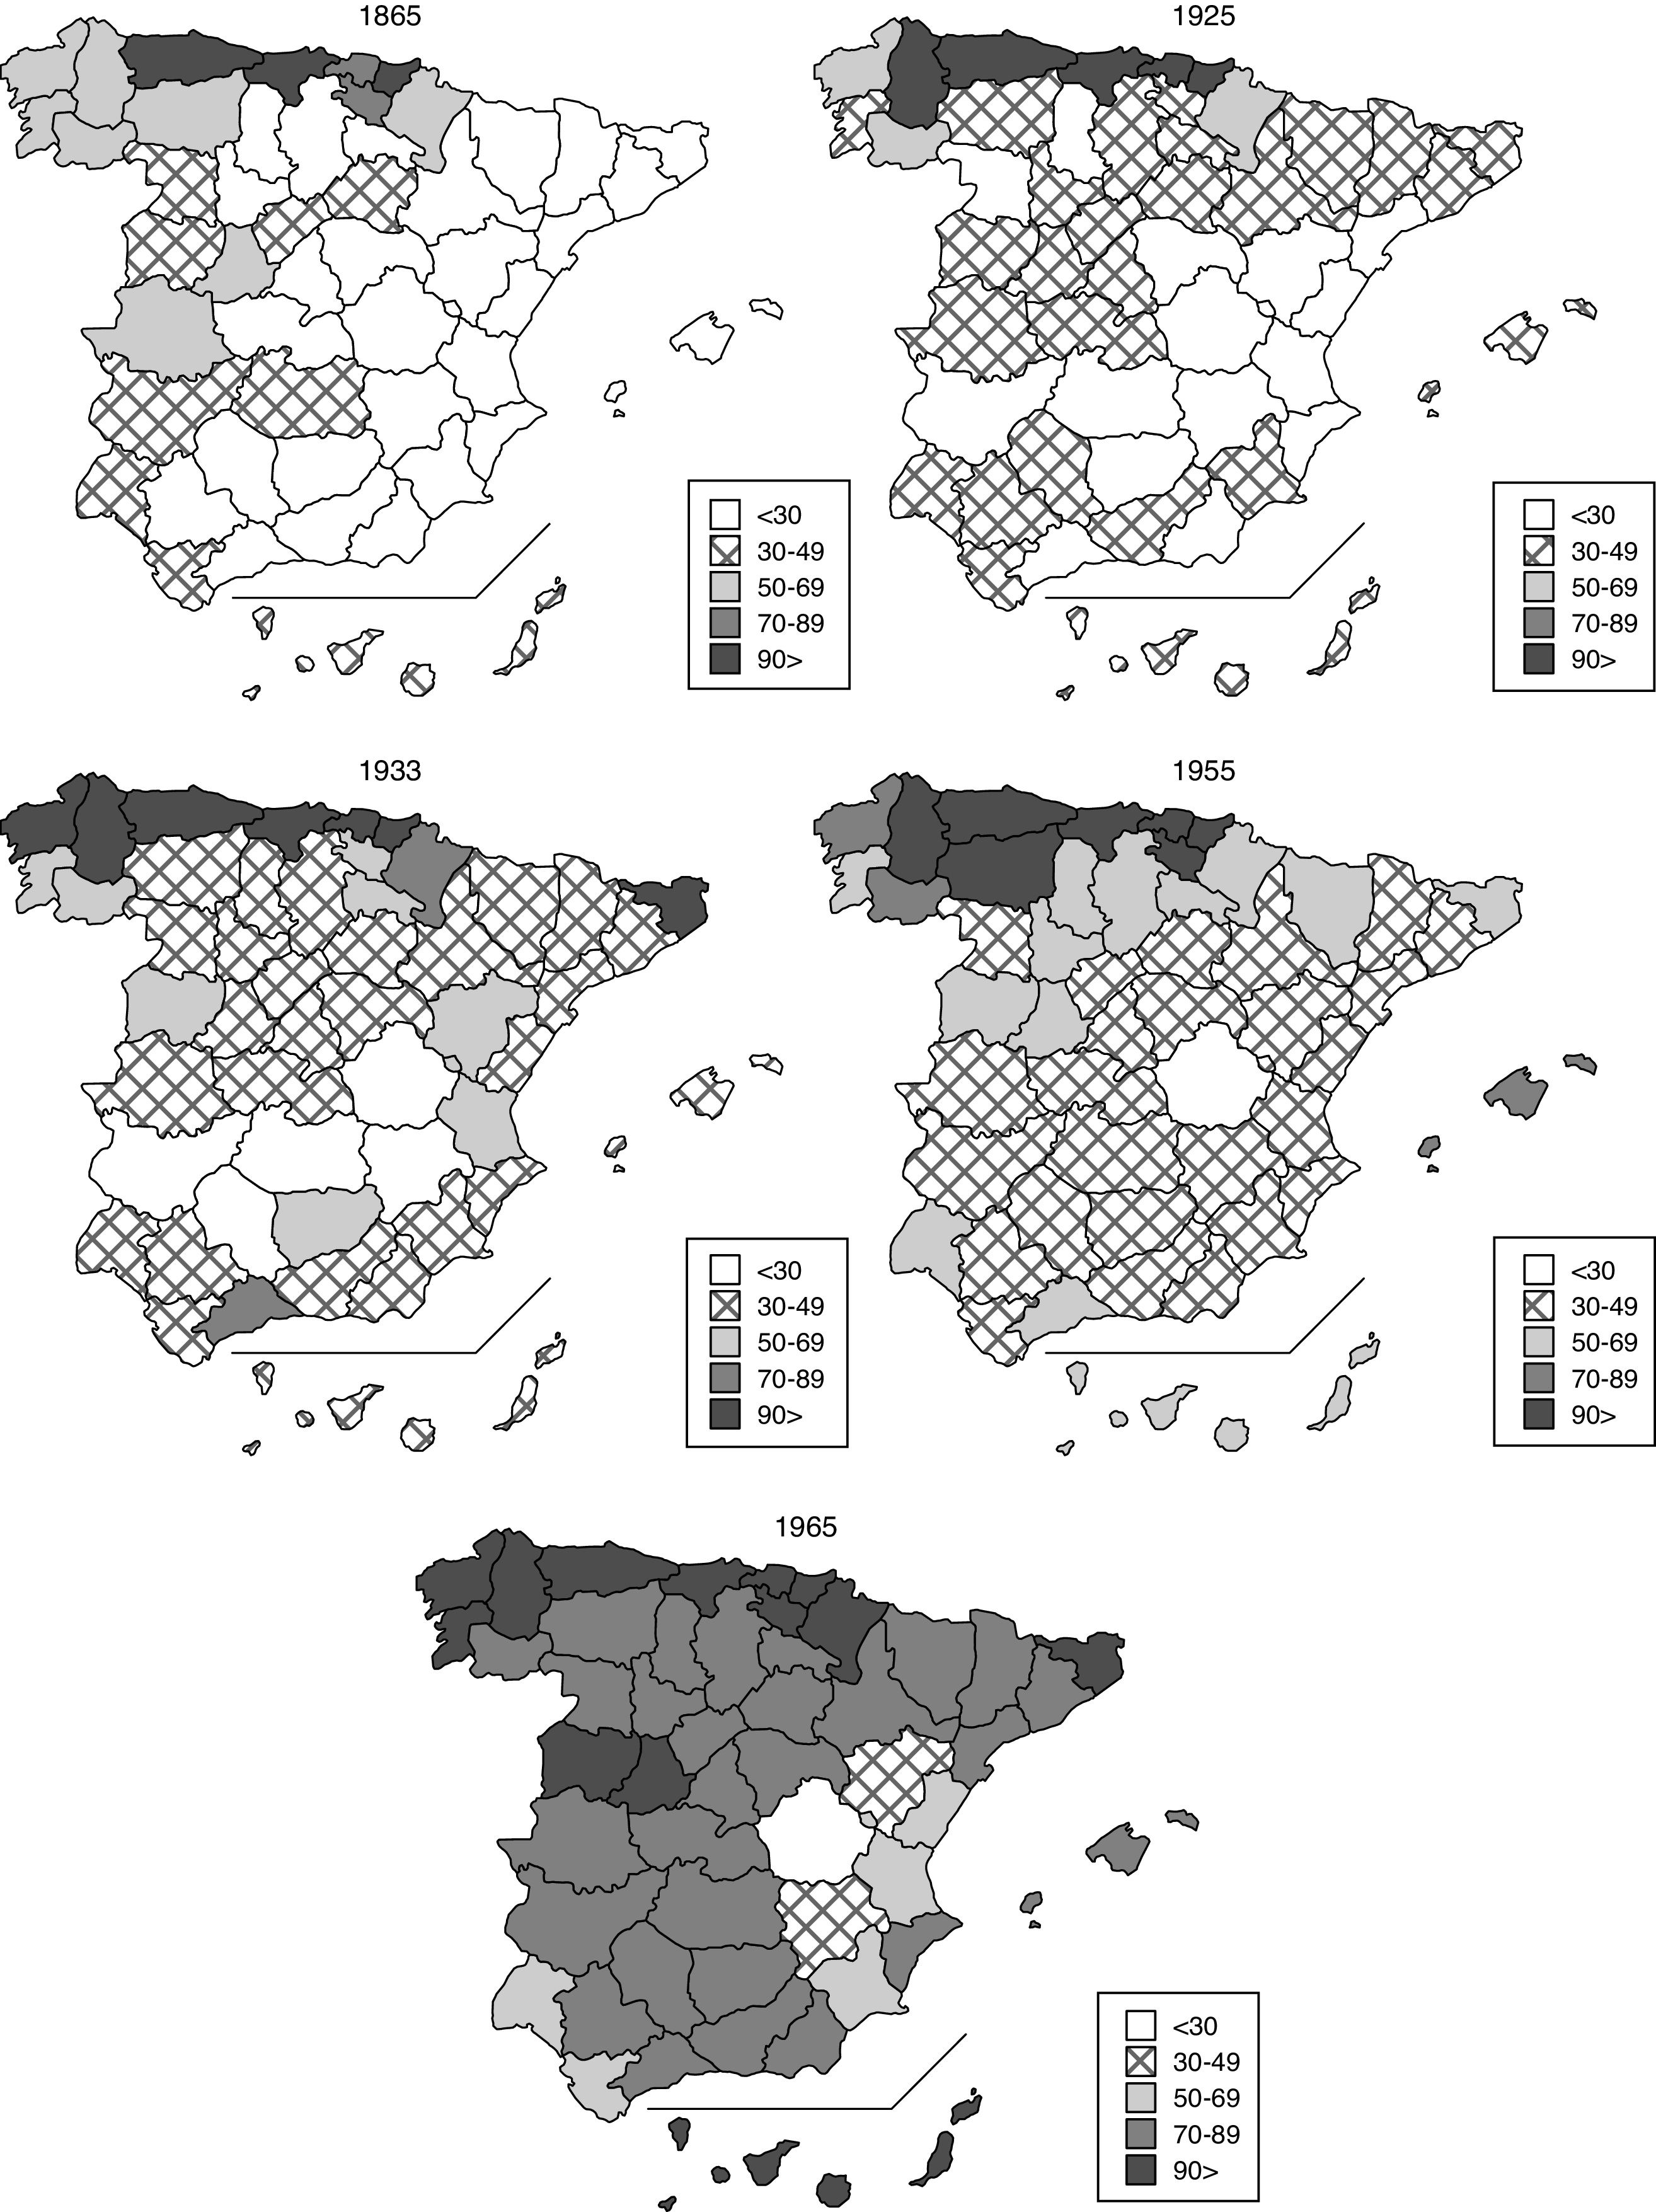
Let us now analyse consumer populations. Map 3 follows closely the patterns set by the map depicting adjusted consumption. The most obvious among these similarities is the persistence of a high percentage of consumers – over 70% – in the northernmost regions (Cantabrian and Atlantic provinces). There are, however, specific trends in this regard. In the second half of the 19th century, when the percentages of consumer population were generally low – approximately one-third of the population – the contrast is largely between the east (less consumers) and the west (more consumers). In the first third of the 20th century, when consumer population reached 50% of the total population, the contrast takes a north-south character, with a number of provinces in the interior and the Mediterranean coast in which the proportion of consumers remained at 19th-century levels. In the second half of the 20th century, the highest difference is between the Valencian provinces and their neighbours (Cuenca, Teruel and Albacete), which still presented a low percentage of consumers, and the rest of the country, with the exception of Huelva and Cádiz.
.")
Proportion of consumers by province: Spain, 1865–1981 (%).
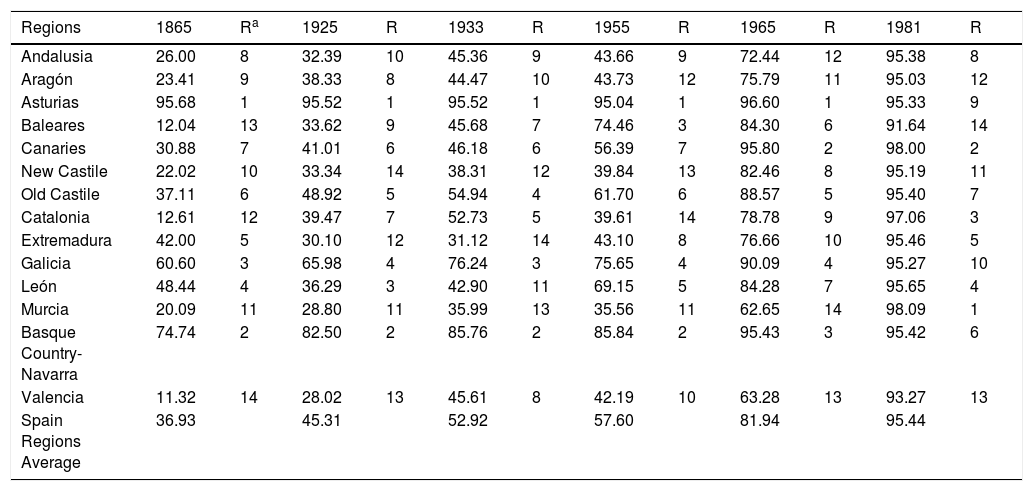
Territorial trends are, again, more easily appreciated if historical regions are taken into consideration. Table 9 shows the percentage of consumers by region, and, again, the position of each region in a ranking. Only the period 1865–1965 will be taken into consideration. By 1981, milk consumption was generalised and the regional differences were, therefore, negligible.
Proportion of consumers by historical region: Spain, 1865–1981 (%).
| Regions | 1865 | Ra | 1925 | R | 1933 | R | 1955 | R | 1965 | R | 1981 | R |
|---|---|---|---|---|---|---|---|---|---|---|---|---|
| Andalusia | 26.00 | 8 | 32.39 | 10 | 45.36 | 9 | 43.66 | 9 | 72.44 | 12 | 95.38 | 8 |
| Aragón | 23.41 | 9 | 38.33 | 8 | 44.47 | 10 | 43.73 | 12 | 75.79 | 11 | 95.03 | 12 |
| Asturias | 95.68 | 1 | 95.52 | 1 | 95.52 | 1 | 95.04 | 1 | 96.60 | 1 | 95.33 | 9 |
| Baleares | 12.04 | 13 | 33.62 | 9 | 45.68 | 7 | 74.46 | 3 | 84.30 | 6 | 91.64 | 14 |
| Canaries | 30.88 | 7 | 41.01 | 6 | 46.18 | 6 | 56.39 | 7 | 95.80 | 2 | 98.00 | 2 |
| New Castile | 22.02 | 10 | 33.34 | 14 | 38.31 | 12 | 39.84 | 13 | 82.46 | 8 | 95.19 | 11 |
| Old Castile | 37.11 | 6 | 48.92 | 5 | 54.94 | 4 | 61.70 | 6 | 88.57 | 5 | 95.40 | 7 |
| Catalonia | 12.61 | 12 | 39.47 | 7 | 52.73 | 5 | 39.61 | 14 | 78.78 | 9 | 97.06 | 3 |
| Extremadura | 42.00 | 5 | 30.10 | 12 | 31.12 | 14 | 43.10 | 8 | 76.66 | 10 | 95.46 | 5 |
| Galicia | 60.60 | 3 | 65.98 | 4 | 76.24 | 3 | 75.65 | 4 | 90.09 | 4 | 95.27 | 10 |
| León | 48.44 | 4 | 36.29 | 3 | 42.90 | 11 | 69.15 | 5 | 84.28 | 7 | 95.65 | 4 |
| Murcia | 20.09 | 11 | 28.80 | 11 | 35.99 | 13 | 35.56 | 11 | 62.65 | 14 | 98.09 | 1 |
| Basque Country-Navarra | 74.74 | 2 | 82.50 | 2 | 85.76 | 2 | 85.84 | 2 | 95.43 | 3 | 95.42 | 6 |
| Valencia | 11.32 | 14 | 28.02 | 13 | 45.61 | 8 | 42.19 | 10 | 63.28 | 13 | 93.27 | 13 |
| Spain Regions Average | 36.93 | 45.31 | 52.92 | 57.60 | 81.94 | 95.44 |
Spain Communities Average.
Source: Authors’ own after the indications contained in the text and Appendix3. Appendix 5 shows these same indicators divided by Autonomous Regions.
Between 1865 and 1933, the consumer populations in Asturias, the Basque Country and Navarre had already reached 80% of the total population. In Galicia, consumer population was approximately 60% in 1865, but later this percentage grew until it almost reached the levels of Asturias, the Basque Country and Navarre (76% in 1933). These regions, in addition, always occupied the top four positions in the ranking until 1965. At the opposite end of the scale were Andalusia, Aragon and, especially, Murcia and Valencia. In these four regions, the percentage of consumers was always below the national average, and Murcia and Valencia were always at the bottom of the ranking. Yet again, the overall regularity of the ranking must not draw attention away from some interesting issues: (a) the percentage of consumers increased very slowly between 1933 and 1955, when the national average barely grew from 53% to 58%; (b) each region followed a distinct trajectory. In Catalonia, for instance, the percentage of consumers increased significantly until 1933. In New Castile, on the other hand, it did so only in the second half of the 20th century.
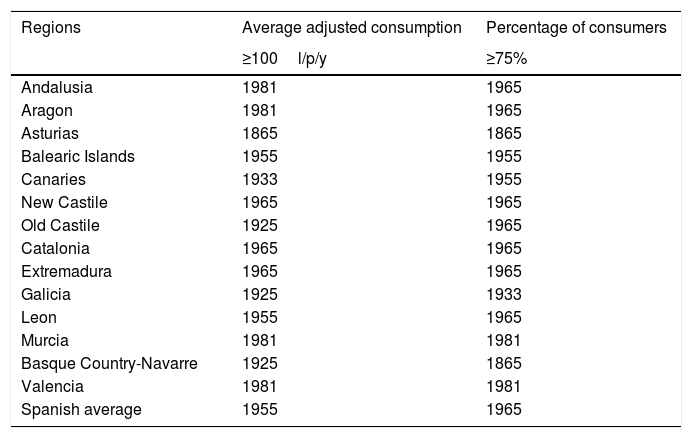
Table 10, finally, presents a coherent chronology of the diffusion of milk consumption in Spain between 1865 and the 1930s, if we accept that, with adjusted consumption levels above 100l/p/y and percentages of consumer populations around 75%, the diffusion process was coming to an end. Using our approach, three long-term trajectories can be appreciated. Firstly, that trajectory of those regions in which consumption levels and percentage of consumers were already high by the mid-19th century and the opening decades of the 20th century (Galicia, Asturias, the Basque Country and Navarre). Secondly, that of another group of regions in which the percentage of consumers and adjusted consumption levels did not increase to high figures until the 1960s (Old Castile and New Castile, Leon and Extremadura, two Mediterranean regions – Balearic Islands and Catalonia – and the Canaries). Thirdly, that of those regions which joined the diffusion process latest (Valencia, Murcia, Andalusia and Aragon). These trajectories place each region in one of the three stages of the diffusion process: pioneering or early, intermediate and late adopters.
Chronology of the diffusion of milk consumption by historical region: Spain, 1865–1981.
| Regions | Average adjusted consumption | Percentage of consumers |
|---|---|---|
| ≥100l/p/y | ≥75% | |
| Andalusia | 1981 | 1965 |
| Aragon | 1981 | 1965 |
| Asturias | 1865 | 1865 |
| Balearic Islands | 1955 | 1955 |
| Canaries | 1933 | 1955 |
| New Castile | 1965 | 1965 |
| Old Castile | 1925 | 1965 |
| Catalonia | 1965 | 1965 |
| Extremadura | 1965 | 1965 |
| Galicia | 1925 | 1933 |
| Leon | 1955 | 1965 |
| Murcia | 1981 | 1981 |
| Basque Country-Navarre | 1925 | 1865 |
| Valencia | 1981 | 1981 |
| Spanish average | 1955 | 1965 |
The incorporation of milk into diet was, probably, the most characteristic feature of the European nutritional transition. During this process, consumption preferences changed substantially and milk consumption increased significantly. In many regions, milk consumption increased more than that of other foodstuffs, including animal products. This was also the case in Spain. Milk consumption was negligible in this country in the 19th century, and reached levels that could compare with those in other European countries in the second half of the 20th century.
The present article has analysed this process once more, taking into consideration the usual analytical methods that centred on average consumption per capita per year (observed consumption), but also two other variables for which data are generally not available: consumer populations and their average consumption (adjusted consumption). Our approach is supported by three reasonable assumptions: (a) consumption took the format of 250-ml portions or viable fractions thereof; (b) diffusion patterns of milk consumption were similar to those followed by new products and services; and (c) distribution of consumption among the population followed a log-normal distribution. Following these three assumptions, we have analysed again the evolution of milk consumption in Spain between the mid-19th century and the 1980s, and we have reached some conclusions which are consistent with historical records and previous studies. Without a doubt, our methodological approach is open to improvement, but we must not forget that the re-evaluation of relevant statistical variables is a common practice in economic history (for example in the calculation of GDPs and HDIs) and a very useful one for the formulation of new hypotheses and the outlining of new research avenues. In order to improve our results, it would be useful to compile more information about the observations made by sanitary specialists as well as new data on milk consumption in hospitals, army schools and charity institutions. It would also be useful to collect further information on milk prices at the provincial level and on milk consumption in cities.
Concerning our case study, at any rate, our main result appears solid: the evolution of consumer populations and the consumption levels within these groups changed from region to region and from period to period. That is, although the increase in total average consumption was in general closely related to the increase in the proportion of consumers, the historical sequence of these two variables went through two key stages. The first, between the mid-19th century and the 1950s, was characterised by: (a) an increase of milk consumption among the consumer groups; (b) the concentration of this process in the stockbreeding northern regions and some big cities; and (c) the existence of substantial regional differences. The second stage, between the 1950s and the 1980s, was characterised by: (a) a generalisation of consumption as a result of the sharp growth in the number of consumers first, and of consumption among these later; and (b) the progressive decrease in regional differences. Probably, differences according to income also decreased over time, but this aspect has not been considered in the present study.
Concerning the first stage, some historical records provide evidence for a small proportion of consumers and a low average consumption (adjusted average) in the second half of the 19th century, and also for the important role played by this variable in the increase of observed consumption up to the 1930s. Those records also provide evidence for wide regional and socioeconomic differences. The information provided by late 19th- and early 20th-century medical-sanitary surveys is illustrative concerning the small number of consumers, as are the reports on the stock-breeding sector in 1891, and the more disperse data on family budgets (Ballesteros, 1997; Pujol-Andreu and Cussó, 2014). Previous research also shows that milk consumption became widespread first among children and young people (Cussó and Garrabou, 2004; Nicolau et al., 2010; Muñoz Pradas, 2016; Nicolau et al., 2010), and that differences according to income in this group were substantial (Carrasco Cadenas, 1934). Finally, other studies have shown that the increase in the availability of milk in those years chiefly affected the stockbreeding northern areas and some big cities (Langreo, 1995; Domínguez Martín, 1996, 2001; Hernández and Pujol-Andreu, 2016), and that milk relative prices in the north were lower (Nicolau and Pujol-Andreu, 2006). Consumer groups, therefore, could only grow in those areas and cities, and it was the growing consumption among these groups which made the total consumption levels go up. In consequence, inequality widened. Therefore, as late as the 1930s, sanitary specialists still observed that large groups of the population did not consume milk at all (Jiménez and Jiménez, 1934).
Regarding the second phase of diffusion of milk consumption in Spain, previous studies and historical records also support our results. In the 1950s, milk was already accepted as a basic foodstuff, and the number of potential consumers was thus high. It must, therefore, not come as a surprise that the proportion of consumers and the average consumption among this group increased in the following years, when milk production and interregional trade increased, and household income also increased. Several of previous studies have already shown that this increase was affected by a number of different innovations: the introduction of new animal breeds, the distribution of milk in cistern trucks, the creation of new milk processing plants and the emergence of new products (pasteurised, sterilised, bottled and powdered milk) (Domínguez Martín, 2003; Collantes, 2015; Hernández and Pujol-Andreu, 2016). As previously noted, different socioeconomic factors also promoted milk consumption: for instance, the accentuation of population movements towards wealthier regions and especially cities. Thus, it can reasonably be inferred that: (a) milk consumption increased especially in those regions in which, in the early 1960s, as much as 50% of the population still consumed no milk at all; (b) that regional differences tended to disappear; and (c) that the geographical connection between consumption and production disappeared. This is also attested by the correlation coefficients that reflect the association between number of cows per 1000 inhabitants and the percentage of consumer population. Taking all provinces into account, in 1865 this coefficient was 0.91 and in 1925 it was 0.82; later, it decreased to 0.66 in the mid-1950s and to 0.34 in 1981.
This work was carried out within the framework of the project HAR 2016-76814-C2-1-P(AEI/FEDER,UE). We wish to thank James Simpson, Josep Lluis Raymond and David Govantes (translation) for their comments. Remarks made by the referees have been very helpful for improving the manuscript. Any mistakes or misunderstandings in these pages are our own.
The following are the supplementary data to this article:
Atkins (1992, 2005), Popkin (1993), Grigg (1995), Kjærnes (1995), Murcott (1999), Moreno, L.A., Sarría, A. and Popkin, B.M. (2002).
Nicolau and Pujol-Andreu (2008), Hernández Adell and Pujol-Andreu (2016), Orland (2005, 2007), Pujol-Andreu and Cussó (2014).
Collantes (2015), Domínguez Martín (2003), Muñoz Pradas (2011) and Nicolau, Pujol-Andreu and Hernández Adell (2010).
For these diffusion processes, see Duval and Biere (2002).
These censuses were undertaken on behalf of the Junta General de Estadística (1865), the Asociación General de Ganaderos del Reino (AGGR) (1925) and the Ministerio de Agricultura (1934). Annual statistics will not be used owing to their lack of reliability (Grupo de Estudios de Historia Rural, 1991). The FBS of 1958 was also rejected, because it was poorly executed (see report by the Instituto Nacional de Estadística (INE) at http://www.ine.es/metodologia/t25/t2530p458.pdf). The publication of the AGGR has traditionally been dated to 1923, but according to the Revista de Higiene y Sanidad Pecuarias (Livestock Hygiene and Healthcare Journal) (February 1926, p. 138) the real publication year was 1925. For further information, see Barciela et al. (2005) and Hernández Adell and Pujol-Andreu (2016).
Powell, Norman and Dickinson (1975: 1723–1726). Goat estimates according to age data, from Junta General de Estadística (1868).
Junta Consultiva Agronómica (1892). See also Domínguez Martín (2003), Hernández Adell and Pujol-Andreu (2016), Langreo (1995).
Madrid dairies produced 45.6 million litres, and the production in the province was, according to stock-breeding statistics, 40 million (Doaso (1931: 26–28)). In 1933, the city of Barcelona consumed 72 million litres of milk, and the production of the province was estimated at 71.6 million (Mas (1933: 20–21)). See also Ministerio de Agricultura (1934) and Hernández Adell and Pujol-Andreu (2016).
In 1895, 81% of dairies, and 71.6% of dairy cows, were in the huerta, which produced 75.6% of all commercialised milk (Calatayud and Medina, 2017).
The consumption of these forms of milk was very low in the 1930, and had increased considerably by 1965.
In order to estimate per capita consumption before 1955, the provincial population figures are estimated by linear interpolation with reference to the two censuses undertaken at the two closet dates, before and after. FBS already include population data.
Between the end of the Civil War and 1954 (year of first publication of Resumen estadístico de la producción, destino y valor de la leche (Statistical summary of production, destination and value of milk), milk production statistics were published only in 1941 and 1943. According to these estimates, since the 1930s consumption had dropped by nearly 50%, and the number of cows and goats by 20% (Anuario Estadístico de España (1943: 500–505; 1944–45: 472–475). See also, Hernández Adell and Pujol-Andreu (2016).
The apparent consumption of cow and goat liquid milk in 1964–1969 was 70l/p/y. According to the FBS for 1965, liquid milk consumption was 78.7l/p/y.
Milk brought from other provinces to Madrid and Barcelona in the 1930s amounted to only 17% and 13% respectively of all commercialised milk (Doaso (1931: 26–28), Generalitat de Catalunya (1937: 5, 57–65), Mas (1933: 20–21)). According to the Ministerio de Agricultura (1954), the interprovincial milk trade barely amounted to 5% of total production.
The Annuaire Statistique de la Suisse (1930: 153) indicates that consumption decreased from 264 to 235l/p/y between 1910 and 1940. A similar trend can be attested in France, Holland, Denmark, Great Britain and Sweden from 1950 onwards (International Dairy Federation (1982)).
Archivo Comarcal de la Garrotxa, Fondo Hospital Olot (c-19 a 31 and 230; and Ajuntament de Girona (1934).
This excludes milk used in cooking (for the preparation of sauces and similar uses).
Different studies show that workers in Madrid and Barcelona were already in the habit of drinking coffee with milk with their breakfast in the early 20th century (AEB, 1902: 526; Luís and Yagüe, 1903: 9–10; Gresa, 1929: 104), Other studies also indicate that, around 1910, students in the schools of El Bosch (Barcelona) and San Ildefonso (Madrid), and also the interns at the Hospicio de la Santa Casa de la Misericordia (Bilbao) were served milk with coffee or chocolate milk in the mornings (Carro, 1917: 14–15; Pérez Castroviejo and Martínez Castroviejo, 1996: 66 and 79; Cussó and Garrabou, 2004).
A list of topographies is in Vallribera (2000) and section 14.2. of the database in www.proyectonisal.org. See also Nicolau, Pujol-Andreu and Hernández Adell (2010) and Pujol-Andreu and Cussó (2014).
These assumptions will have to be corrected later. The model proposes a generic description of the diffusion of innovations, but does not claim that this kind of process systematically repeats the same trend every time. Also, the model does not take into account the pace of the process, for example if the consolidation of an early group of innovators takes longer than that of the early adopters, or vice versa. Rogers (2003) reviews several examples that fit with the model, but the model does not explain all processes (Kauffman and Techatanasoontorn (2009)).
According to the data collected by the Comisión de Reforma del Impuesto de Consumos (Commission for the Reform of Consumption Tax) in 1908, concerning the consumption habits of 434 individuals distributed across 79 families, milk consumption among those in higher income brackets was 266ml/p/day. A more detailed discussion of these issues is in Muñoz Pradas (2011: 144).
For a detailed review of other data on the diffusion of milk consumption among different social groups, see Muñoz Pradas (2011).
Muñoz Pradas (2016), Rodríguez, Ortiz and García (1985), Nicolau, Pujol-Andreu and Hernández Adell (2010). A study of milk consumption in Germany in the 1930s estimated that consumption among children aged under 5 was 222l/y, and 197l/y for children aged 5–10. For older age brackets, consumption was lower: between 100–120l/y (Casado de la Fuente, 1931: 50–51).
Average (m) and variance (σ2) of the distribution have been calculated on the basis of provincial average (x¯) and variance (V) according to the following equations: m=ln(x2¯/x2¯+V); and σ2=ln(1+V/x2¯). See Calot (1988: 182–197). For a better understanding of this distribution in the assessment of the nutritional state of historical populations, see Floud et al. (2011: 49–57).
It must be kept in mind that random variables follow log-normal distributions if their logarithm follows the normal distribution.
The null hypothesis to be tested is that observed distribution is equivalent to the normal distribution.
These magnitudes and, especially, the variance are based on observed consumption data and variances presented in Table 6.
For a more detailed analysis of these simulations, see Muñoz Pradas (2011). It is to be noted that the proportions of consumer groups are estimated on the basis of the total population, while the simulation refers to consumer groups, based on the log-normal distribution. This means we are assuming that the distribution of the consumer population among the different consumption ranges is equivalent to that of the total population. This statistical premise does not affect the estimates.
These calculations modify those published in Muñoz Pradas (2011), as a result of the new estimations in Appendix 1.
A detailed examination of the results for this year reveals that only 7% of the population consumed over 90l/p/y (250ml/p/day). In the terminology of the diffusion model, these consumers were the ‘early adopters’. As we shall see later, in the comment to Figure 3, the modal value of consumption in 1865 (78ml/p/day) suggests, furthermore, very sporadic consumption.
Based on FENIL (2008), and the microdata of the 1980 Family Budget Survey we place this limit at 95% of the population. In this FBS, 4425 interviewees out of a total of 88,540 did not drink milk at all.
For the calculation of the average and standard deviation, see Footnote 29. It must be taken into consideration that consumption estimates (based on provincial averages and standard deviations) provide more compressed distributions around certain intervals than those that would result from data concerning household consumption. The degree of dispersion of provincial averages compared to total consumption averages could be expected to be less pronounced than the dispersion of consumption averages for each household compared to general household average consumption.
As previously noted, these references indicate that milk consumption was often related to illness and the prescription of liquid diets by doctors.
The FBS indicates that a good deal of consumption in the Canaries ‘corresponds to powdered milk (62g), in amounts which are richer in nutrients than the amount of fresh milk consumed in other regions’. The FBS also indicates that ‘turning powdered milk into fresh milk at a rate of 1/10, this region becomes the top milk consumer (752g/p/day)’ (INE (1981, vol. 5: 47–48)).
- Descargar PDF
- Bibliografía
- Material adicional