


The 3rd International Nursing and Health Sciences Students and Health Care Professionals Conference (INHSP)
More infoGlobal society pays huge economic toll and live loss due to COVID-19 (Coronavirus Disease 2019) pandemic. In order to have a better management of this pandemic, many institutions develop their own models to predict number of COVID-19 cases, hospitalizations and mortalities. These models, however, are shown to be unreliable and need to be revised on a daily basis.
MethodsHere, we develop a Bose–Einstein (BE)-based statistical model to predict daily COVID-19 cases up to 14 days in advance. This fat-tailed model is chosen based on three reasons. First, it contains a peak and decaying phase. Second, it also has both accelerated and decelerated phases which are similarly observed in an epidemic curve. Third, the shape of both the BE energy distribution and the epidemic curve is controlled by a set of parameters. The BE model daily predictions are then verified against simulated data and confirmed COVID-19 daily cases from two epidemic centres, i.e. New York and DKI Jakarta.
ResultOver- predictions occur at the earlier stage of the epidemic for all data sets. Models parameters for both simulated and New York data converge to a certain value only at the latest stage of the epidemic progress. At this stage, model's skill is high for both simulated and New York data, i.e. the predictability is greater than 80% with decreasing RMSE. On the other hand, at that stage, the DKI's model's predictability is still fluctuating with increasing RMSE.
ConclusionThis implies that New York could leave the stay-at-home order, but DKI Jakarta should continue its large-scale social restriction order. There remains a great challenge in predicting the full course of an epidemic using small data collected during the earlier phase of the epidemic.
Covid-19 local epidemic which originated from Wuhan has become a pandemic with severe socio- economic, health and environmental consequences affecting countries all over the world.1–3 In order to better manage this pandemic, many institutions develop different models for predicting: temporal evolution of Covid-19 cases, hospital capacity for treating COVID-19 patients, and case fatality rate of the disease.4–7 Recently, however, some of these predictions are shown to be unreliable and undergone frequent revisions.8,9 Inadequacy in both rigorous model testing and forecast verification is considered amongst factors responsible to this failure10,11 and the use of a fat-tailed probability distribution is recommended for pandemic forecasting.12,13
In this work, we first developed a fat-tailed model that uses the classic Bose–Einstein energy for predicting up to 14-days in advance Covid-19 confirmed cases. The model prediction is then tested and verified against three data sets: simulated data and data from two Covid-19 epicenters: New York (USA) and DKI Jakarta (Indonesia). There are two prediction skill metrics for verifying the predictions, i.e. predictability (R2) and RMSE (root-mean-squared error). The time variation of these metrics is then used for making inference about whether or not a social restriction order still be implemented for Covid-19 containment at the epicenters.
MethodsStudy sitesThis COVID-19 modelling and prediction work is using three data sets: simulation data, and confirmed COVID-19 cases from New York and DKI Jakarta.
Data acquisitionAll data sources are publicly available (Supplementary data: COVID-19 data sets and model verification results. The COVID-19 New York and DKI Jakarta data sets, Tables 1 and 2, respectively). New York had its first day of the Covid-19 epidemic on the 1st March 2020. It started recording the cases on 13th March and the Stay-at-Home order on were set on 22nd March, i.e. the 22nd day of the outbreak. The last recorded data for New York in this analysis was on the 9th June. DKI Jakarta announced its first cases on 2nd March and applied the so-called PSBB (Large Social Social Restriction) order on 10th April, i.e. day 40 of its outbreak. The last recorded data for DKI in this analysis was on June the 13th. It would be interesting to show the impact of these two different timing of the social restriction on COVID-19 cases. The resulting forecast verifications for these simulation data, New York and DKI Jakarta cases are also presented for public uses (Supplementary data: Tables 3–5, respectively).
Data simulation and processingThe Covid-19 model developed here uses the following Bose–Einstein (BE) energy distribution [14,equation 4.21] as follows:


Here the three parameters are: B1=8 πhc, B2=5, and B3=hc/kT. The B1/B3 ratio is proportional to the energy E.
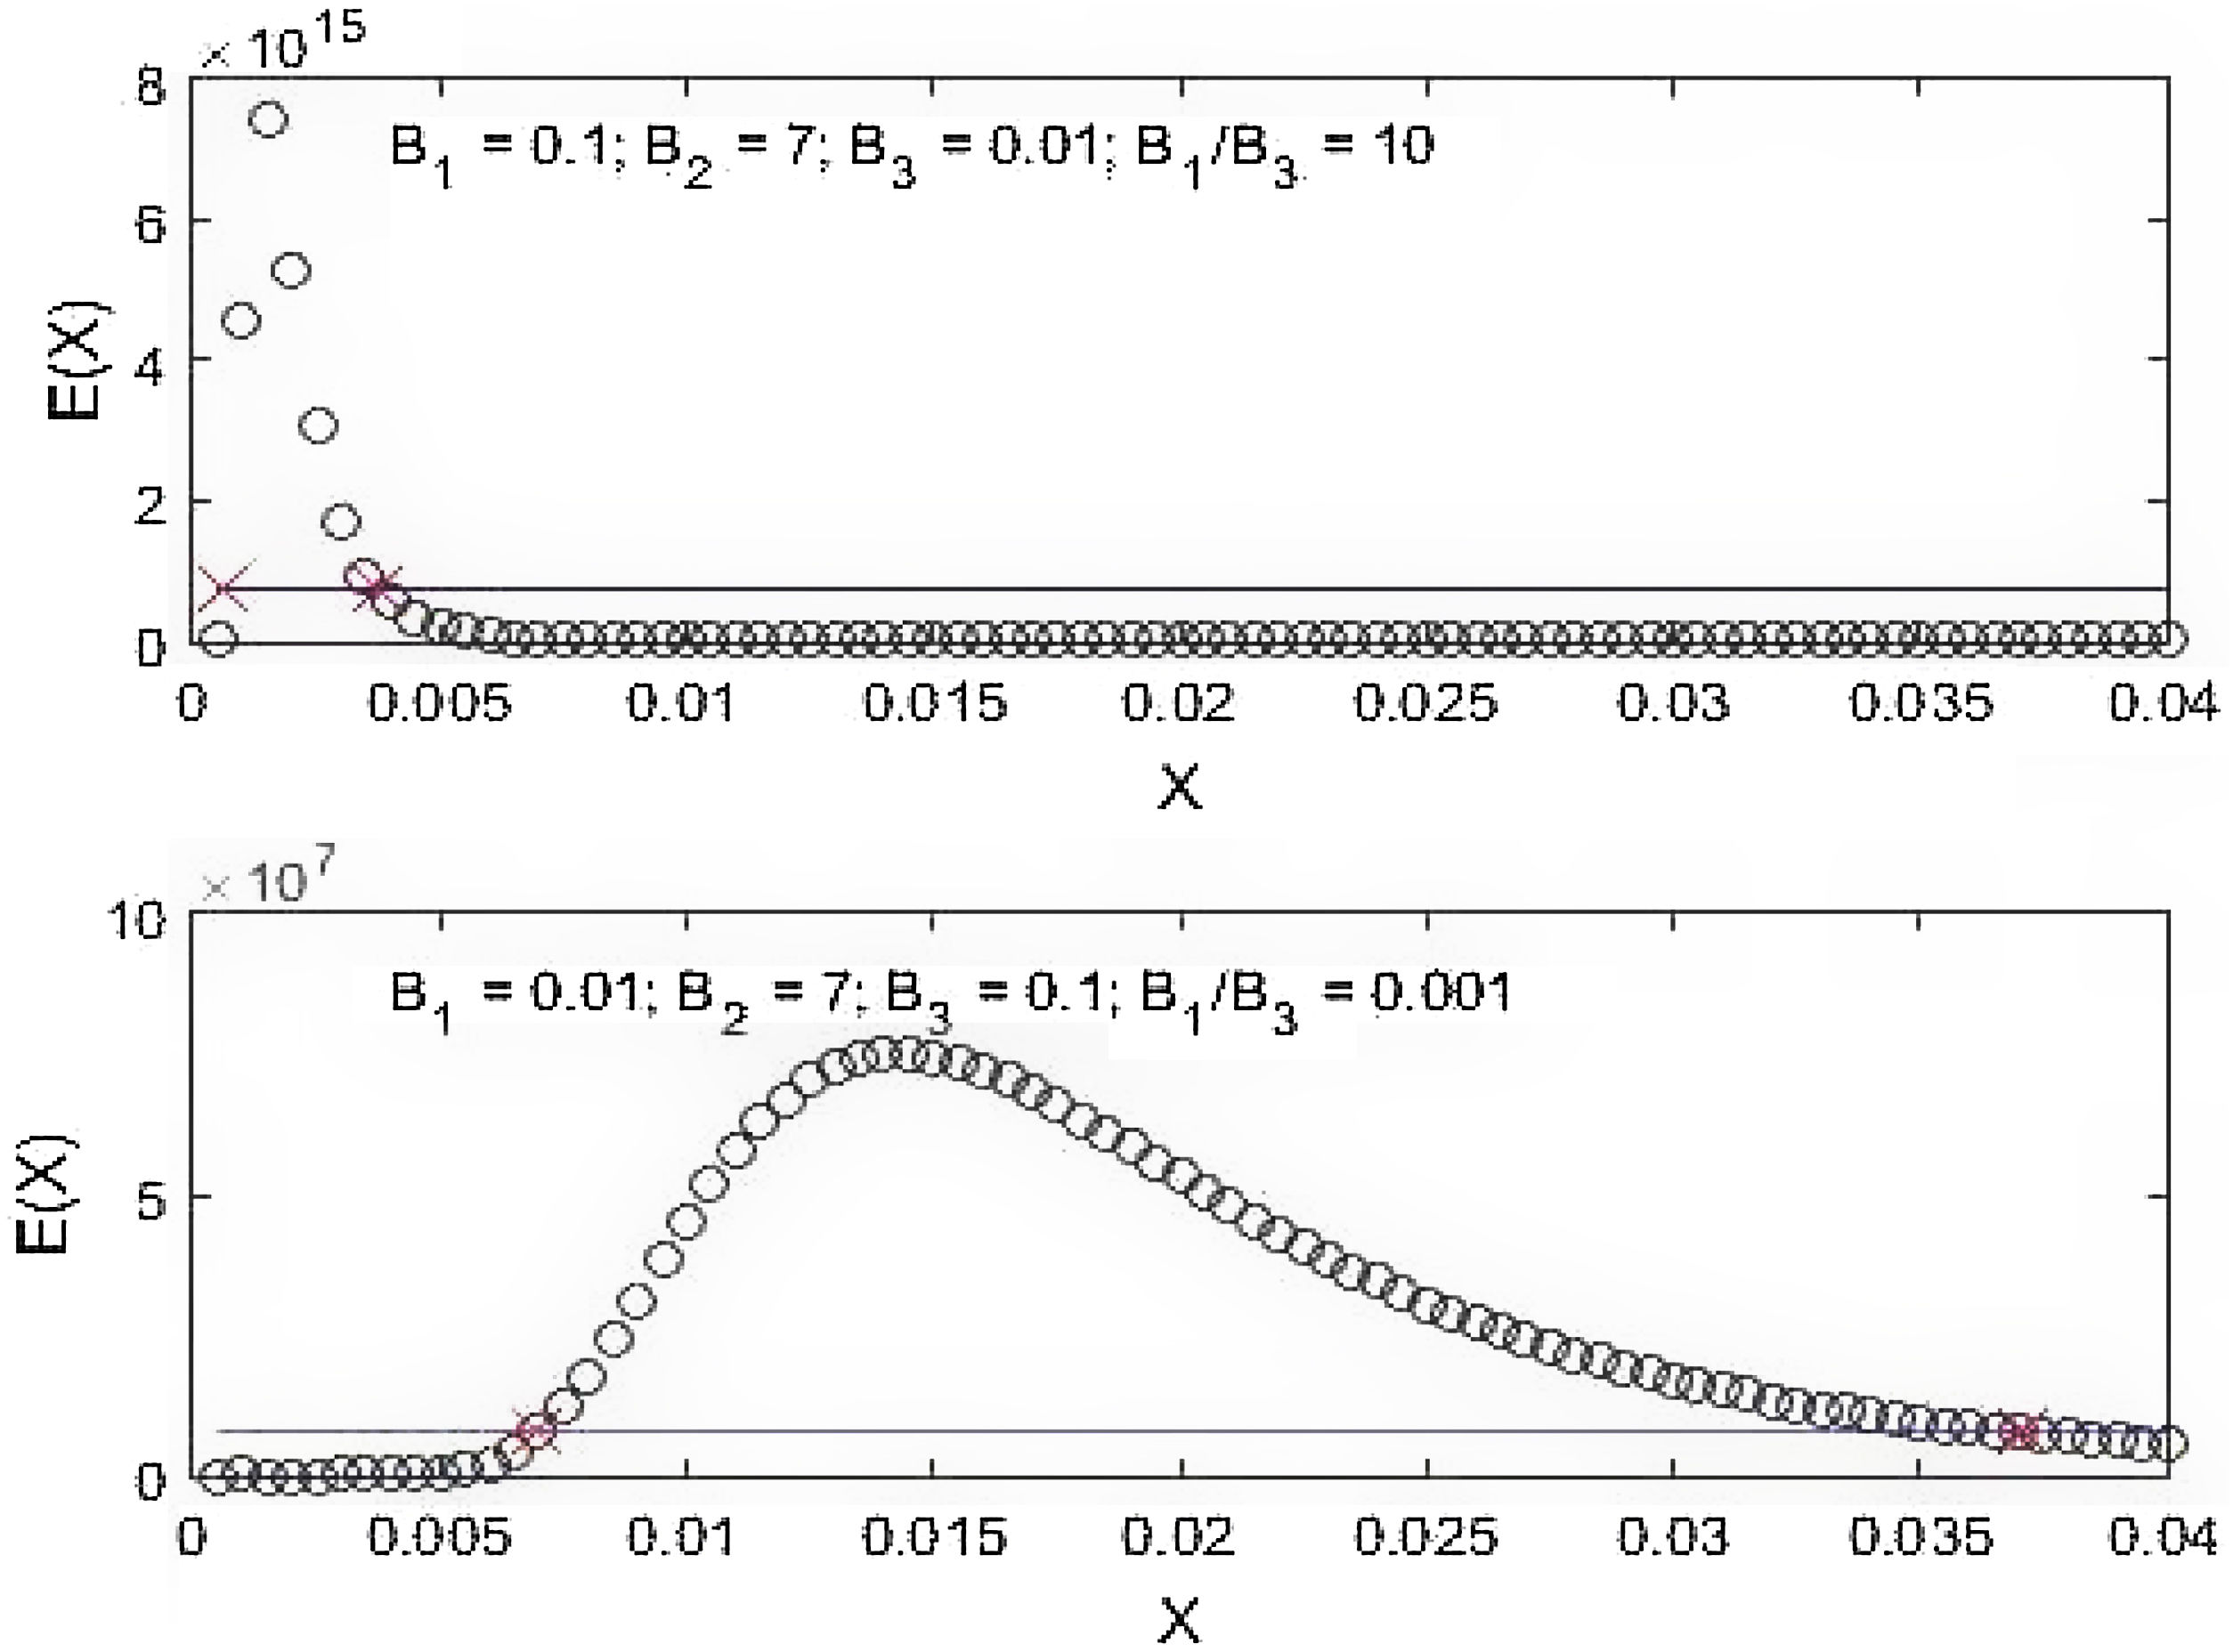
The BE distribution in (2) is presented in Fig. 1. It describes several important properties of the BE distribution to be related to an epidemic curve. First, it has a single peak and decaying period after the peak. Second, the shape of the distribution is determined by the magnitude of the parameters. More specifically, the higher the B1/B3 ratio the steeper the distribution is and vice versa. This is in accordance to that shown in [14, Fig. 10]. In epidemics, any intervention such as ‘Stay-at-Home’ order or PSBB is meant to flatten the epidemic curve, i.e. changing Fig. 1a into becoming Fig. 1b. Third, there exists accelerated and decelerated phases in the distribution. These phases are shown by the different spacing of the circles. Acceleration occurs when crowded circles become into more separated circles, while deceleration happens when sparse circles turn into more dense circles. These phases are more pronounced before the distribution peaks.
 B1>B3, (b) B1<B3. The blue horizontal line is the level to the 10% of peak value and the intersections between these lines and the distributions are plotted with the red crosses ‘×’.")
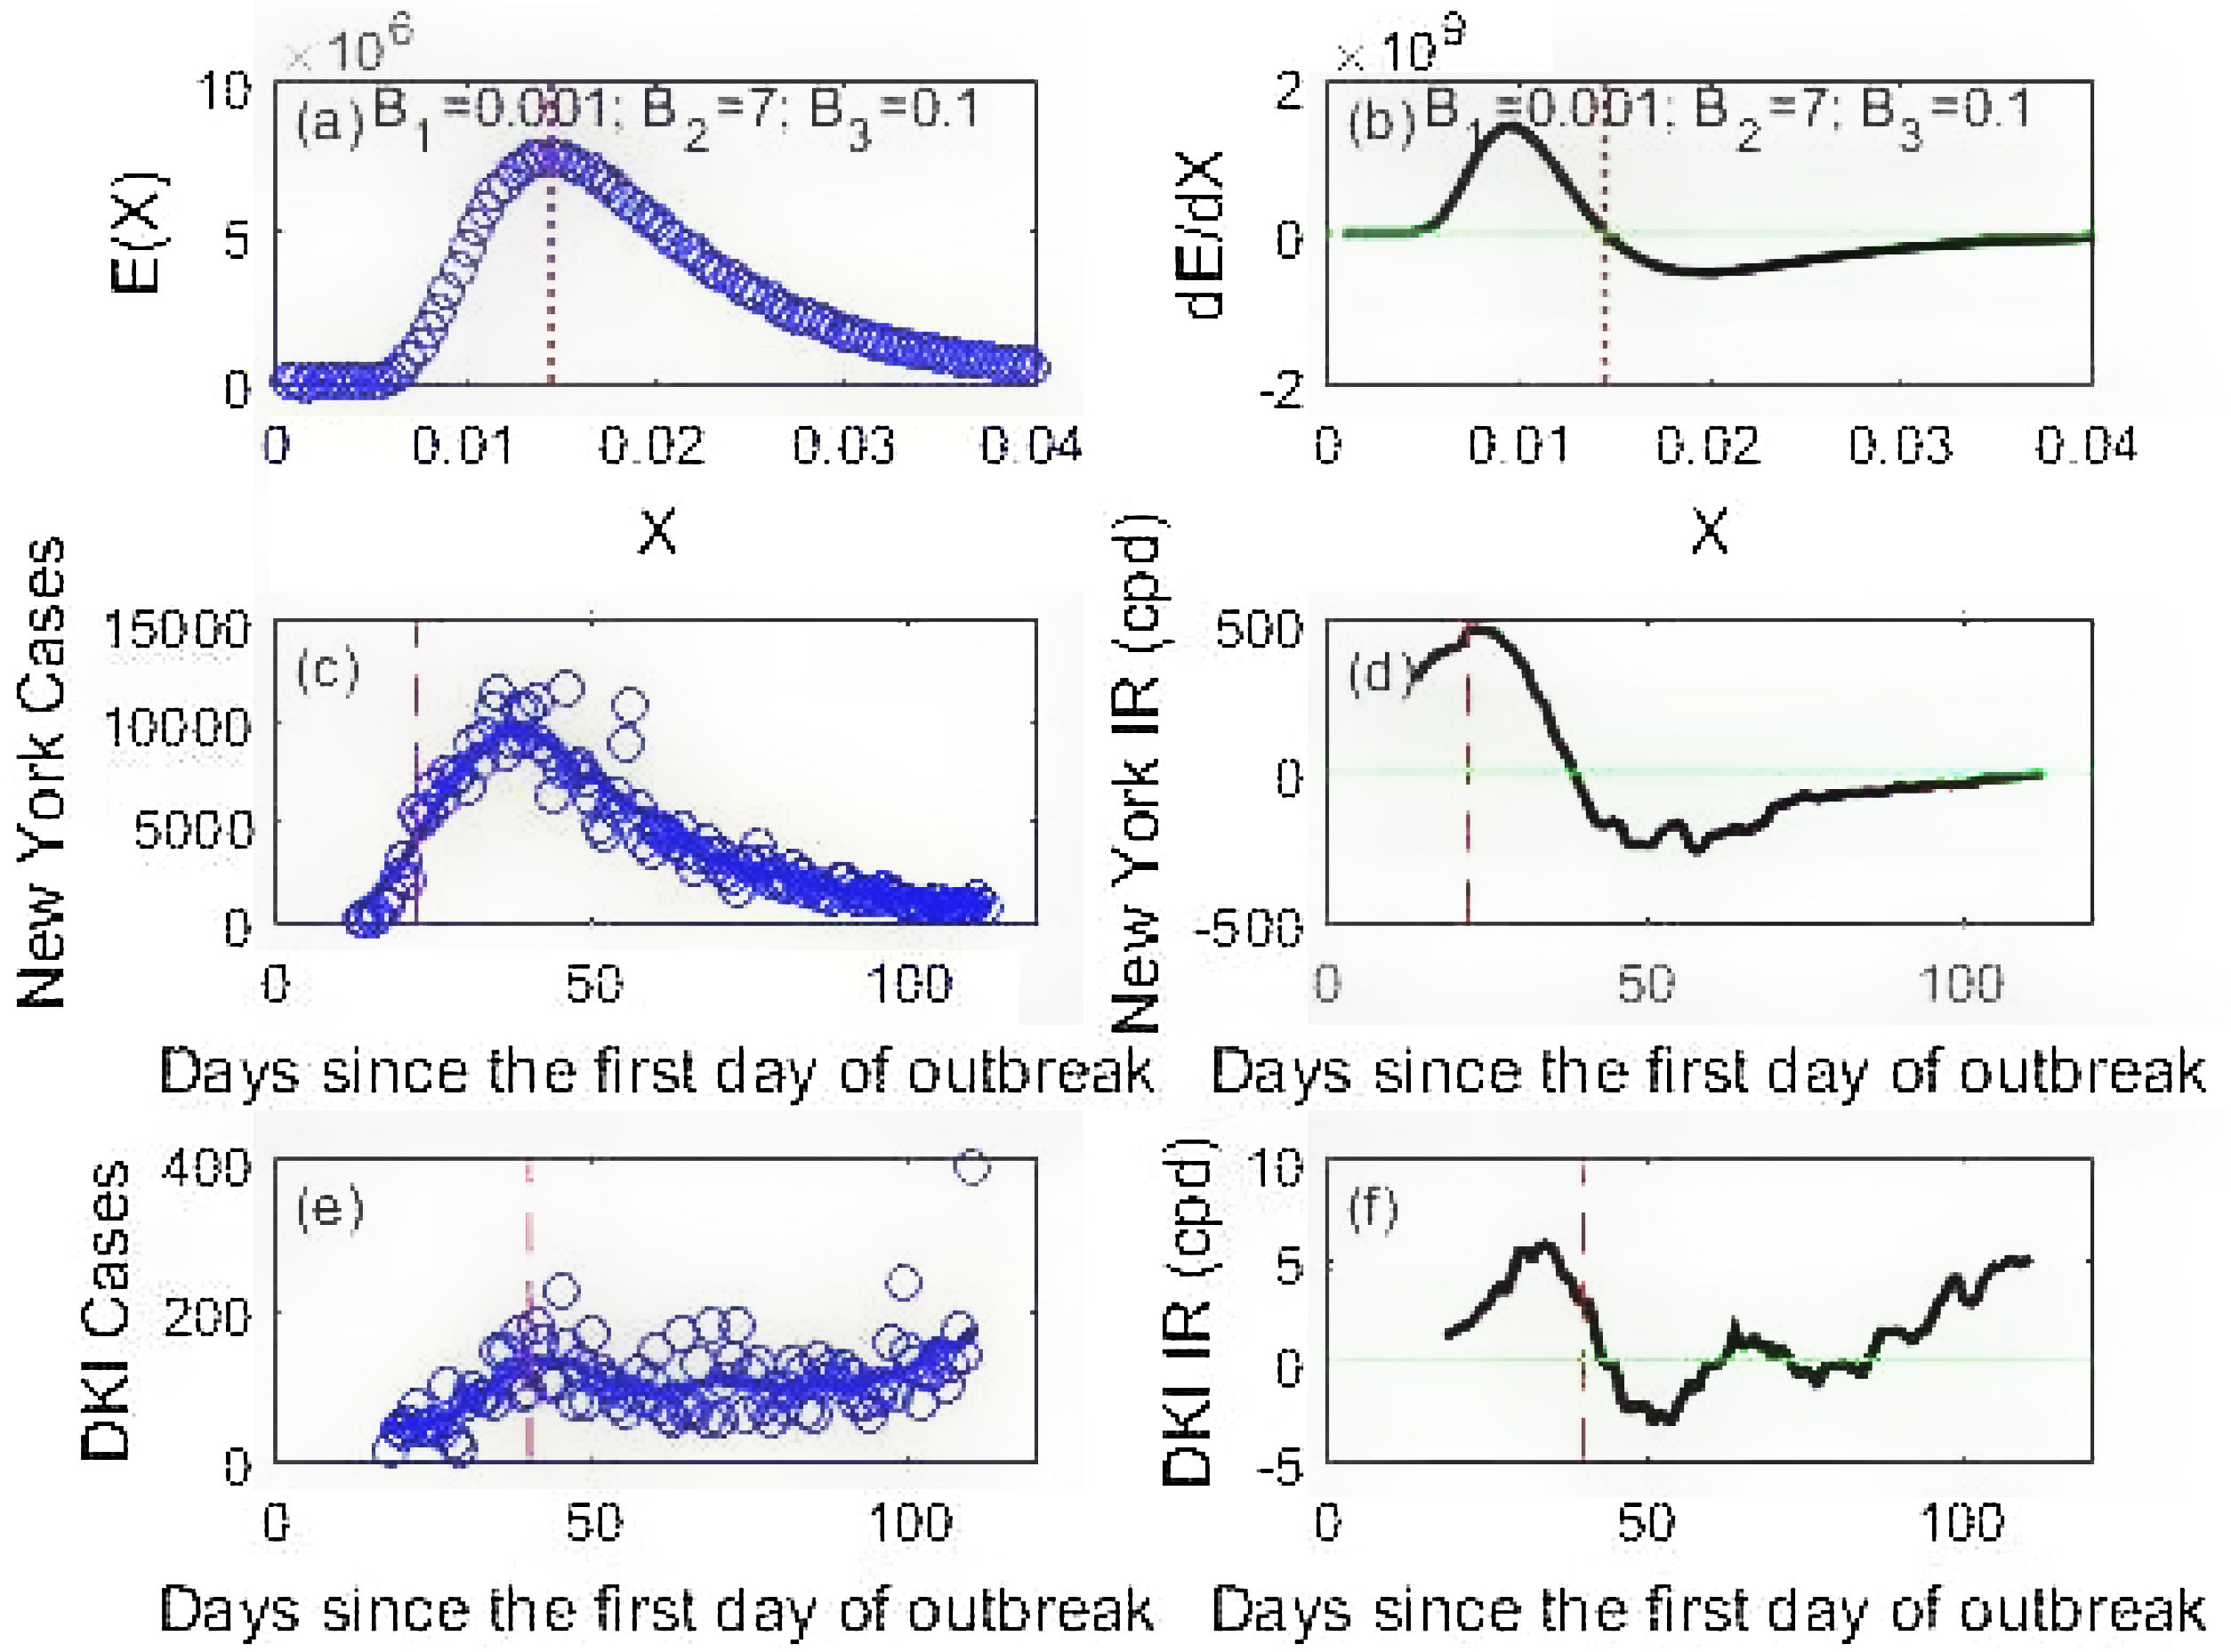
Equation (2) is used to generate simulated data and together with COVID-19 data from New York and DKI Jakarta, their features are drawn in Fig. 2. It is important that the COVID-19 data is smoothed using a 14-day moving average using a MATLAB programming15 before using it for making predictions. The smoothed data is important in reducing the noise for further data processing, i.e. calculating its derivatives. This process of differentiation needed for obtaining the rate of infection add more noise to the data as can be seen in Fig. 2d and f. Fig. 2 presents important features. First, the presence of both acceleration and deceleration phases are clearer by inspecting the first derivatives in Fig. 2b, d and f. Second, there is a contrast between New York and DKI Jakarta infection rates. The New York infection rate (Fig. 2d) perfectly resembles the BE derivative (Fig. 2b) while that of DKI curve is still crossing the green line in many occasions. The difference has an important implication in the issue of epidemic containment discussed later on.
, the New York (c) and DKI Jakarta epidemic curves (e). The cases are depicted as blue circles. The first derivatives w.r.t (with respect to X) of the BE distribution and the first derives w.r.t time (the rate of infection IR) of the smoothed epidemic curves (solid blue lines) for New York and DKI Jakarta are plotted in (b), (d) and (f). The dotted red line is the location of the peak of the BE distribution, while the dashed red lines are the time when the social restriction began. The green horizontal line is the line associated with dE/dX=0 or IR=0.")
The BE energy distribution (a), the New York (c) and DKI Jakarta epidemic curves (e). The cases are depicted as blue circles. The first derivatives w.r.t (with respect to X) of the BE distribution and the first derives w.r.t time (the rate of infection IR) of the smoothed epidemic curves (solid blue lines) for New York and DKI Jakarta are plotted in (b), (d) and (f). The dotted red line is the location of the peak of the BE distribution, while the dashed red lines are the time when the social restriction began. The green horizontal line is the line associated with dE/dX=0 or IR=0.
In this work, we use different number of inputs to predict a fixed number of outputs. Here, we choose to produce up to 14 values in advance out-of-sample prediction. Therefore, for a daily data, the model predicts up to 14 days ahead. The first prediction use the first eight inputs of X, the second prediction uses nine inputs, etc. while maintaining the same forecasting horizon of 14 days in advance for each prediction P. This is called a rolling forecast scheme.16 To do the prediction, we first generate two different data sets, i.e. training and testing data sets. For the training data set, we then apply a nonlinear fitting with initial value for the parameters B1=0.001, B2=7 and B3=0 to map between input/output pairs for the training data set. The X versus P mapping results in the final model parameters. The nonlinear fitting subroutine used is called NLINFIT from MATLAB with its robust weight function called ‘bi-square’. The final parameters are then fed into the model using the 14 testing inputs data set to give the 14-day predictions. The prediction skill of the model using simulated data, New York cases and DKI Jakarta cases are measured using predictability – the coefficient of determination R2 and RMSE (root-mean-squared-error) of.17
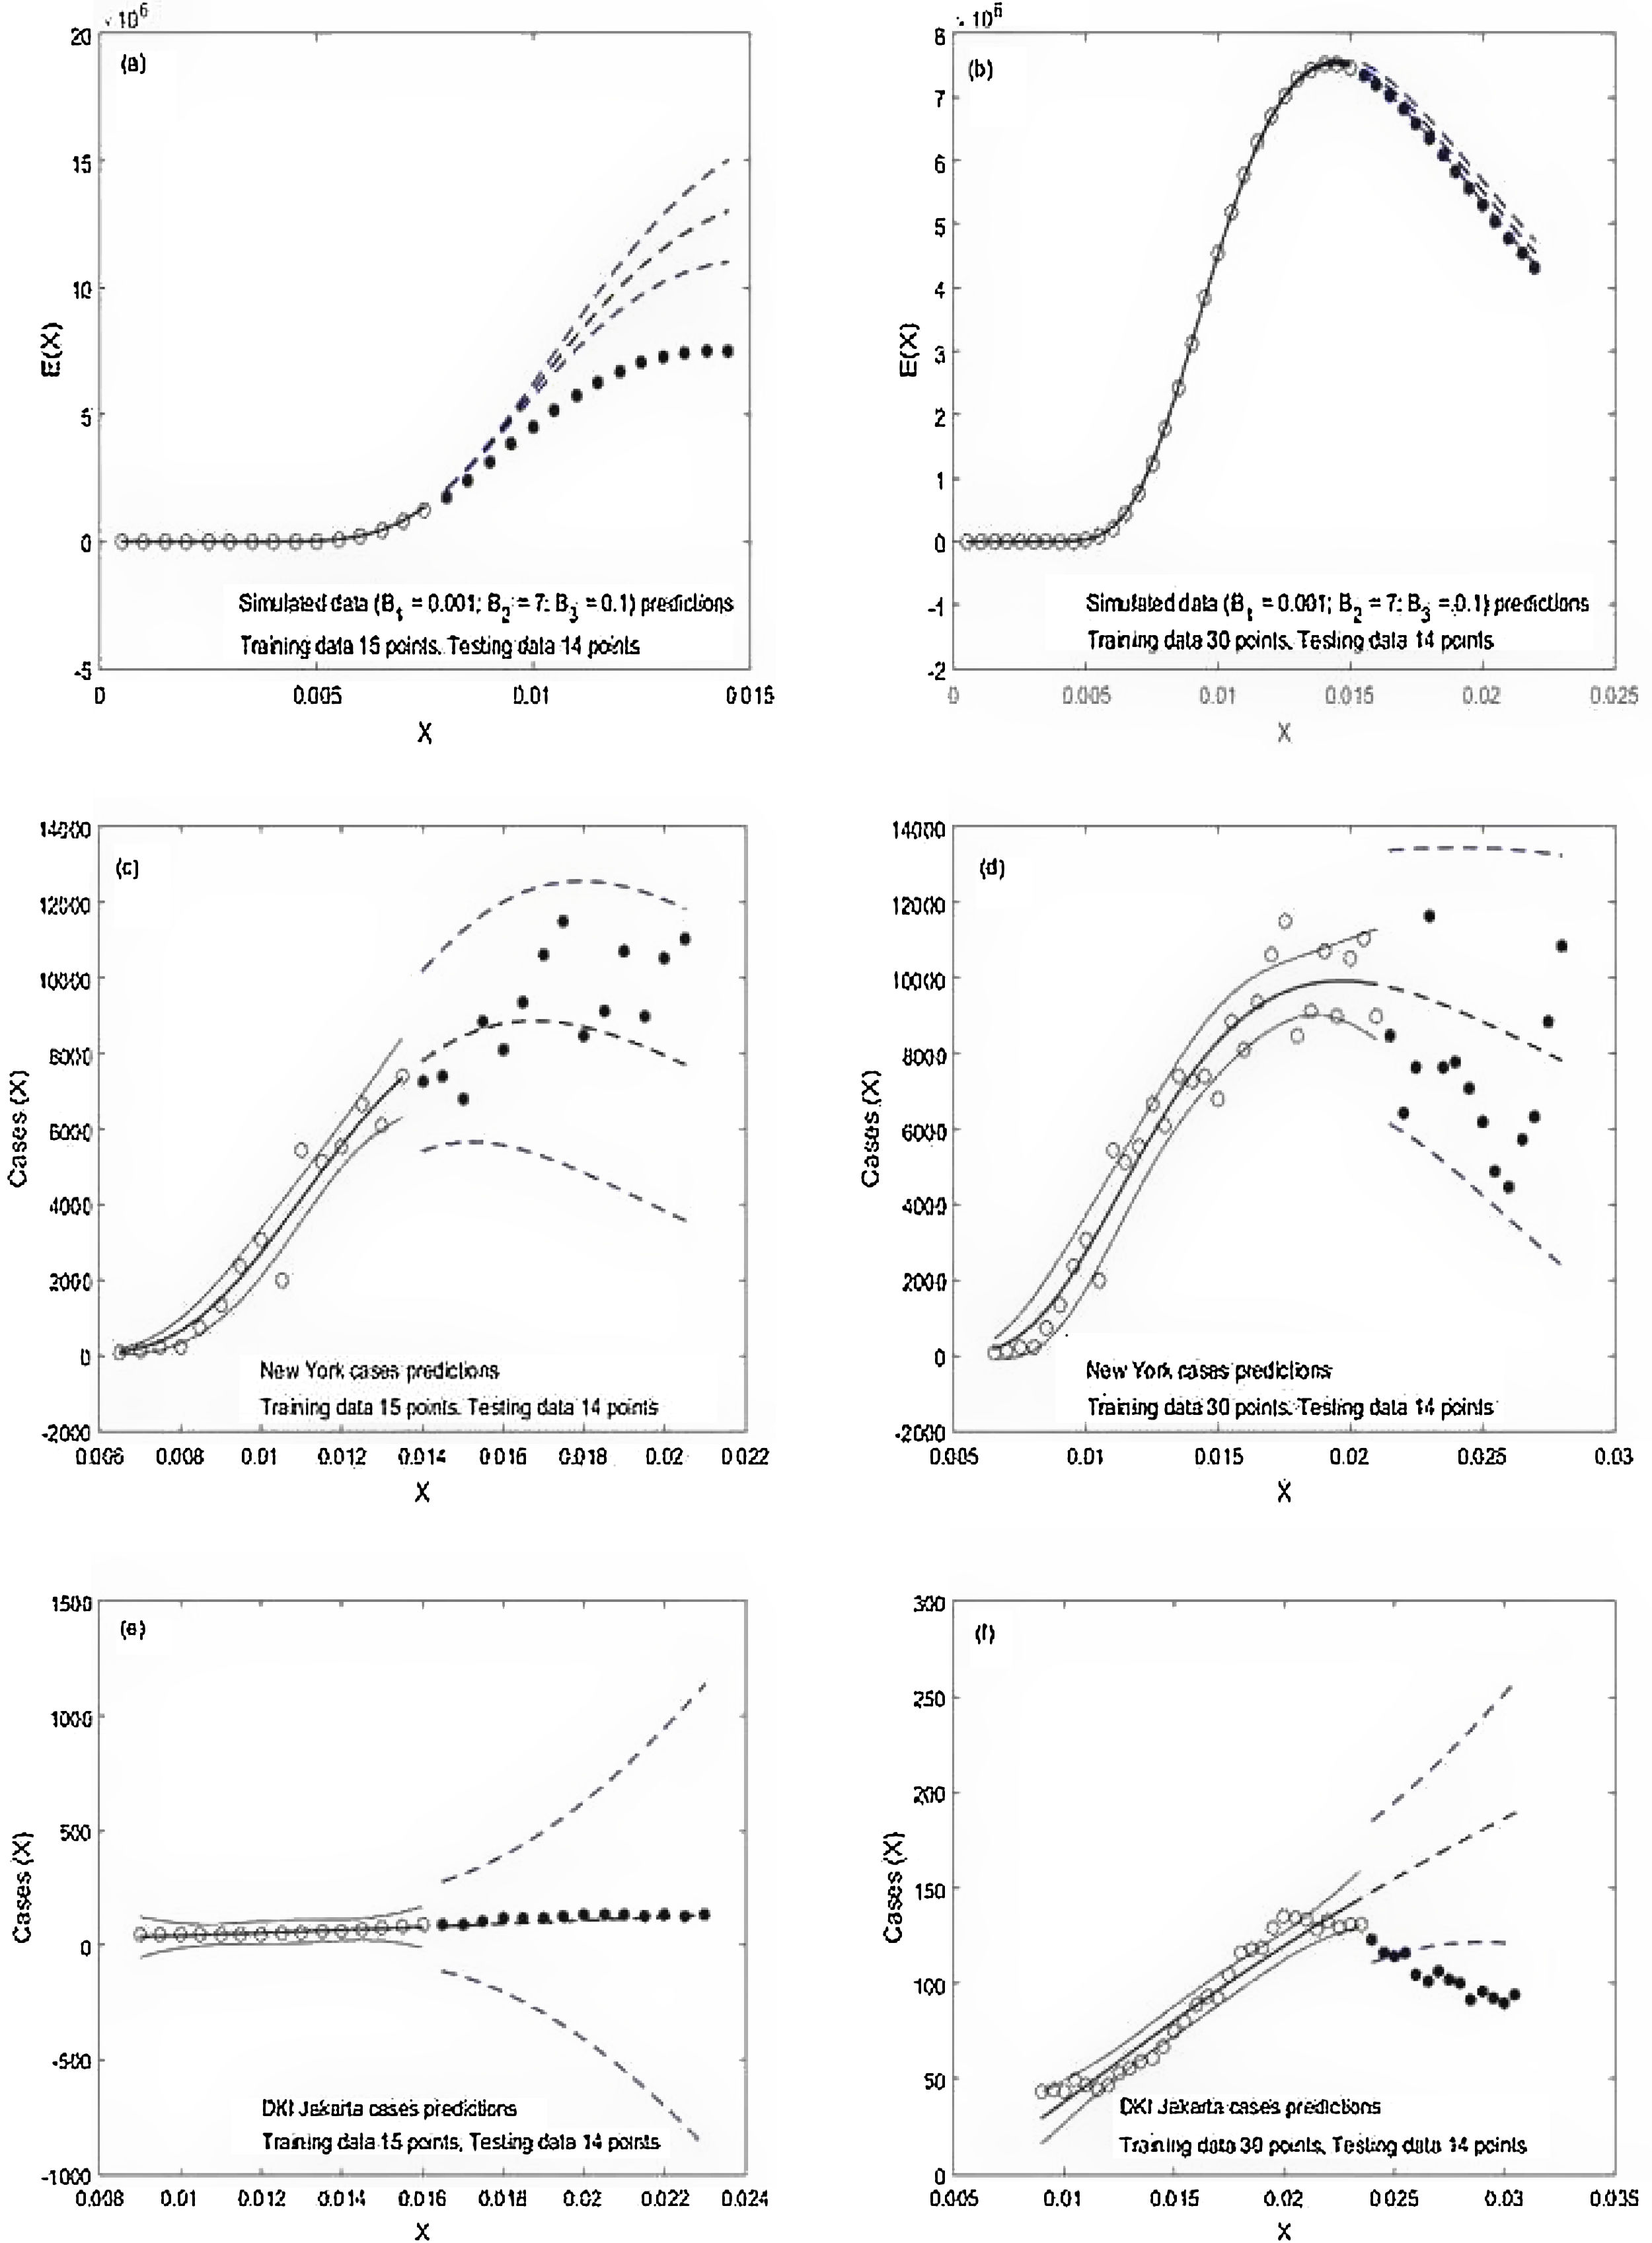
Result and discussionTwo examples of model predictions for each of the three data sets are presented In Fig. 3. They are: Simulation (Fig. 3a and b), New York cases (Fig. 3c and d) and DKI Jakarta cases (Fig. 3e and f). We only want to pay attention to the out-of-sample predictions of the three data sets. Model predictions for the simulation data set before the peak are poor. Significant over predictions occur as can be seen when the full circles are much lower beyond the broken lines. After the peak, predictions improve. The broken lines start to come closer to the full circles. Model prediction for New York is significantly better than that of the simulation data. The observed cases (full circles) observed before and after the peak are well within the broken lines. The model prediction for the DKI Jakarta cases has different features. Before the peak, the 95% confidence interval predictions represented by the broken lines are too wide. After, the peak, predictions become poorer. The majority of observed cases (full circles) are out of bound.

The observed data during the training is depicted in circles while the observed data of the testing is shown as full circles. The solid and broken lines in the middle are the predictions during the training and testing, respectively. The broken lines are the 95% confidence interval of the prediction.
Over predictions and excessively wide confidence interval of a prediction obtained in this study have also been reported earlier.8–11,18 Over predictions occurring in the real data set could be explained by the presence of intervention in reducing social contact amongst infected and healthy people.19–22 However, over prediction and excessively wide confidence interval in the simulation data set needs to be addressed further by using other robust fitting algorithms and exploring different fat-tail distributions related to a pandemic.12,13
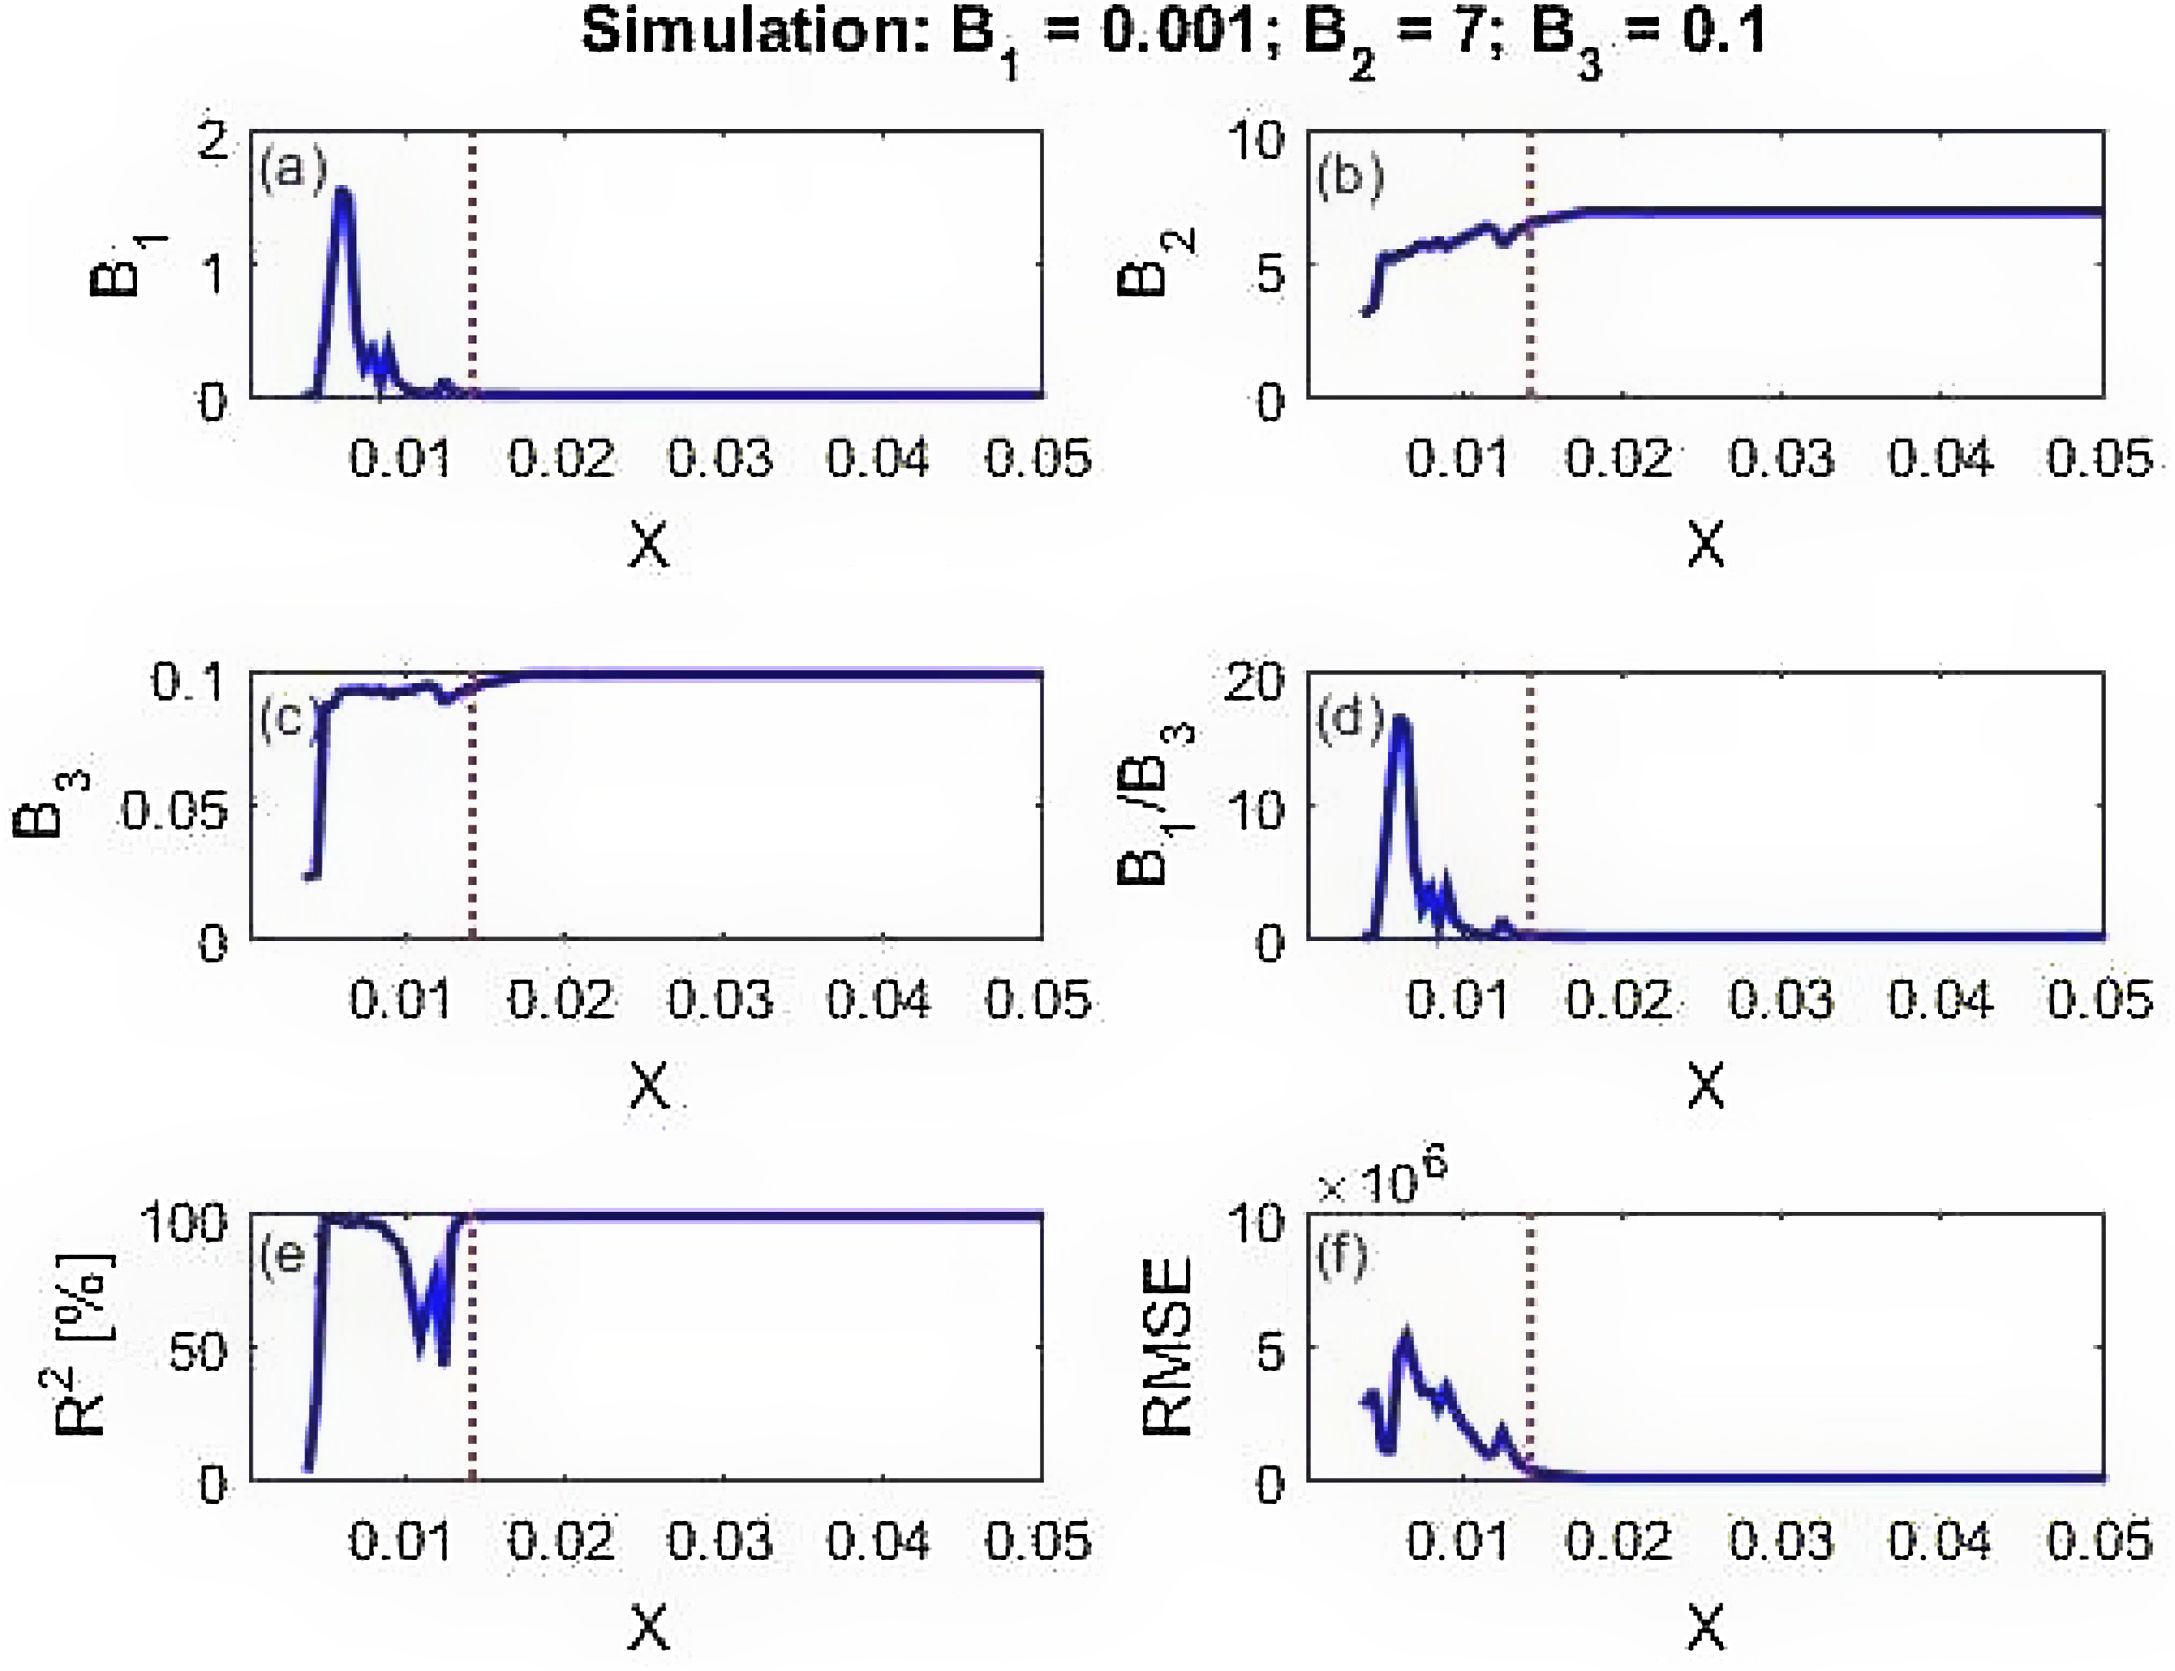
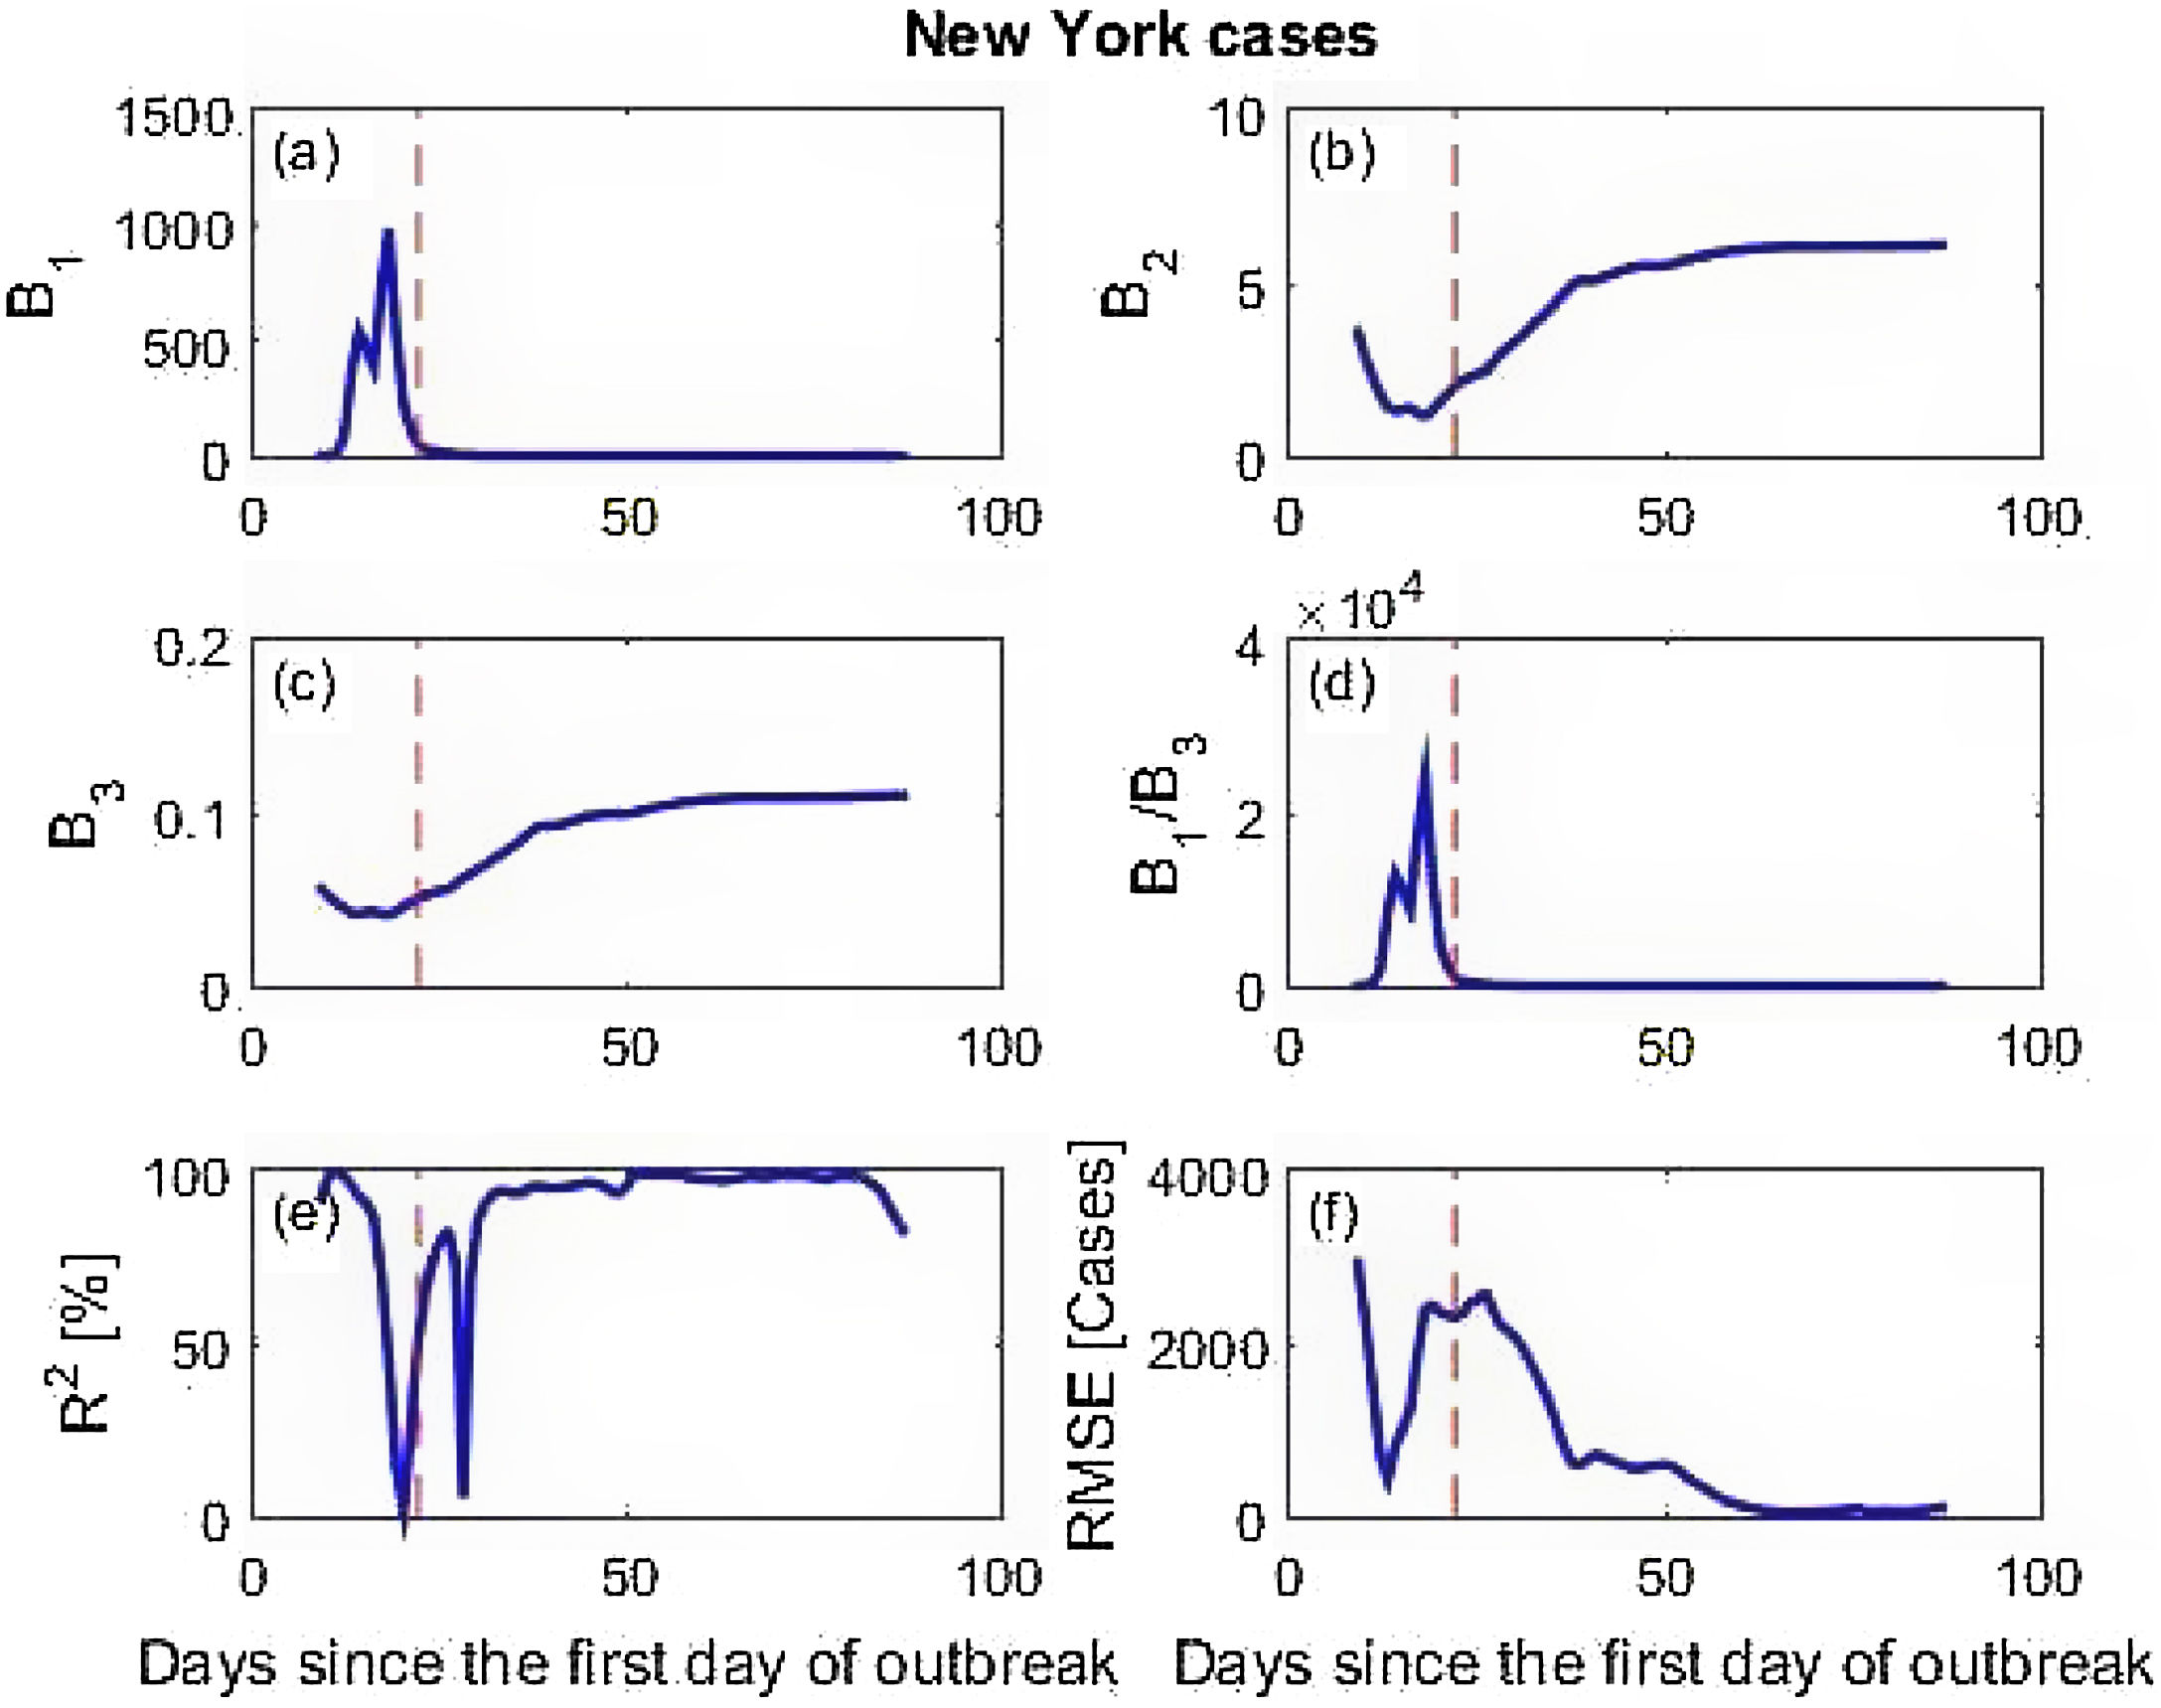
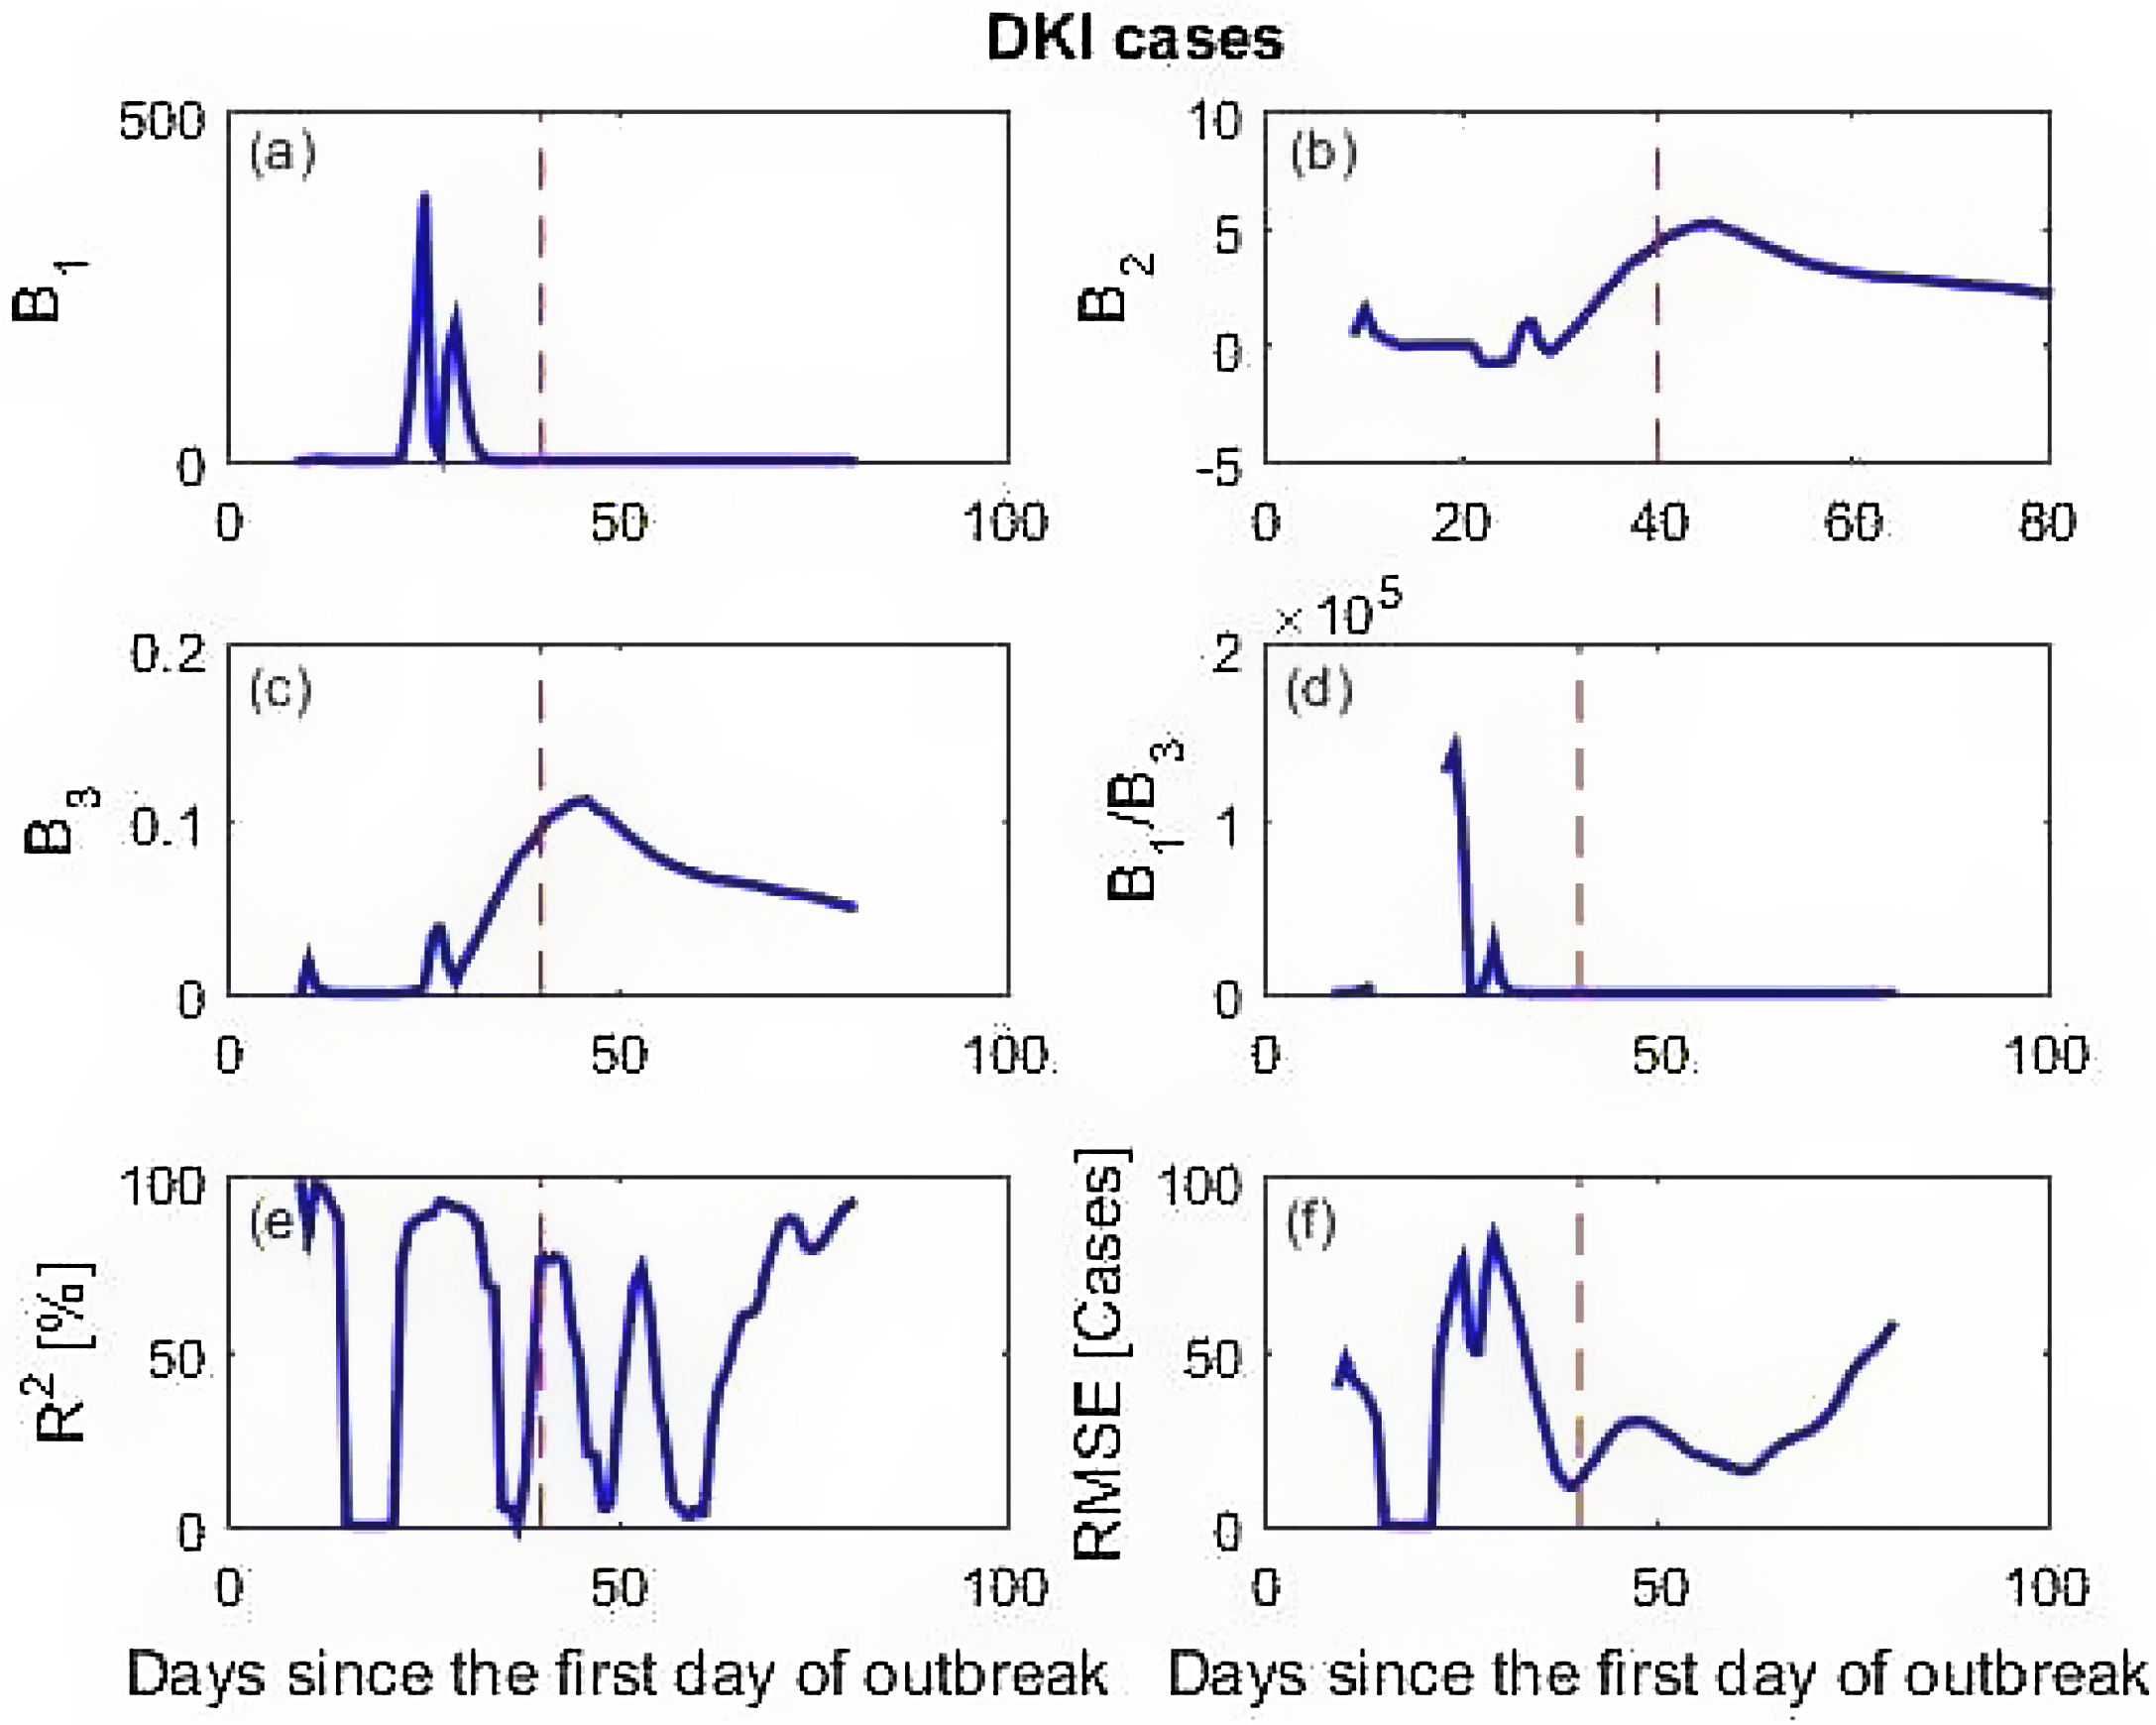
Calculated parameters and prediction skill of the three data sets are presented in Fig. 4 (simulation data), Fig. 5 (New York cases) and Fig. 6 (DKI Jakarta cases). Fig. 4 shows that before the peak of BE distribution, all calculated parameters wildly fluctuate. This leads to low prediction skill. But as the X inputs pass X=0.02 onward, the calculated parameters stabilize to the values given for simulating the data set. As a consequence, the model prediction skill metrics for the simulation data are close to 100% predictability (R2) and RMSE equals to 0. Similar finding is obtained for the New York cases described in Fig. 5. At prediction has low skill before the peak due to the spurious calculated parameters B's. After day 60, however, the skill improves with predictability is near 100% and RMSE is very small. The DKI Jakarta cases presented in Fig. 6 are quite different. The prediction skill metric wildly oscillate up to the end of the series. Both metrics do not behave as expected, i.e. converge into high predictability and low RMSE. If we recall back, this different behaviour is also appeared in the rate of infection (Fig. 2f).


 order.")
DKI Jakarta is still unable to contain the virus spread amongst its population. If we compare Figs. 5 and 6 and focus the timing of applying the social restriction order, New York started the order much earlier than that of DKI Jakarta. The importance of applying earlier social restriction in reducing virus spread has been demonstrated.23–25
ConclusionsA simple model is developed to predict up to 14 days in advance Covid-19 cases. The model is obtained through a nonlinear curve fitting of the BE distribution. The out-of-sample rolling prediction has been validated extensively against three data sets. The skill of the model is poor when predicting the early progress of the epidemic but the skill improves significantly toward the end of the epidemic. The model is capable of providing an early warning in deciding whether or not to continue the social restriction order for containing an epidemic.
Supplementary dataThe supplementary data (Covid-19 data sets and model verification results) can be found on this GitHub repository: https://github.com/Andika9807/Data_ModelCovidHalmar
Conflicts of interestThe authors declare no conflict of interest.
I express my gratitude to WORLDOMETER for providing the daily New York Covid-19 cases and the DKI Jakarta province for sharing the public of its daily Covid-19 cases through their websites. I also thank Mr Andika for type-setting the equations and archiving the Supplementary data.
Peer-review under responsibility of the scientific committee of the 3rd International Nursing, Health Science Students & Health Care Professionals Conference. Full-text and the content of it is under responsibility of authors of the article.


