
To describe 2000-2005 time trends of prescription for NSAIDs, proton pump inhibitors (PPIs) and hospital admissions for gastrointestinal (GI) bleeding.
MethodsTime series analysis of gastrointestinal (GI) bleeding admission and drugs’ Defined Daily Dose per 1000 people per day (DDD/1000/day) in the Region of Valencia, Spain, from January 2000 to December 2005.
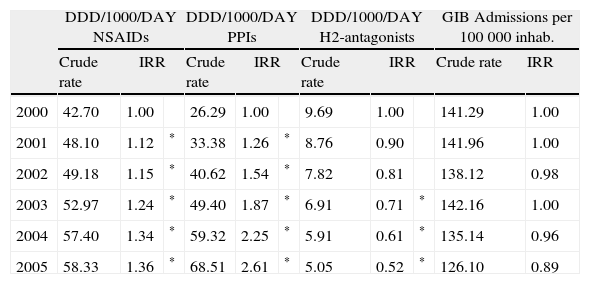
ResultsDispensation of NSAIDs went from 42.7 DDD/1000 people/day in 2000 to 58.3 DDD/1000 people/day in 2005. During the same period, dispensation of PPIs went from 26.3 DDD/1000 people/day to 68.5 DDD/1000 people/day (both are statistically significant). The rate of hospitalisations for gastrointestinal bleeding during this period oscillated between 142 and 126 admission per 100 000 inhabitants/year. No year showed significant differences compared to 2000.
ConclusionA substantial increase in the NSAID use from 2000 to 2005 was not accompanied by changes in GI bleeding hospitalisation rates in Valencia, but GI bleeding rates continued to be high, suggesting a need to improve NSAIDs use.
Describir las tendencias temporales durante el periodo 2000-2005 de la prescripción de AINE, inhibidores de la bomba de protones (IBP) y los ingresos hospitalarios por hemorragia gastrointestinal (GI).
MétodosAnálisis de series cronológicas de ingresos por hemorragia GI y de las dosis diarias definidas (DDD) de medicamento por cada 1.000 personas y día (DDD/1.000/día) en la Comunidad Valenciana desde enero de 2000 hasta diciembre de 2005.
ResultadosLa dispensación de AINE ha aumentado desde 42,7 DDD/1.000/día en 2000 a 58,3 DDD/1.000/día, y la de IBP pasó de 26,3 DDD/1.000/día a 68,5 DDD/1000/día (ambos son cambios estadísticamente significativos). La tasa de ingresos por hemorragias GI durante este periodo pasó de 142 a 126 por cada 100.000 habitantes/año. En relación a 2000, ninguno de los años analizados muestra diferencias significativas.
ConclusionesEl aumento sustancial del uso de AINEs entre 2000 y 2005 no se vio acompañado de cambios en la tasa de ingresos hospitalarios en Valencia, pero la tasa de hemorragias GI siguieron siendo altas, lo que sugiere que es necesario mejorar la utilización de los AINE.
The last few decades have seen a decline in the global prevalence of uncomplicated ulcer disease, expressed in a drop in hospital admissions, surgery and specific mortality.1–4 This decline is attributed to the decreasing prevalence of Helicobacter pylori infection and the widespread use of acid suppressant drugs, particularly proton pump inhibitors (PPIs).5 In contrast to this general trend, there has been a simultaneous rise in hospitalisations for perforated ulcer and acute gastrointestinal (GI) bleeding, particularly in the elderly and in women, although these trends vary from country to country.5,6 The increase in these problems is attributed to a longer life expectancy, the aging of the population and the consequent increase in the prevalence of cardiovascular and rheumatic diseases treated with acetylsalicylic acid and other anti-platelet agents, anticoagulants and nonsteroidal anti-inflammatory drugs (NSAIDs). Other drugs, such as the selective serotonin reuptake inhibitors (SSRI), whose use is becoming more popular, have also been linked to GI bleeding.7,8
In the last few years, there has been an interesting discussion about the greater or lesser gastric tolerance to the different therapeutic classes of NSAIDs. Of particular concern are the COXIBs, whose role has been widely debated, because the initial rapid rise in their use has lead to a jump in the total volume of people treated with NSAIDs (both selective and non-selective) and some ecological studies suggest that this increase may be linked to a rise in the rate of GI bleeding.9–11 In Spain, various measures have contributed to a decrease in the use of COXIBs and to limiting prescriptions of selective NSAIDs until the announcement of the withdrawal of rofecoxib. These include the significant impact of a safety warning issued by the Spanish Agency for Drugs and Medical Products (September, 2001) alerting to the cardiovascular risks of COXIBs,12,13 the implementation in 2002 of a prior authorisation requirement before their dispensation12,13 and various interventions by the Regional Health Care Departments, including the implementation of economic incentives to Primary Care physicians that penalised the prescription of COXIBs.14 Nonetheless, in spite of this limit on consumption of COXIBs, the use of NSAIDs overall has continued to grow over the last few years, propelled above all by propionic acid derivatives, which have been evaluated positively in Spanish pharmaceutical indicators associated with economic incentives.14 It is possible that the global increase in the use of both selective and non-selective NSAIDs has been accompanied by an increase in the incidence of complications of peptic disease and, particularly, of GI bleeding.
The aim of this study was to describe time trends in the prescription of NSAIDs and PPIs, and the incidence of hospital admissions for GI bleeding from January 2000 to December 2005 in the Region of Valencia (Spain) and to use ecological analysis to study possible associations between these phenomena.
Material and methodsDesignA time series analysis to examine trends in hospitalisation for GI bleeding and the dispensation of NSAIDs and PPIs in a Spanish region from January 2000 to December 2005.
SettingThe study was conducted in the Region of Valencia, with a population of 4 120 729 in December 2000, and of 4 692 449 at the end of the study period, December 2005. The Valencia Health Agency (VHA) is a public health care organisation administered by the Government of Valencia that provides free primary and hospital health care to all the inhabitants of Valencia. The VHA manages its own network of 23 acute general hospitals, including several university hospitals, with more than 9400 hospital beds (84% of the hospital beds in the Valencia) and deals with about 78% of Valencia's hospital discharges. Patients, as in the rest of the Spanish National Health System, receive broad pharmaceutical benefits: medicines are free of charge for retired and disabled people, victims of occupational accidents and diseases and in-hospital patients. The other patients pay 40% of the price of prescription drugs, although for chronic diseases they only pay 10%, with a limit of €2.45 (1 Euro ≈ 1.40 U.S. dollar).
Data SourcesData about consumption of NSAIDs, PPIs and histamine-2 receptor antagonists (H2-antagonists) were collected from the invoices that pharmacies presented monthly to the VHA during the 2000-2005 period. These invoices provide the description of the commercial brands, presentation, dose and number of units per package for all the drugs dispensed through the public health plan. Information about admissions for GI bleeding was obtained from the VHA's Hospital Discharge Minimum Basic Data Set; a register of all hospitalisation episodes in the VHA network. Among other information, it included the main diagnosis causing the admission based on the International Classification of Diseases, Ninth Revision, Clinical Modification (ICD-9-CM). The population denominators for each year were obtained from the Spanish National Institute for Statistics.
VariablesThe following variables were selected to build the drug consumption series: 1) All drug dispensations corresponding to the M01A category, the non-steroidal anti-inflammatory and anti-rheumatic products of the Anatomical Therapeutic Chemical (ATC) Classification System, which included butylpyrazolidines, acetic acid derivatives, oxicams, propionic acid derivatives, fenamates, COXIBs, and other non-steroidal anti-inflammatory and anti-rheumatic agents; and 2) All drug dispensations from the ATC's A02BC category, proton pump inhibitors. In addition, drug dispensations from the ATC's A02BA category (H2-receptor antagonists) were selected, although these were not combined with the PPIs. All hospital admissions for GI bleeding during the period were selected. These included all hospitalisations with a primary diagnosis of gastric ulcer (ICD-9-CM: 531), duodenal ulcer (ICD-9-CM: 532), peptic ulcer site unspecified (ICD-9-CM: 533) and gastro-jejunal ulcer (ICD-9-CM: 534) with haemorrhage (fourth-digit equal to 0, 2, 4 or 6), gastritis with haemorrhage (ICD-9-CM: 535 with fifth-digit equal to 1), GI haemorrhage (ICD-9-CM: 578), haematemesis (ICD-9-CM: 578.0) and unspecified haemorrhage of GI tract (ICD-9-CM: 578.9).
Since different commercial presentations often contain different amounts of drug, it is possible to change this information into Defined Daily Doses (DDD) in the VHA's information system. The DDD, assigned by the World Health Organization Collaborating Centre for Drug Statistics Methodology, is assumed to be the average maintenance dose per day in a drug's main indication in adults.15 The DDD consumed per 1000 people per day (DDD/1000/day) for one therapeutic class provides, with a character of population rate, a rough estimate of the proportion of the population treated daily with a specific drug.
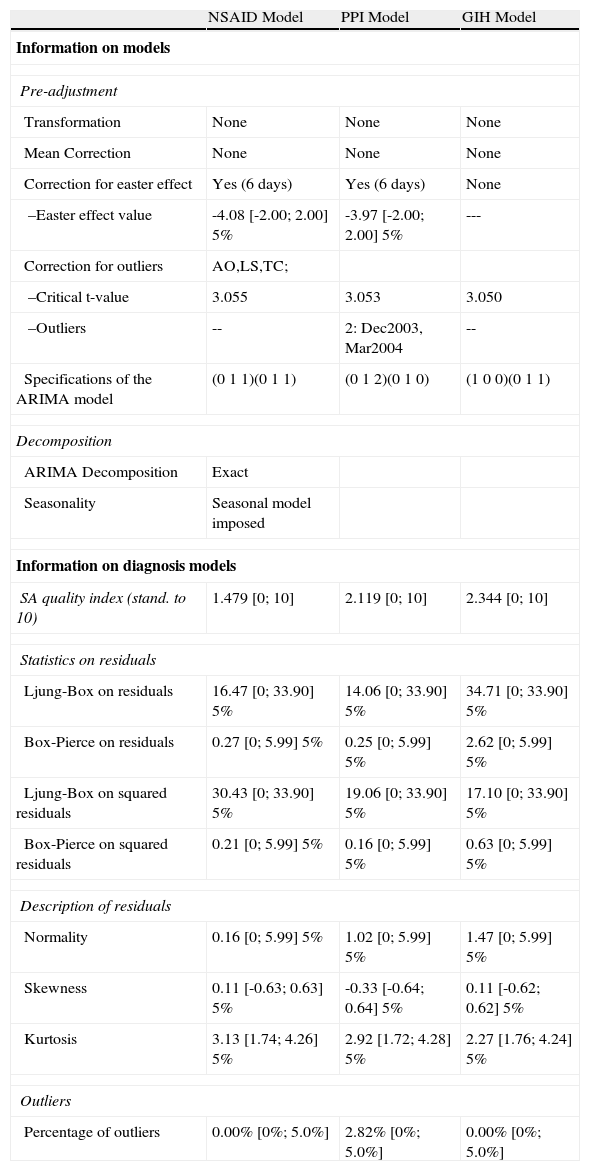
AnalysisFirst, the time series corresponding to the DDDs of the drugs analysed (NSAIDs and PPIs) and to hospital admissions for GI bleeding were built. Then, autoregressive integrated moving average (ARIMA) methods were used to determine stationarity and any possible autocorrelation.16,17 Next, the crude rates corresponding to the dispensation of the corresponding drugs were calculated in the DDD/1000/Day format, along with admissions for GI bleeding as the rate per 100 000 inhabitants using the population registered in the National Institute for Statistics Census each year. Poisson's regression was used to estimate the incidence rate ratio for each year compared to 2000, taken as the baseline year. Finally, the ARIMA models were once again used to design time series for the monthly dispensation of the drugs (DDD/1000/day) and admissions for GI bleeding per 100 000 inhabitants (pre-adjustments, design specifications and diagnostics for the 3 series are shown in Annex 1).
To evaluate the adjustment of the time series, the Ljung-Box and Box-Pierce statistics were used on residuals and squared residuals, as well as the normality test. The adjustment was to be rejected if one of the statistics was significant at 0.01, three were significant at 0.05 or if more than 5% represented extreme values. To build the new adjusted series, stationarity and autocorrelation were designed, depending on the case, and the extreme values were adjusted (Annex 1 contains the model's diagnosis). The trend slope and significance were estimated using linear regression with the seasonally-adjusted data. Correlation between series was assessed using the Pearson correlation, and multiple regression analysis was carried out to assess the independent association between the population dispensation of NSAID and PPI, and the rate of admission for gastrointestinal bleeding. The time series analysis was performed with the TRAMO-SEATS procedure from DEMETRA® statistical software, 2.04 version (European Communities). The other calculations were performed with STATA®, 9.2 version (Stata Corp., College Station, Texas).
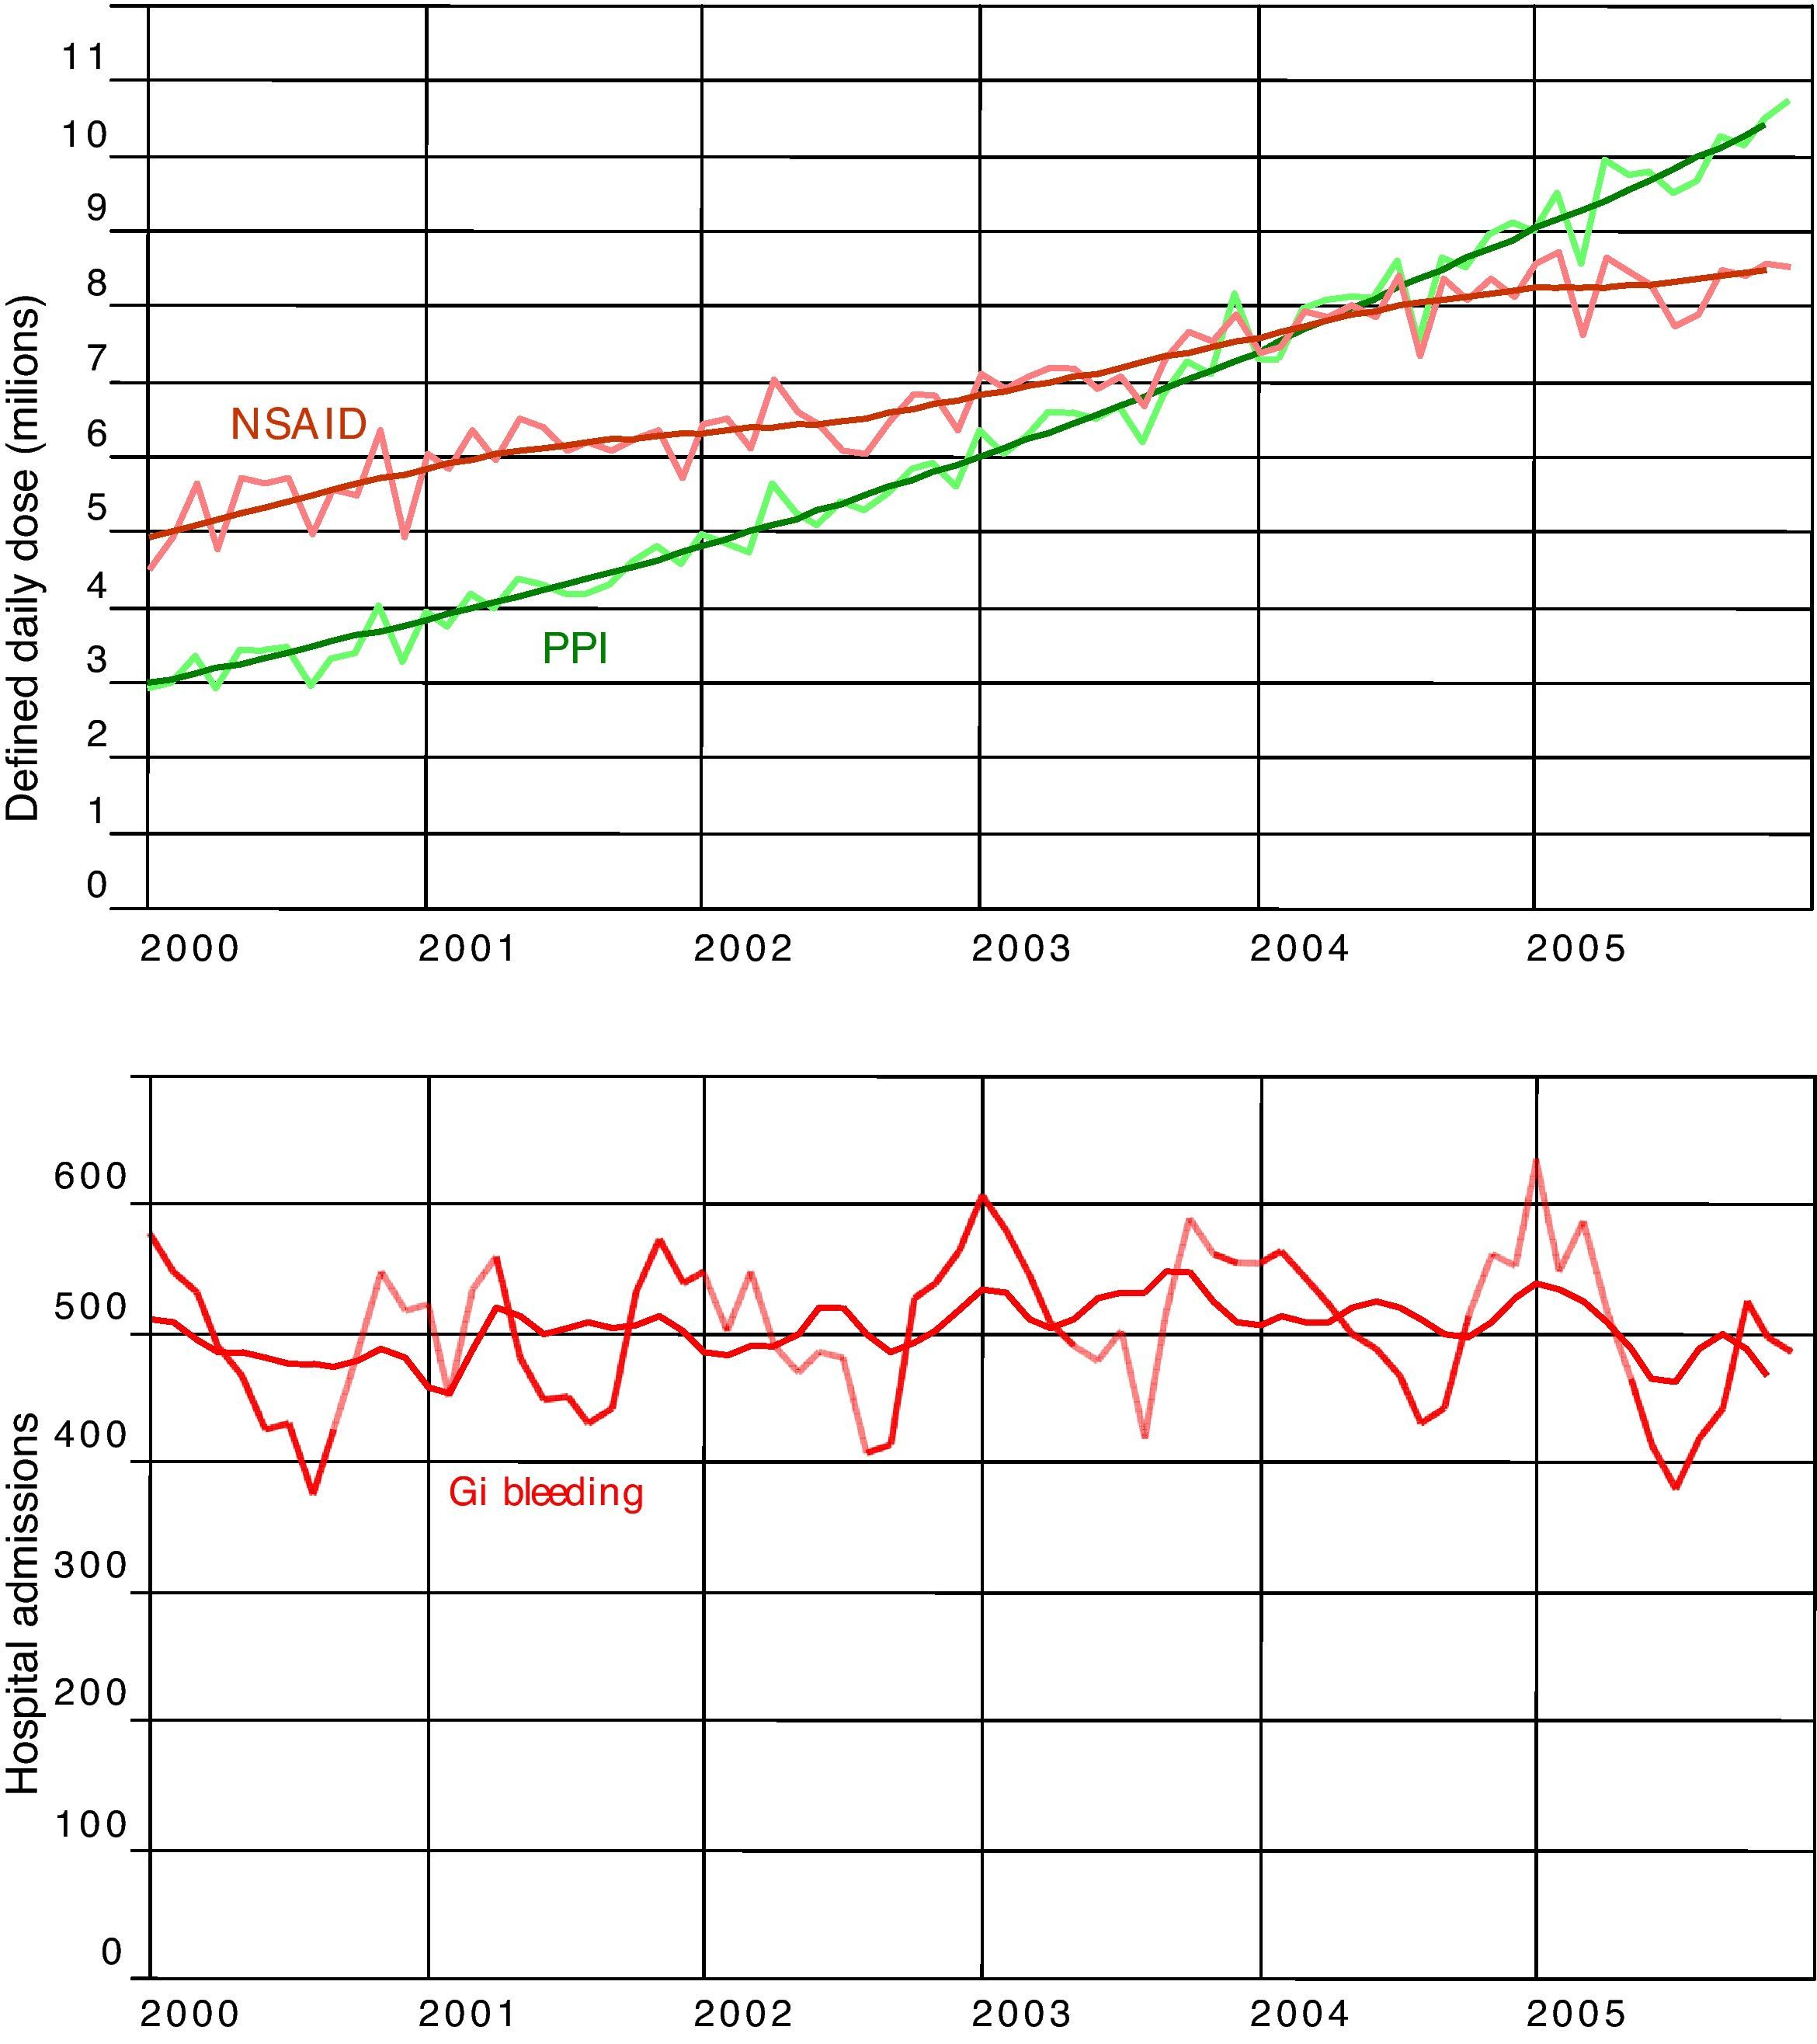
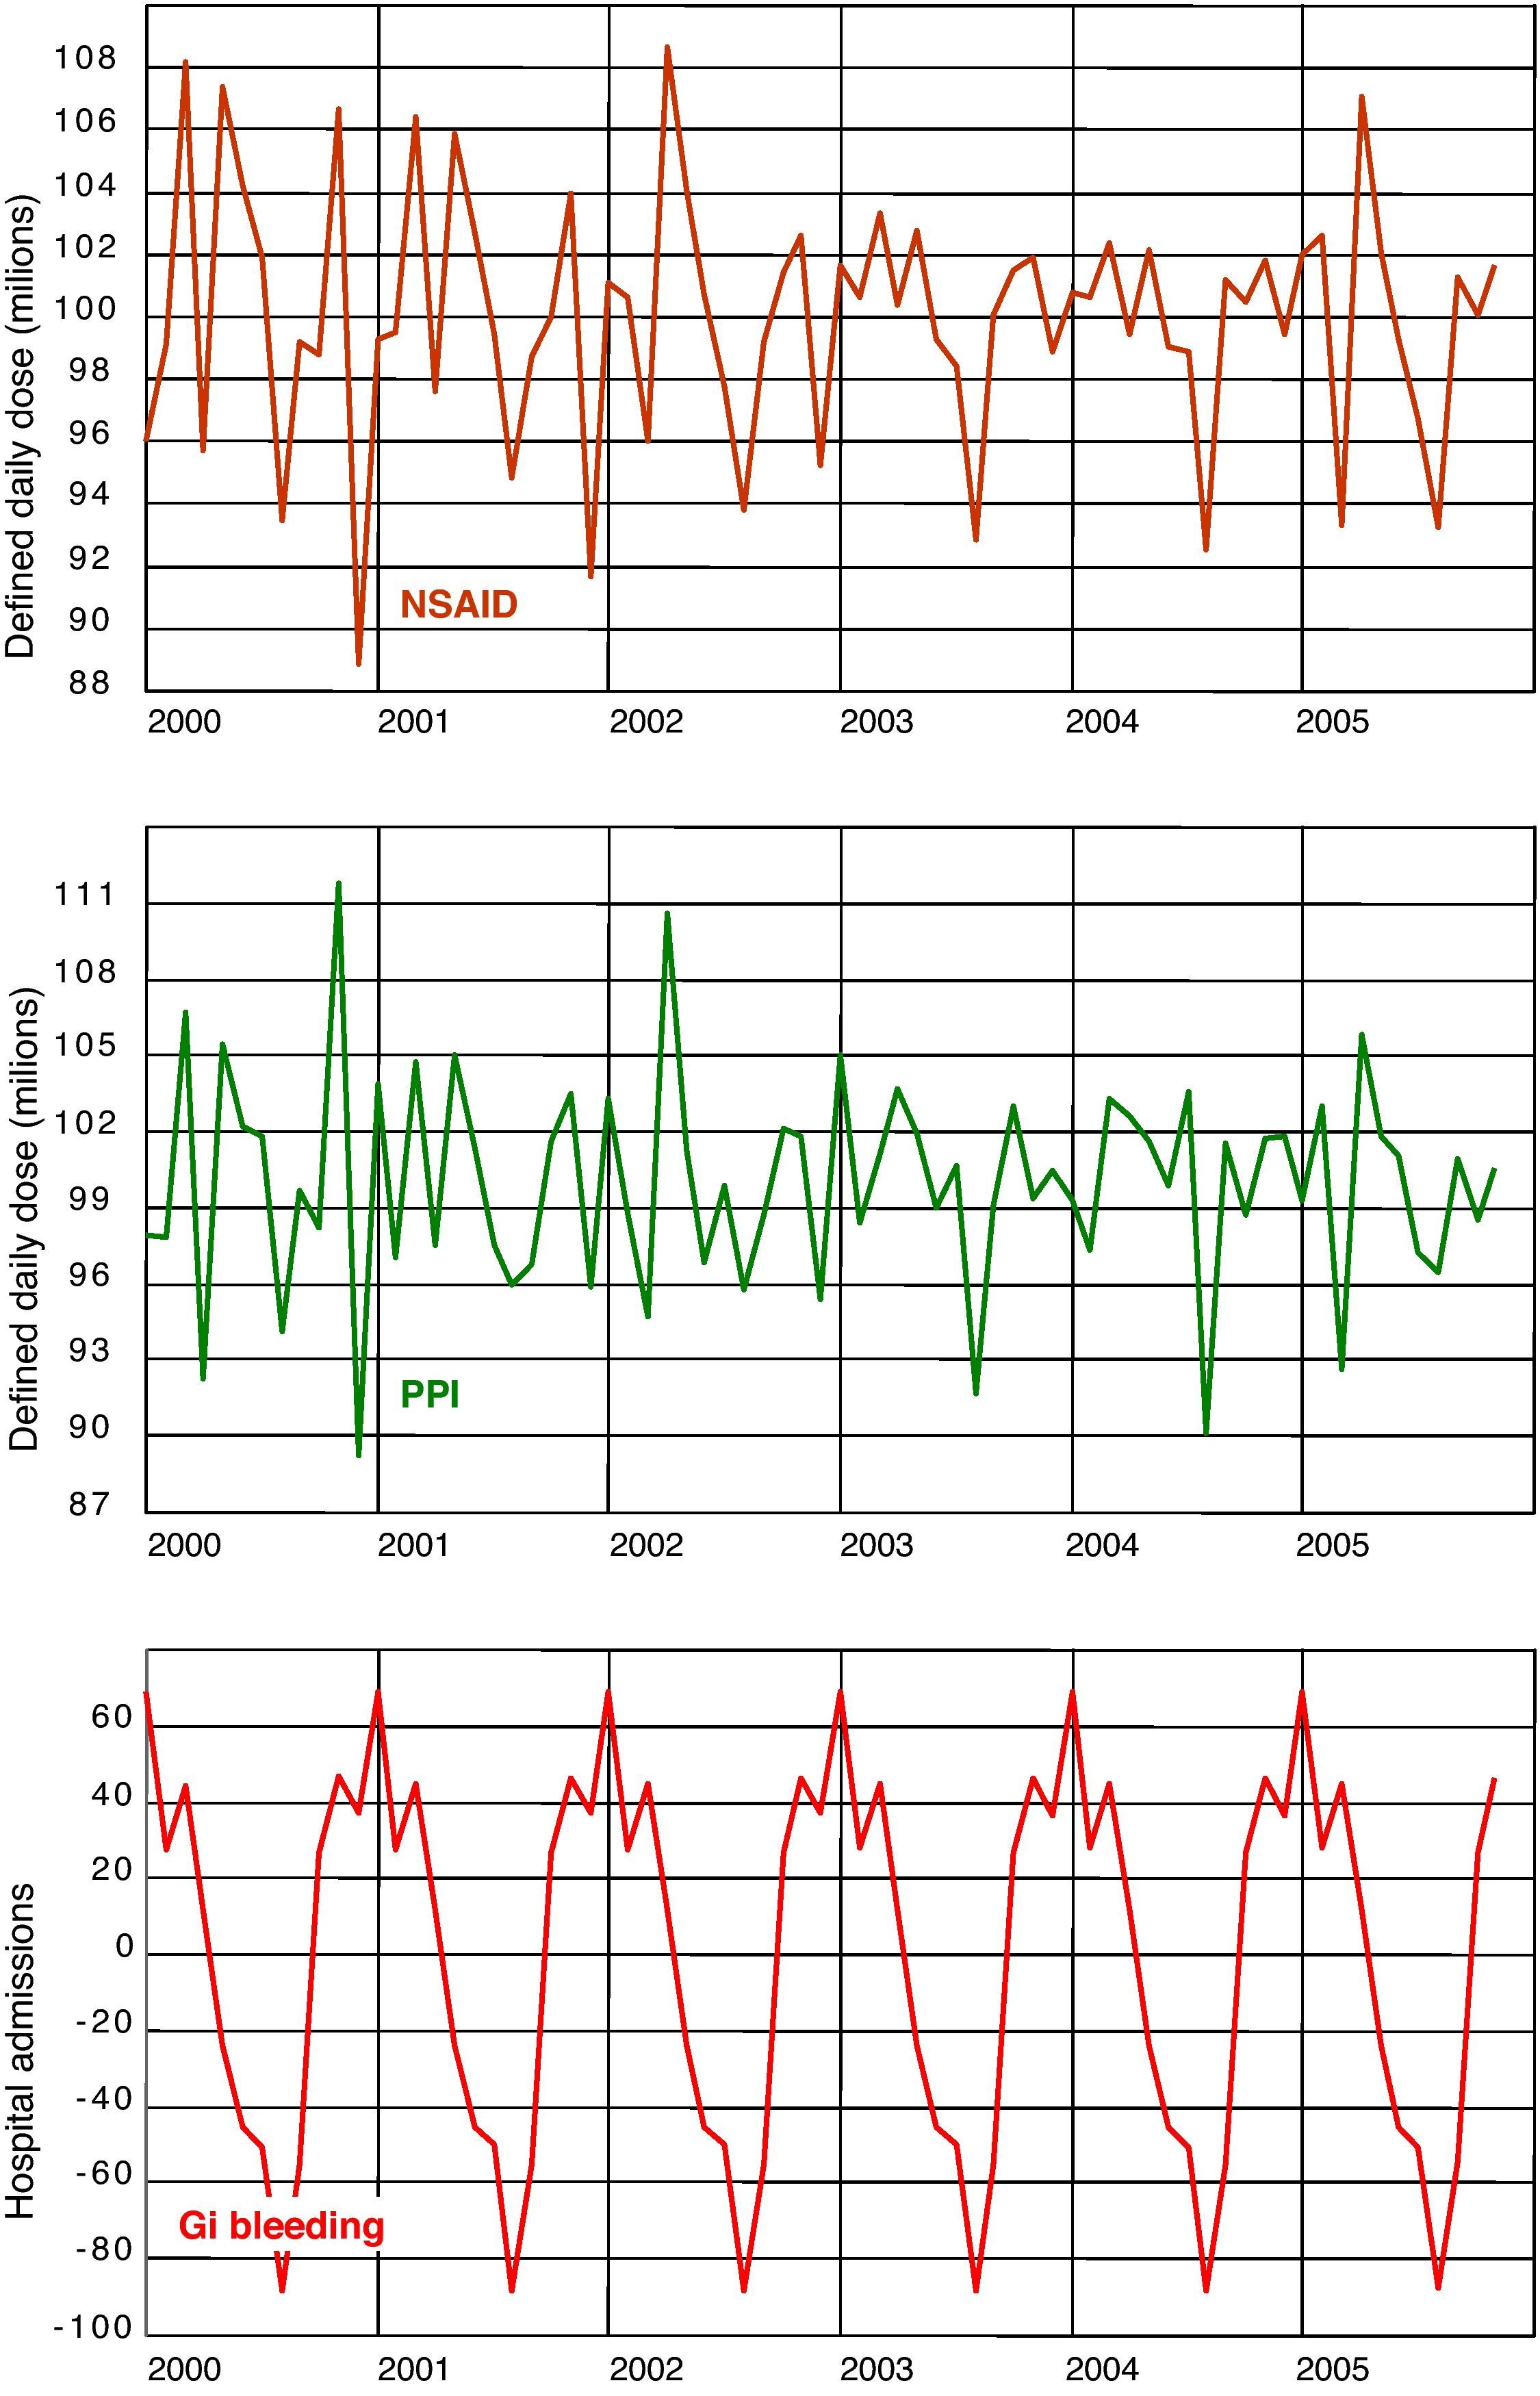
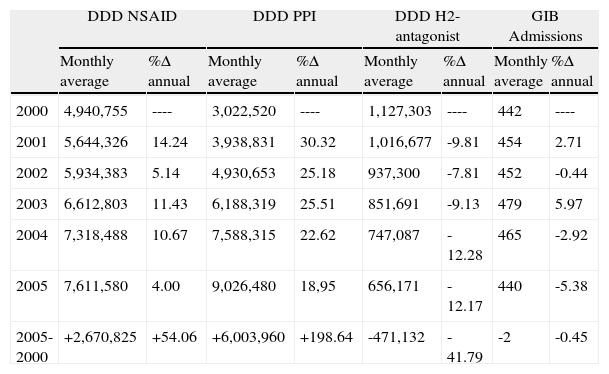
ResultsDuring the period studied, consumption of NSAIDs in the Region of Valencia (Table 1) rose by 54%, from close to 5 000 000 DDDs per month in 2000 to more than 7 600 000 per month in 2005. Meanwhile, the use of PPIs increased by almost 200%, from close to an average of 3 000 000 DDDs per month in 2000 to an average of more than 9 000 000 in 2005. The DDDs for the H2-antagonists dropped from 1 200 000 per month in 2000 to a little over 650 000 DDDs/month in 2005. The GI bleeding admissions remained virtually unchanged throughout the period studied. Figure 1 shows the raw time series for the DDDs, the NSAIDs and the PPIs, and hospital admissions for GI bleeding, together with the trends obtained after running the respective ARIMA models. Figure 2 shows the seasonal components of the three series, highlighting that consumption of both the NSAIDs and the PPIs had overlapping patterns, in particular, similar slumps during the month of August each year. The series representing admissions for GI bleeding also had a significant seasonal component, with a sharp peak at the end of the year and smaller peaks in November and February, tapering off throughout the rest of the year before reaching the typical trough described in August. Although the decline in the hospitalisation series during the summer months corresponds with the decline also observed in the drug series, the winter peaks do not correspond with the peaks observed for the consumption of NSAIDs.
Monthly average use of NSAID, PPI, H2-antagonist and gastrointestinal bleeding admissions, and annual change percentage.
| DDD NSAID | DDD PPI | DDD H2-antagonist | GIB Admissions | |||||
| Monthly average | %Δ annual | Monthly average | %Δ annual | Monthly average | %Δ annual | Monthly average | %Δ annual | |
| 2000 | 4,940,755 | ---- | 3,022,520 | ---- | 1,127,303 | ---- | 442 | ---- |
| 2001 | 5,644,326 | 14.24 | 3,938,831 | 30.32 | 1,016,677 | -9.81 | 454 | 2.71 |
| 2002 | 5,934,383 | 5.14 | 4,930,653 | 25.18 | 937,300 | -7.81 | 452 | -0.44 |
| 2003 | 6,612,803 | 11.43 | 6,188,319 | 25.51 | 851,691 | -9.13 | 479 | 5.97 |
| 2004 | 7,318,488 | 10.67 | 7,588,315 | 22.62 | 747,087 | -12.28 | 465 | -2.92 |
| 2005 | 7,611,580 | 4.00 | 9,026,480 | 18,95 | 656,171 | -12.17 | 440 | -5.38 |
| 2005-2000 | +2,670,825 | +54.06 | +6,003,960 | +198.64 | -471,132 | -41.79 | -2 | -0.45 |
DDD: Defined Daily Dose; GIB: gastrointestinal bleeding; H2: Histamine 2 receptors; NSAID: nonsteroidal anti-inflammatory drugs; PPI: proton pump inhibitors.


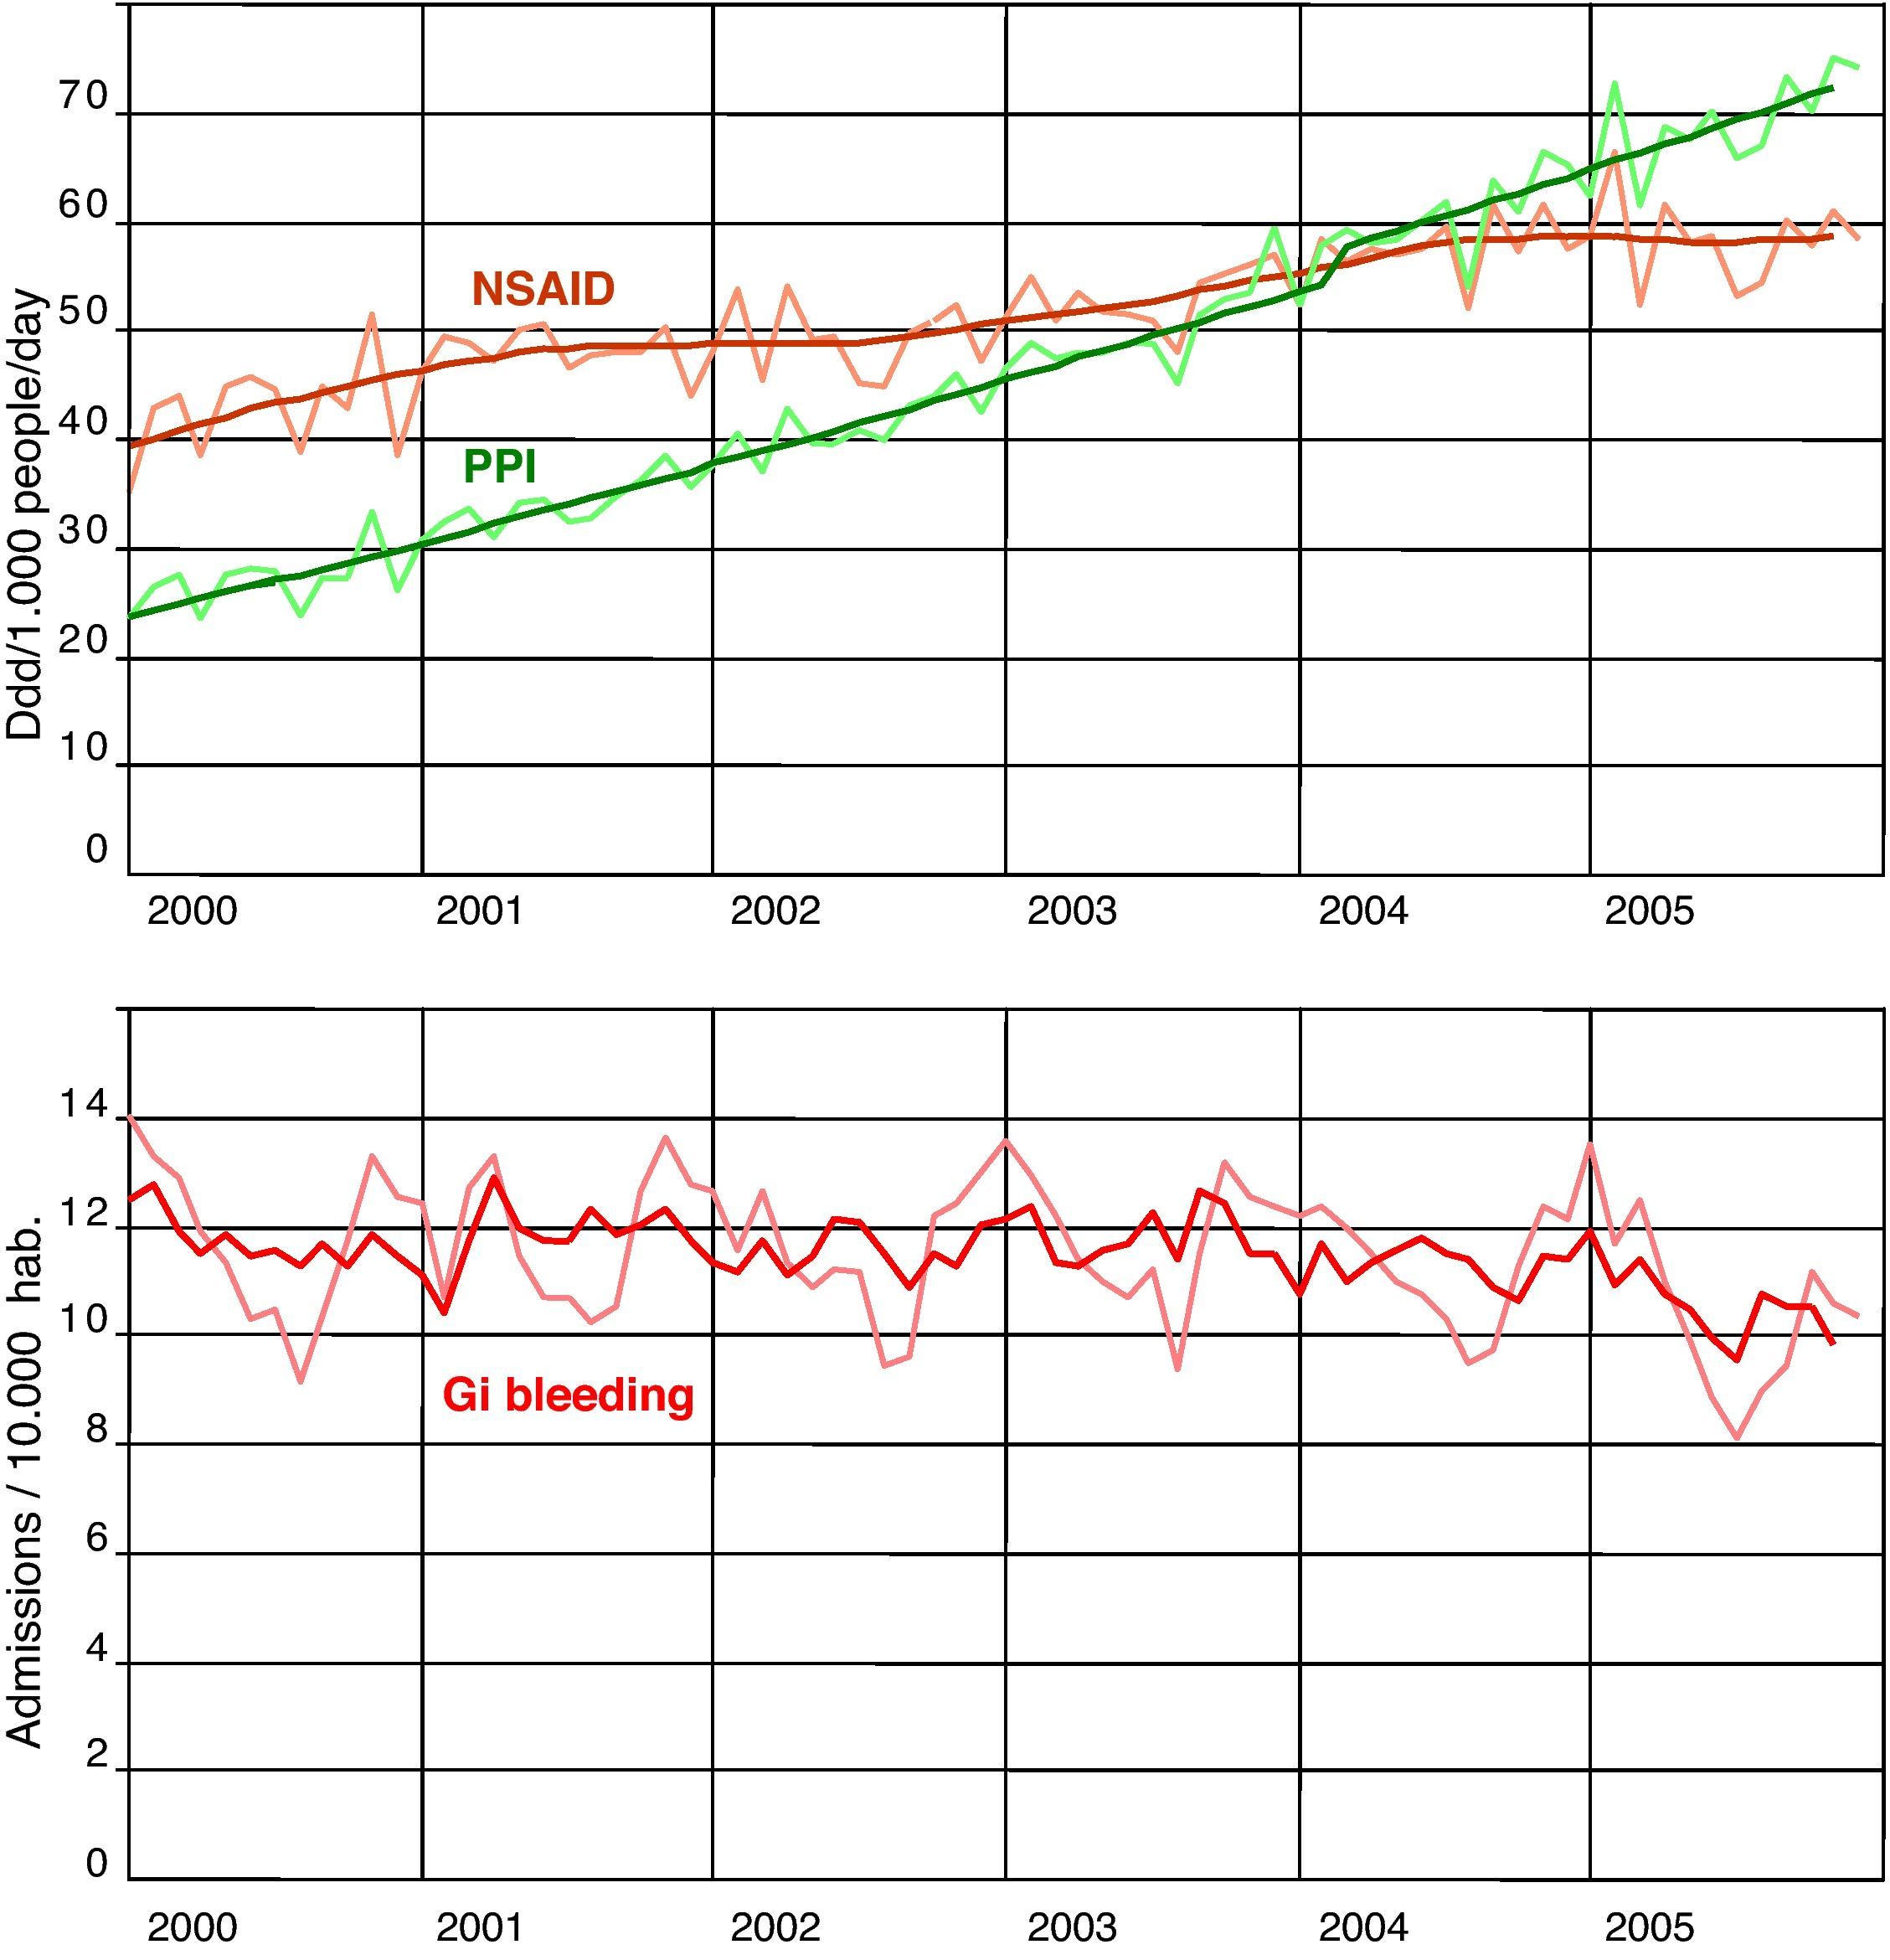
Table 2 and Figure 3 show the DDDs/1000/day of NSAIDs and PPIs, and the rate of hospital admissions for GI bleeding for the period under study. Enough NSAIDs were dispensed to treat 42.7 out of every 1000 inhabitants during the whole year; this figure grew to 58.3/1000 in 2005. During the same period, enough PPIs were dispensed to treat 26.3 out of every 1000 inhabitants for the entire year; this figure reached 68.5/1000 in 2005. The H2-antagonists dropped from 9.7 to 5.1 DDDs/1000/day. The DDDs/1000/day for NSAIDs and PPIs were significantly higher every year after 2000, while the differences in the DDDs/1000/day for the H2-antagonists were only statistically significant as of 2003. The rate of admissions for GI bleeding during the period studied oscillated between 142 and 126 admissions per 100 000 inhabitants per year. These results never reached statistical significance when compared with the year 2000.
Crude rates and Incidence Rate Ratio (Poisson Regression) of NSAID, PPI, H2-antagonists, and gastrointestinal bleeding admissions.
| DDD/1000/DAY NSAIDs | DDD/1000/DAY PPIs | DDD/1000/DAY H2-antagonists | GIB Admissions per 100 000 inhab. | ||||||||
| Crude rate | IRR | Crude rate | IRR | Crude rate | IRR | Crude rate | IRR | ||||
| 2000 | 42.70 | 1.00 | 26.29 | 1.00 | 9.69 | 1.00 | 141.29 | 1.00 | |||
| 2001 | 48.10 | 1.12 | * | 33.38 | 1.26 | * | 8.76 | 0.90 | 141.96 | 1.00 | |
| 2002 | 49.18 | 1.15 | * | 40.62 | 1.54 | * | 7.82 | 0.81 | 138.12 | 0.98 | |
| 2003 | 52.97 | 1.24 | * | 49.40 | 1.87 | * | 6.91 | 0.71 | * | 142.16 | 1.00 |
| 2004 | 57.40 | 1.34 | * | 59.32 | 2.25 | * | 5.91 | 0.61 | * | 135.14 | 0.96 |
| 2005 | 58.33 | 1.36 | * | 68.51 | 2.61 | * | 5.05 | 0.52 | * | 126.10 | 0.89 |
DDD: Defined Daily Dose; GIB: gastrointestinal bleeding; H2: Histamine 2 receptors; IRR: Incidence Rate Ratio (Poisson Regression); NSAID: nonsteroidal anti-inflammatory drugs; PPI: proton pump inhibitors.
*P<.05.

DDD consumed per 1000 people per day of NSAID and PPI, and gastrointestinal bleeding rates. Trends and adjusted time series. Region of Valencia, Spain, 2000-2006. DDD: Defined Daily Dose; GI: gastrointestinal; NSAID: nonsteroidal anti-inflammatory drugs; PPI: proton pump inhibitors.
Both PPI and NSAID trends were positive and significant. NSAID dispensation, from a constant of 41.88 DDD/1000/day, increased by 0.26 DDD/1000/day per month during the period (r2: 0.91; P<.0001). PPIs, from a constant of 20.33 DDD/1000/day, increased by 0.70 DDD/1000/day per month during the period (r2: 0.99; P<.0001). GIB admission trend showed a small but also significant decrease: from a constant of 12.11 admissions/100,000/month, it decreased by 0.02 admissions per month (r2: 0.30; P<.0001) from 2000 to 2005. NSAIDs and PPI trends showed a strong positive correlation (r: 0.95; P<.0001) and a negative but also significant correlation with the GIB trend (r: -0.47 for NSAID and r: -0.57 for PPIs; P<.0001). The multiple regression adjusted to asses the independent association between series showed that from a constant of 9.78, GIB admissions for 100 000 inhabitants increased by 0.08 per month for each unit of increase in NSAID consumption (DDD/1000/day), and decreased by 0.06 admissions/month for each unit of increase in PPI consumption (DDD/1000/day) (r2: 0.37; P<.0001).
DiscussionOur study shows that in the Region of Valencia a substantial increase in overall rates of NSAIDs from 2000 to 2005 was not accompanied by changes in the rates of hospitalisations for GI bleeding. In fact, even though a substantial increase in Valencia's population, due to an influx of immigrants over this period of time, brought the figure for admissions due to GI bleeding down by 10% between 2000 and 2005, the number of hospitalisations observed remained practically constant.
These results are compatible with those reported in other studies, although the incidence of GI bleeding seems to vary considerably from one country to another. Hence, in the United States for 1992-1999, in spite of a general decrease in hospitalisations for peptic ulcer disease, Lewis et al2 did not find a statistically significant decrease in upper GI bleeding or in any other GI bleeding. In Canada in 1996-2002, Mamdani et al10 reported a slight increase in the use of NSAIDs in British Columbia (from 8.7% to 10.9%) without an associated increase in upper GI bleeding, while in Ontario, a rise in the use of NSAIDs from 10.9% to 16.5% was accompanied by a significant increase in hospital admissions for upper GI bleeding. However, the admissions rate was still lower than in British Columbia. In Quebec, and for a very short period (1999-2001), Barnard et al11 the use of NSAIDs, particularly COXIBs, increased by 28%, and this was accompanied by a 13.3% rise in the rate of non-fatal digestive perforations or haemorrhages.
In the United Kingdom6,18,19 and Greece,20 there was a significant increase in admission rates for bleeding gastric and duodenal ulcer. Admissions for haemorrhages seem to have increased in the elderly, but to have decreased in young people.6 In Denmark, Lassen et al21 analysed the period between 1993 and 2002, and Christensen et al,22 looking at figures from 1996 to 2004, reported that the incidence of bleeding peptic ulcer was stable in spite of important increase in prescriptions for NSAID. In a Dutch study, between 1980 and the mid 1990s, Post et al3 found that the admission rate for bleeding ulcers increased among both men and women, but subsequently returned to its original level in the late 1990s. In Amsterdam, in a study that spanned the mid 1990s through 2000, Van Leerdam et al23 observed a reduction in the incidence of acute upper GI bleeding that went from 61.7 to 47.7/100 000 persons. In Spain, Pérez-Aisa24 has reported a decrease in the incidence of ulcer complications that is particularly evident in patients under the age of 65.
Studies like these, observational in nature and for the most part based on ecological analyses of aggregated data, cannot make causal inferences about the factors determining the trends in each country.25,26 They do provide, however, the grounds to develop hypotheses -for the whole population, rather than on an individual level27- about the role of the various, and sometimes opposing factors, which can potentially have an impact on the trends detected. Hence, in spite of the increased use of treatment to eradicate Helicobacter Pylori and the decrease in the prevalence of peptic disease, the improvement in the management of older individuals with cardiovascular disorders has led to an extraordinary rise in treatments with low doses of aspirin, other anti-platelet agents such as clopidogrel and oral anti-coagulants, which may lead to more GI bleeding in older individuals. Similarly, the global increase in the use of NSAIDs, the possibility to treat patients at a greater risk of bleeding thanks to the commercialisation of selective NSAIDs and the growing use of other drugs such as SSRIs are all factors that could accentuate the trend towards a rise in GI bleeding rates in developed countries. Conversely, the use of PPIs as gastro-protectors would brake this trend towards a rise in cases of GI bleeding. For the overall population in each country, and in different age groups, the balance between the risk factors and the benefits of treatment at any given time will ultimately determine the time series reflecting the incidence of GI bleeding. In Spain, with a few exceptions,28 a significant overuse of so-called gastroprotection accompanying NSAID prescription has been detected.29–32 Our study reveals that the consumption of PPIs has gone from 3 000 000 to 9 000 000 DDDs per month in only six years. This factor, jointly with the decrease in peptic disease, may have been a counterweight that has kept the incidence of GI bleeding stable in spite of notable increases in the dispensation of NSAIDs (as well as, although not studied in our project, antiplatelet and anticoagulant therapies). In any case, it should be noted that the relationship with PPI consumption and GIH admissions does not seem to be linear.
Nevertheless, the figures found for haemorrhaging, which are higher than 125 cases per 100 000 inhabitants during the best years, are in the upper range of figures for Europe recently reported in the literature. Although these figures in fact reflect a variety of situations depending on the definition of haemorrhaging used and the system behind every register,33 it would be reasonable to deduce that in Spain many digestive haemorrhages could be avoided. Intervening on NSAID prescriptions (reducing the use of NSAIDs when possible, substituting them with paracetamol or other drugs that are less damaging to the digestive system, and establishing adequate gastroprotection when necessary) seems to be the best course of action, since it is more difficult to reduce other risk factors such as the use of aspirin or anti-coagulants. Furthermore, increasing PPI prescription could have some adverse effects, such as a small increase in the incidence of hip fractures or clostridium difficile infections.
Regarding seasonal components, the higher incidence of GIH in autumn and winter compared with spring and summer is consistent with previous studies in the USA, Russia, Taiwan, Japan, Turkey, Israel, China, and Chile, but other studies in Australia, Denmark, and Poland have reported spring-summer peaks.34 In Spain, López Cepero et al found no seasonality in GIH admissions35 but in another study carried out in one hospital in Valencia, a significant seasonal pattern was found for GIH caused by duodenal ulcer, but not in subjects with previous use of NSAIDs.36 The seasonality of NSAIDs and PPIs has not been studied and their interpretation is complex because these series are obtained from the monthly invoices submitted by the pharmacy offices to the regional government and they may be affected by several factors such as the number of days in each month (i.e., the 2-3days less in February could amount to about 10% of the average monthly pharmacy sales), number of Sundays and holiday days, summer holidays, and also for commercial reasons (i.e., some pharmacies transfer claims to the next month when the actual month corresponds with the quarterly declaration of VAT in January, April, July, and October). Both drug series in our study were corrected for days of the month and Sundays in each month, but not for other holiday days. These factors may cause, at least in part, some of the seasonal behaviour described in our study, very similar for NSAIDs and PPIs, and different from the autumn-winter peak detected for admissions for GI bleeding.
In addition to the inherent limitations of an ecological design that have already been discussed, another limitation is the fact that we have not examined other drugs that are harmful to the digestive system, such as aspirin. The decision was made to omit aspirin because it is cheap and does not require a medical prescription (it is usually bought over the counter), there is no record of most of the aspirin dispensed in the monthly pharmaceutical invoices sent to the VHA, and aspirin is included in several combinations with other analgesics or drugs to relieve influenza symptoms. It should be noted that part of the NSAID and PPI consumption is also over-the-counter and therefore it is not recorded in the pharmacy invoices submitted to the VHA. Moreover, our study did not consider other factors, pharmacological or not, influencing the incidence of gastrointestinal haemorrhages. It would also have been of great interest to have analysed trends by age group and gender, since the incidence of GI bleeding may be dropping among the young and rising among the elderly. However, the monthly invoices sent to the VHA do not include information about patients. Another issue is that the Region of Valencia in Spain is an important tourist area with a considerable rise in the population during the summer months. This change is not reflected in the rates, but is shown in the number of hospital admissions and, at least for national tourists, in figures of consumption of drugs. This characteristic suggests that the fall in the incidence of GI bleeding and the consumption of NSAIDs and PPIs during the summer months is probably more pronounced than that described, since some of the cases refer to people who are not residents of Valencia, but who are there on holidays. Another factor that affects the rates is that the growth in the population corresponds to the influx of immigrants from outside the European Community, who are usually minors and young adults, with a very low risk of digestive bleeding (and, probably, with lower PPI and NSAID consumption). Because of this, year-by-year comparisons of the annual GI bleeding rate are distorted and, while differences did not reach statistical significance, standardised data would probably reveal more homogeneous rates.
Despite advances in medical care, GI bleeding remains a significant cause of morbidity, mortality and health care use, especially among the elderly. While time trends in uncomplicated peptic ulcer seem to be decreasing, evolving changes in aetiological factors, both in terms of risk and protection, tend to maintain a high incidence of GI bleeding in the Region of Valencia. This suggests that better management of the risk of bleeding as a result of NSAID consumption should be attempted.
Conflict of interestThe authors have no conflict of interest to declare.
We are grateful to two anonymous reviewers of Farmacia Hospitalaria for their constructive criticism.
Most important specifications of ARIMA models and diagnostics
| NSAID Model | PPI Model | GIH Model | |
| Information on models | |||
| Pre-adjustment | |||
| Transformation | None | None | None |
| Mean Correction | None | None | None |
| Correction for easter effect | Yes (6 days) | Yes (6 days) | None |
| –Easter effect value | -4.08 [-2.00; 2.00] 5% | -3.97 [-2.00; 2.00] 5% | --- |
| Correction for outliers | AO,LS,TC; | ||
| –Critical t-value | 3.055 | 3.053 | 3.050 |
| –Outliers | -- | 2: Dec2003, Mar2004 | -- |
| Specifications of the ARIMA model | (0 1 1)(0 1 1) | (0 1 2)(0 1 0) | (1 0 0)(0 1 1) |
| Decomposition | |||
| ARIMA Decomposition | Exact | ||
| Seasonality | Seasonal model imposed | ||
| Information on diagnosis models | |||
| SA quality index (stand. to 10) | 1.479 [0; 10] | 2.119 [0; 10] | 2.344 [0; 10] |
| Statistics on residuals | |||
| Ljung-Box on residuals | 16.47 [0; 33.90] 5% | 14.06 [0; 33.90] 5% | 34.71 [0; 33.90] 5% |
| Box-Pierce on residuals | 0.27 [0; 5.99] 5% | 0.25 [0; 5.99] 5% | 2.62 [0; 5.99] 5% |
| Ljung-Box on squared residuals | 30.43 [0; 33.90] 5% | 19.06 [0; 33.90] 5% | 17.10 [0; 33.90] 5% |
| Box-Pierce on squared residuals | 0.21 [0; 5.99] 5% | 0.16 [0; 5.99] 5% | 0.63 [0; 5.99] 5% |
| Description of residuals | |||
| Normality | 0.16 [0; 5.99] 5% | 1.02 [0; 5.99] 5% | 1.47 [0; 5.99] 5% |
| Skewness | 0.11 [-0.63; 0.63] 5% | -0.33 [-0.64; 0.64] 5% | 0.11 [-0.62; 0.62] 5% |
| Kurtosis | 3.13 [1.74; 4.26] 5% | 2.92 [1.72; 4.28] 5% | 2.27 [1.76; 4.24] 5% |
| Outliers | |||
| Percentage of outliers | 0.00% [0%; 5.0%] | 2.82% [0%; 5.0%] | 0.00% [0%; 5.0%] |

