
To assess a control protocol concerning alterations in metabolic follow-up parameters in the context of a pharmaceutical care program designed for surgical patients receiving parenteral nutrition, through determination of the impact of pharmaceutical interventions on associated metabolic complications.
MethodsProspective interventional study of two-months’ duration performed in surgical patients receiving parenteral nutrition. The study variables included predefined biochemical parameters within the metabolic-nutritional profile. Four categories were established to classify the degree to which each parameter was altered: a) no alteration (within normal range); b) alteration with no associated complication; c) moderate complication, and d) severe complication. The type of pharmaceutical intervention carried out included a direct intervention on their part or a recommendation. Statistical differences between the mean analytical values before and after the intervention were assessed by parametric and non-parametric tests (P<.05).
ResultsA total of 1055 analytical determinations corresponding to 44 patients were evaluated. Among them, 239 determinations (22.6%) presented some degree of alteration which corresponded to 162 complications. Complication is often defined whit more than one parameter. Ninety-three (57.4%) corrective interventions were carried out by direct intervention and 16 (9.9%) by recommendation. The results showed statistically significant differences or significant trend when the purpose of the pharmaceutical direct intervention was to increase albumin, prealbumin, potassium or phosphate levels or to decrease C-reactive protein, glucose or triglycerides. Significant differences or significant trend were not seen when no intervention was performed.
ConclusionDespite the fact that the parameters assessed may have been influenced by factors other than the parenteral nutrition treatment received, our findings show that systematic monitoring of specific analytic parameters can be effective for attaining success in nutritional therapy, in terms of improvement in nutritional status and prevention and control of associated complications.
Evaluar un protocolo de control de las alteraciones de los parámetros metabólicos en el contexto de un programa de atención farmacéutica dirigido a pacientes quirúrgicos con nutrición parenteral, a través del impacto de las intervenciones farmacéuticas en las complicaciones metabólicas asociadas.
MetodoEstudio prospectivo de intervención de 2 meses de duración. Se estudia a pacientes quirúrgicos con nutrición parenteral. Como variables de estudio se incluyen los parámetros bioquímicos predefinidos en el perfil metabólico-nutricional. Se establecen 4 categorías para clasificar el grado de alteración de cada parámetro: a) sin complicación; b) alteración no asociada con complicación; c) complicación moderada, y d) complicación grave. El tipo de intervención del farmacéutico se realiza mediante intervención directa o consejo. Las diferencias estadísticamente significativas entre los valores medios de los valores de los parámetros analíticos previos y posteriors a la intervención farmacéutica se establecen con pruebas paramétricas y no paramétrica (p<0,05).
ResultadosSe evaluaron 1055 parámetros correspondientes a 44 pacientes. En total, 239 (22,6%) presentaron alteración, lo que correspondió a 162 complicaciones (para definir algunas complicaciones se utiliza más de un parámetro), de las cuales 93 (57,4%) se intentaron corregir mediante intervención directa y 16 (9,9%), mediante consejo. Los resultados mostraron diferencias estadísticamente significativas o una tendencia hacia la significación cuando el objetivo de la intervención directa fue incrementar la albúmina, la prealbúmina, el potasio y el fosfato, y disminuir la PCR, la glucosa y los triglicéridos. Cuando no se realizó ninguna intervención no se encontraron diferencias significativas o con tendencia hacia la significación.
ConclusionesA pesar de que los parámetros evaluados pueden estar influidos por otros factores ajenos al tratamiento con nutrición parenteral, los resultados de este estudio indican que el seguimiento sistemático de éstos puede ser un método eficaz para conseguir el éxito de la terapia nutricional, tanto en la mejora del estado nutricional como en la prevención y el control de las complicaciones asociadas.
Therapy with parenteral nutrition (PN) can be complex because of the characteristics and amount of nutrients administered, and the type of patients that are candidates for this treatment. With the progressive advances in enteral nutrition, the use of PN has become restricted to severely ill patients, generally with acute processes. These patients can present problems in assimilating nutrients and are often in a hypercatabolic state with intense proteolysis, hydroelectrolytic imbalance and organ dysfunction that compromises normal metabolic function; hence, nutritional management of these patients is difficult1.
The preparation of PN is handled by the hospital Pharmacy Department because of the requirements of sterility and the complexity of the formulations. Over the years and coinciding with advances in Clinical Pharmacy, the hospital pharmacist has become increasingly more implicated in the development of guidelines and protocols, as well as other health care activities in the field of nutrition2,3.
Automation of the formulation processes and systems for dispensing treatment, as well as data integration into computer networks (e.g., clinical and analytical reports, pharmacological treatment administered) facilitate continuous information exchange and enhance the development of evidence- and efficiency-based clinical interventions in this area: that is, pharmaceutical care4,5.
In practice, pharmaceutical care implies the establishment of protocols, work flow-charts, and methods for recording the interventions applied, in order to assess the activity in terms of health benefits, reduce variation in the patients' clinical response, and generate information that will promote continuing improvement in the care provided.
The Parenteral Nutrition Unit of our Pharmacy Department (PNU) have a set of action procedures and protocols, such as nutritional assessment of PN candidates, caloric requirement analyses, the registry, follow-up and prevention of catheter-related complications, the surveillance of the nutritional treatment adherence and the registry of events derived from PN administration.
In total PN nutritional support multidisciplinary teams must provide a high quality nutritional assistance based on evidence and daily follow-up of patients with total PN6. In a general context, the PNU is part of a multidisciplinary team which includes endocrines, nutritionists, ICU attendings and surgeons. The PNU actively participates in nutritional design (protocols and guides), nutritional assessment (with its own programme), formulae selection, monitoring and follow-up. In surgical services, the surgeon prescribes the initial PN. From the PNU, the indication of the parenteral support is evaluated and according to nutritional assessment the initially composition is discussed and adjusted during therapy according to clinical and metabolic data. The Endocrinology and Dietetic Services, in charge of the Nutritional Unit, are responsible for the transition to oral or enteral diet and the nutritional follow-up of patients with long evolution artificial nutrition.
In this study we present a control protocol concerning alterations in metabolic follow-up parameters in the context of a pharmaceutical care program for surgical patients receiving PN, developed in the Parenteral Nutrition Unit of the Pharmacy Department with the aim of standardizing, systematizing, and documenting interventional pharmaceutical activity in the hospital setting for patients at a certain level of complexity. The pharmaceutical care program is assessed by determining the impact pharmaceutical interventions have on the patients' metabolic complications.
METHODThis is a prospective, interventional study of two months' duration. Hospitalized patients receiving PN in the General Surgery and Gastrointestinal Surgery Units during the months of October and November 2005 were included. Patients referred from intensive care units and patients with incomplete records were excluded.
The PN protocol of our unit standardizes the nutritional formulas prescribed depending on the patient's anthropometric characteristics, degree of hypercatabolism and clinical status. Based on the underlying diagnosis, indication, and the patient's clinical condition, the physician prescribes the most appropriate formula to start nutritional support, according to the hospital protocol. This protocol does not establish the amino acid and lipid patterns or set exact amounts of nutrients; instead, it establishes ranges. Once nutritional therapy is started, clinical and metabolic follow-up of the patient is performed up to completion of treatment. For this purpose, the Parenteral Nutrition Unit requests weekly determination of the patient's analytical and nutritional profile, and, if is deemed necessary, the pharmacist assesses, adjusts and modifies the composition of the PN formula according to the patient's metabolic status.
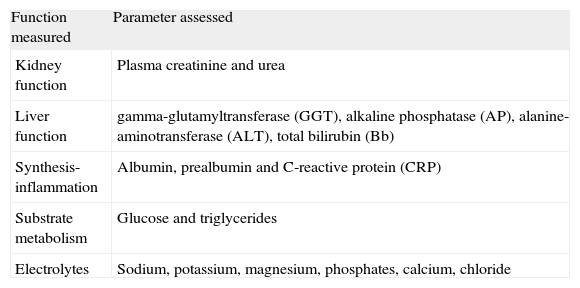
Several parameters that are predefined in the general protocol are recorded in the weekly monitoring of metabolic profile (table 1). Four categories were defined to classify the degree of alteration of each parameter: a) no alteration: The value falls within the normal analytical range; b) alteration: the value is outside the normal range, but is considered to have no clinical relevance within the context of the patient's condition; c) moderate complication: the value lies outside the normal range with potential clinical consequences, considered to be moderate in nature, and d) severe complication: the value for the parameter is outside the normal range, with potential clinical consequences considered to be severe in nature.
Analytic parameters evaluated
| Function measured | Parameter assessed |
| Kidney function | Plasma creatinine and urea |
| Liver function | gamma-glutamyltransferase (GGT), alkaline phosphatase (AP), alanine-aminotransferase (ALT), total bilirubin (Bb) |
| Synthesis-inflammation | Albumin, prealbumin and C-reactive protein (CRP) |
| Substrate metabolism | Glucose and triglycerides |
| Electrolytes | Sodium, potassium, magnesium, phosphates, calcium, chloride |
The type of intervention pharmacists initiated was a direct intervention on their part, or a recommendation. In cases in which the pharmacist acted directly, formula is modified according to the decision algorithm and analytic values. Recommendations to prescribing physicians were carried out in a therapeutic monitoring context already implemented in our service, which includes electronic recordings (unitary doses programme) of the recommendations, its acceptance and impact.
For the analysis of the results, the analytical parameters have been grouped into 5 categories: electrolytes, liver function markers, kidney function markers, substrate metabolism, and synthesis-inflammation (table 1).
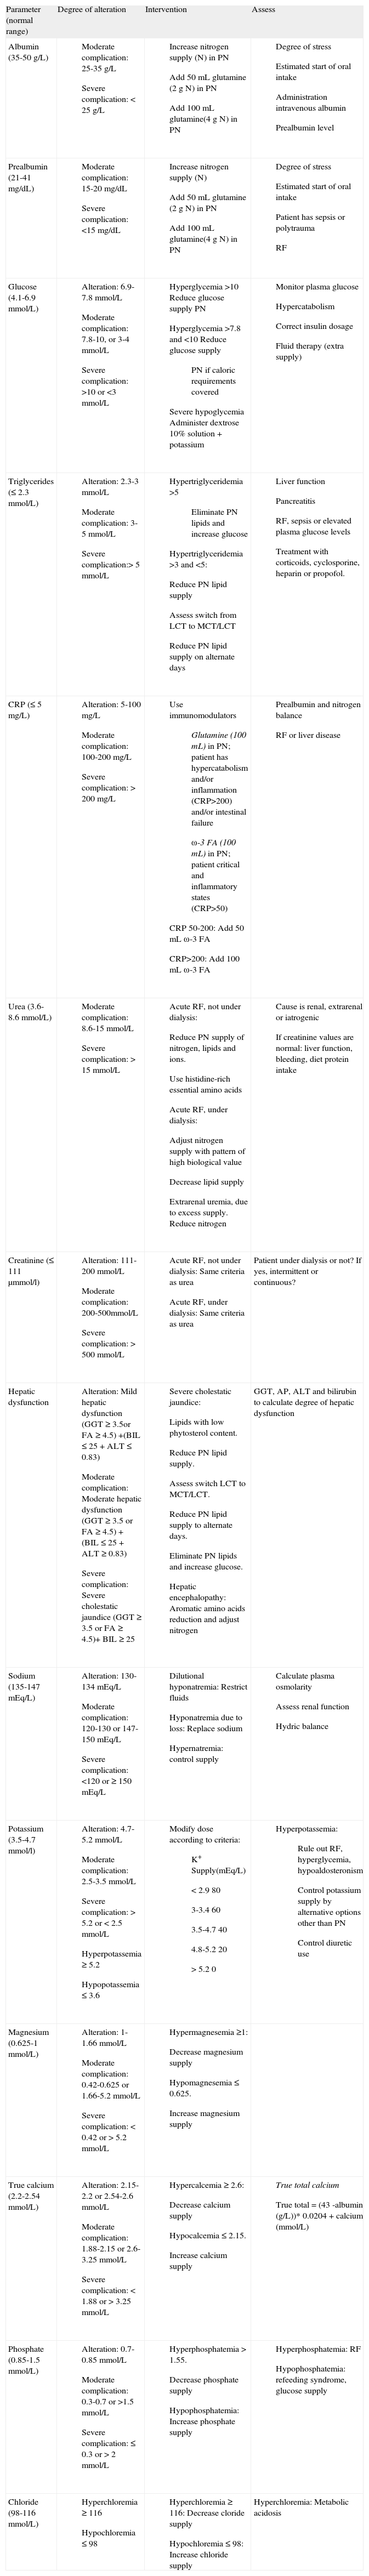
To standardize the pharmaceutical care provided for a metabolic alteration, a protocol or decision algorithm was designed based on clinical evidence and clinical practice guidelines (table 2). This protocol is an essential tool to assure that the activity is reproducible and to optimize the efficiency of the process.
Protocol for interventions in metabolic follow-up
| Parameter (normal range) | Degree of alteration | Intervention | Assess |
| Albumin (35-50 g/L) |
|
|
|
| Prealbumin (21-41 mg/dL) |
|
|
|
| Glucose (4.1-6.9 mmol/L) |
|
|
|
| Triglycerides (≤ 2.3 mmol/L) |
|
|
|
| CRP (≤ 5 mg/L) |
|
|
|
| Urea (3.6-8.6 mmol/L) |
|
|
|
| Creatinine (≤ 111 µmmol/l) |
|
| Patient under dialysis or not? If yes, intermittent or continuous? |
| Hepatic dysfunction |
|
| GGT, AP, ALT and bilirubin to calculate degree of hepatic dysfunction |
| Sodium (135-147 mEq/L) |
|
|
|
| Potassium (3.5-4.7 mmol/l) |
|
|
|
| Magnesium (0.625-1 mmol/L) |
|
| |
| True calcium (2.2-2.54 mmol/L) |
|
|
|
| Phosphate (0.85-1.5 mmol/L) |
|
|
|
| Chloride (98-116 mmol/L) |
|
| Hyperchloremia: Metabolic acidosis |
ALT: Alanine aminotransferase, AP: Alkaline phosphatase, CRP: C-reactive protein, GGT: Gamma glutamyltransferase, LCT: Long-chain triglycerides, MCT: Medium-chain triglycerides, PN: Parenteral nutrition, RF: Renal failure, ra-3 FA: omega-3 fatty acids.
To assess the impact of pharmaceutical interventions on metabolic complications, differences in the mean analytical values before and after the intervention were analyzed using a parametric test (/-test) and a non-parametric test (Wilcoxon /-test). The statistical analysis was done with SPSS, version 13.0, and significance was set at a P-value of <0.05.
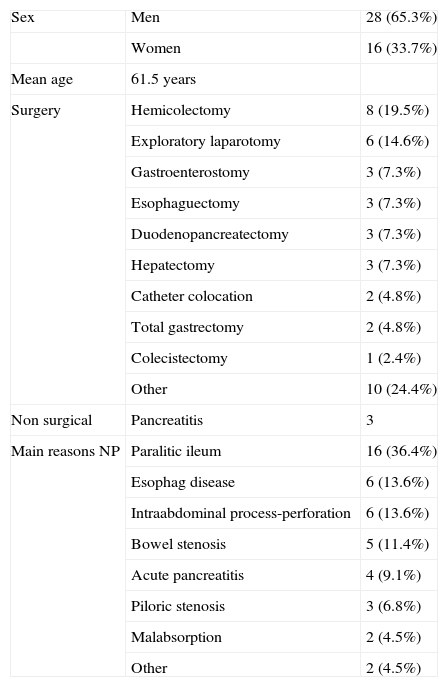
RESULTSThe study included 44 patients. Demographic characteristics are described in table 3. A total of 2011 analytical values were recorded for the parameters studied. Among them, 1055 were matched results from before and after the pharmaceutical intervention and these were selected for evaluation.
Demographic characteristics
| Sex | Men | 28 (65.3%) |
| Women | 16 (33.7%) | |
| Mean age | 61.5 years | |
| Surgery | Hemicolectomy | 8 (19.5%) |
| Exploratory laparotomy | 6 (14.6%) | |
| Gastroenterostomy | 3 (7.3%) | |
| Esophaguectomy | 3 (7.3%) | |
| Duodenopancreatectomy | 3 (7.3%) | |
| Hepatectomy | 3 (7.3%) | |
| Catheter colocation | 2 (4.8%) | |
| Total gastrectomy | 2 (4.8%) | |
| Colecistectomy | 1 (2.4%) | |
| Other | 10 (24.4%) | |
| Non surgical | Pancreatitis | 3 |
| Main reasons NP | Paralitic ileum | 16 (36.4%) |
| Esophag disease | 6 (13.6%) | |
| Intraabdominal process-perforation | 6 (13.6%) | |
| Bowel stenosis | 5 (11.4%) | |
| Acute pancreatitis | 4 (9.1%) | |
| Piloric stenosis | 3 (6.8%) | |
| Malabsorption | 2 (4.5%) | |
| Other | 2 (4.5%) |
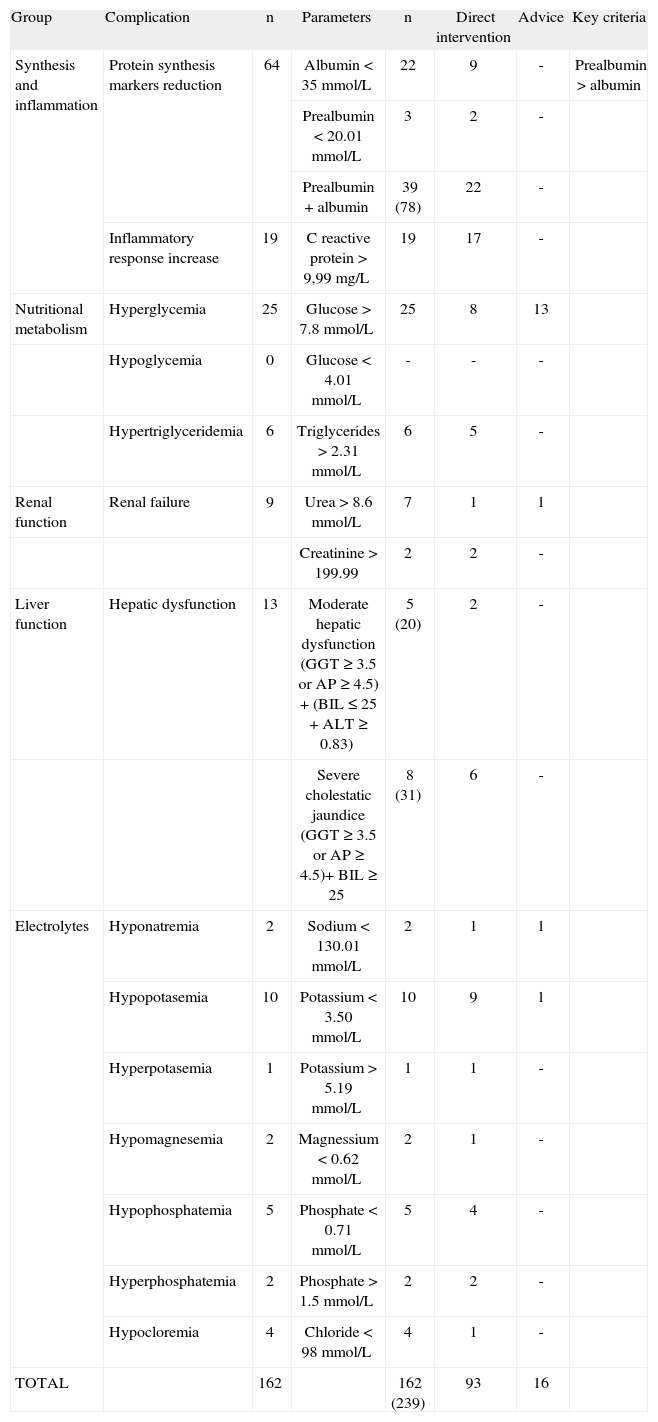
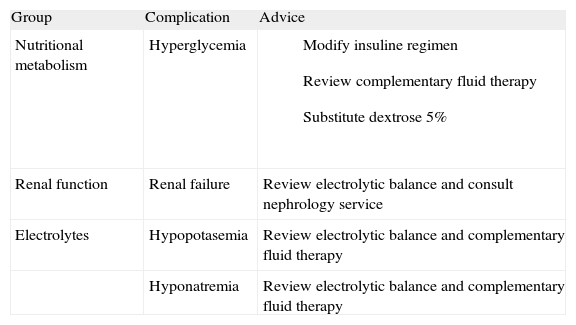
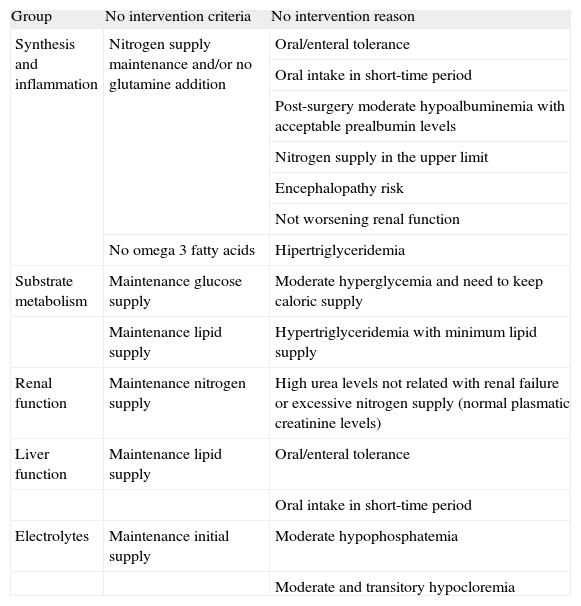
The determinations considered for the analysis were classified according to the complication and the type of corrective pharmaceutical intervention carried out (table 4). Among the parameters studied, 239 (22.6%) presented some degree of alteration, which represented 162 complications in 40 patients, some complications are defined with more than one altered parameter. Following evaluation of the analytical results, estimation of when oral intake would start and assessment of the patient's clinical status, the pharmacist carried out 93 direct interventions (57.4%of complicacions) involving 30 patients and 16 (9.9% of complicacions) interventions by recommendation involving 14 patients. Interventions consisting of recommendations to the prescribing physician are described in table 5. In contrast to what would be expected in light of the patients' analytic results and energetic, caloric and protein needs, it was decided not to conduct intervention in 53 cases defined as complications. The pharmacist based this decision on short- or long-term estimation of when oral or enteral ingestion would start and to reduce risk in patients with hyperglycemia, hypertriglyceridemia, considerable hepatic alterations or renal dysfunction (table 6).
Complications in analytic parameters and type of interventions (PI)
| Group | Complication | n | Parameters | n | Direct intervention | Advice | Key criteria |
| Synthesis and inflammation | Protein synthesis markers reduction | 64 | Albumin < 35 mmol/L | 22 | 9 | - | Prealbumin > albumin |
| Prealbumin < 20.01 mmol/L | 3 | 2 | - | ||||
| Prealbumin + albumin | 39 (78) | 22 | - | ||||
| Inflammatory response increase | 19 | C reactive protein > 9,99 mg/L | 19 | 17 | - | ||
| Nutritional metabolism | Hyperglycemia | 25 | Glucose > 7.8 mmol/L | 25 | 8 | 13 | |
| Hypoglycemia | 0 | Glucose < 4.01 mmol/L | - | - | - | ||
| Hypertriglyceridemia | 6 | Triglycerides > 2.31 mmol/L | 6 | 5 | - | ||
| Renal function | Renal failure | 9 | Urea > 8.6 mmol/L | 7 | 1 | 1 | |
| Creatinine > 199.99 | 2 | 2 | - | ||||
| Liver function | Hepatic dysfunction | 13 | Moderate hepatic dysfunction (GGT ≥ 3.5 or AP ≥ 4.5) + (BIL ≤ 25 + ALT ≥ 0.83) | 5 (20) | 2 | - | |
| Severe cholestatic jaundice (GGT ≥ 3.5 or AP ≥ 4.5)+ BIL ≥ 25 | 8 (31) | 6 | - | ||||
| Electrolytes | Hyponatremia | 2 | Sodium < 130.01 mmol/L | 2 | 1 | 1 | |
| Hypopotasemia | 10 | Potassium < 3.50 mmol/L | 10 | 9 | 1 | ||
| Hyperpotasemia | 1 | Potassium > 5.19 mmol/L | 1 | 1 | - | ||
| Hypomagnesemia | 2 | Magnessium < 0.62 mmol/L | 2 | 1 | - | ||
| Hypophosphatemia | 5 | Phosphate < 0.71 mmol/L | 5 | 4 | - | ||
| Hyperphosphatemia | 2 | Phosphate > 1.5 mmol/L | 2 | 2 | - | ||
| Hypocloremia | 4 | Chloride < 98 mmol/L | 4 | 1 | - | ||
| TOTAL | 162 | 162 (239) | 93 | 16 |
Therapeutic recommendations given to prescribing physicians
| Group | Complication | Advice |
| Nutritional metabolism | Hyperglycemia |
|
| Renal function | Renal failure | Review electrolytic balance and consult nephrology service |
| Electrolytes | Hypopotasemia | Review electrolytic balance and complementary fluid therapy |
| Hyponatremia | Review electrolytic balance and complementary fluid therapy |
Criteria and reasons for non-intervention in patients with metabolic complications
| Group | No intervention criteria | No intervention reason |
| Synthesis and inflammation | Nitrogen supply maintenance and/or no glutamine addition | Oral/enteral tolerance |
| Oral intake in short-time period | ||
| Post-surgery moderate hypoalbuminemia with acceptable prealbumin levels | ||
| Nitrogen supply in the upper limit | ||
| Encephalopathy risk | ||
| Not worsening renal function | ||
| No omega 3 fatty acids | Hipertriglyceridemia | |
| Substrate metabolism | Maintenance glucose supply | Moderate hyperglycemia and need to keep caloric supply |
| Maintenance lipid supply | Hypertriglyceridemia with minimum lipid supply | |
| Renal function | Maintenance nitrogen supply | High urea levels not related with renal failure or excessive nitrogen supply (normal plasmatic creatinine levels) |
| Liver function | Maintenance lipid supply | Oral/enteral tolerance |
| Oral intake in short-time period | ||
| Electrolytes | Maintenance initial supply | Moderate hypophosphatemia |
| Moderate and transitory hypocloremia |
Among the various parameters studied, those encompassed in the group of synthesis-inflammation (albumin, prealbumin, and C-reactive protein [CRP]) presented the largest number of alterations and were more often associated with, complications (n= 83, 51.2 %). The renal function parameters showed relatively few complications (n= 9, 5.5 %) (table 4).
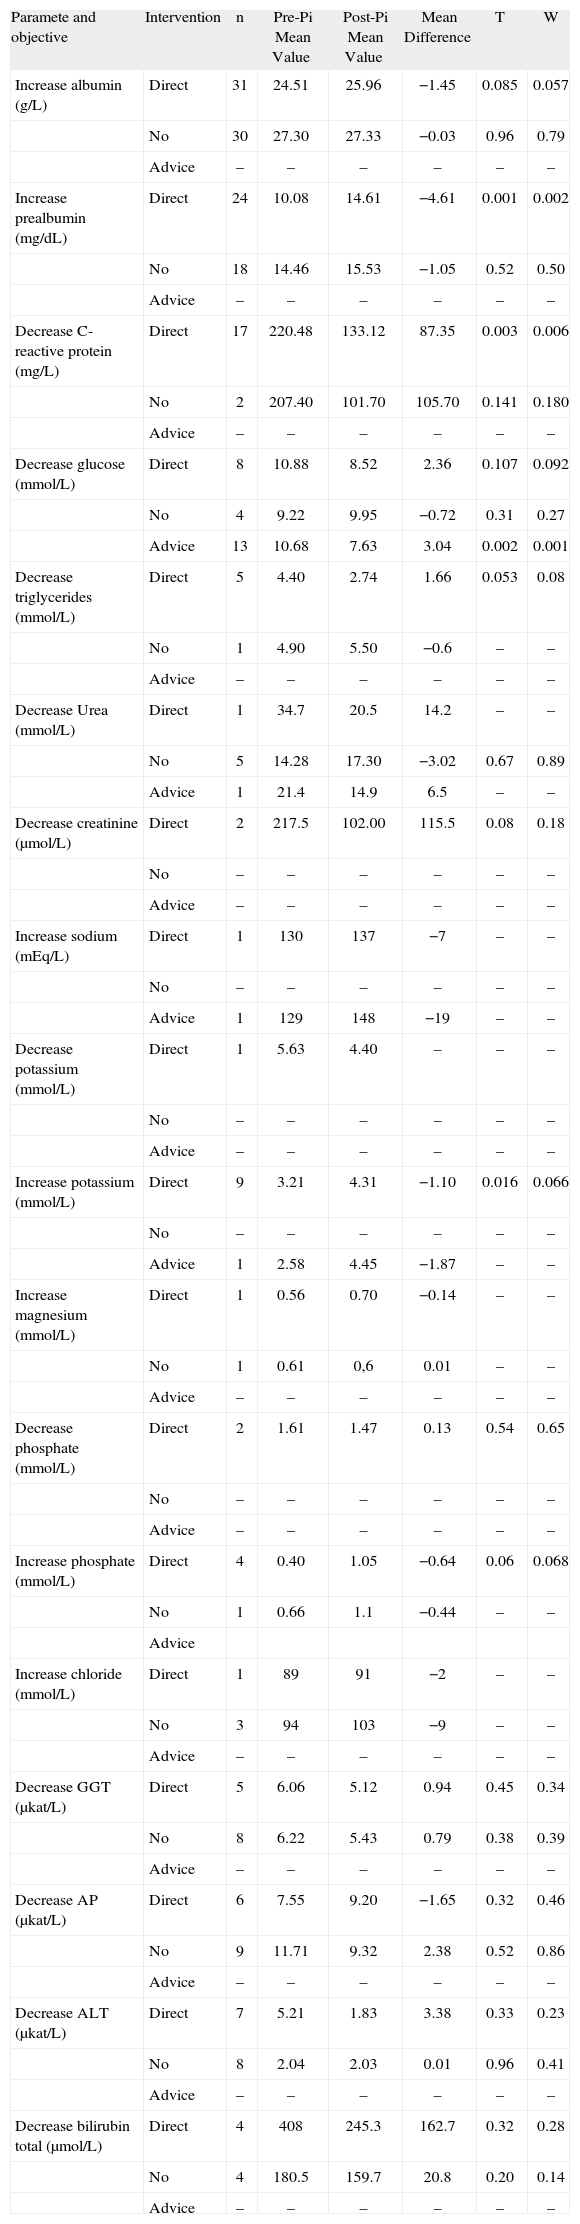
Following the pharmaceutical interventions, the mean difference was calculated between the pre- and post-intervention mean values (table 7). Statistically significant differences or trend to signification were found for interventions aimed toward increasing albumin, prealbumin, potassium and phosphate levels, and for decreasing CRP, glucose and triglycerides. For some of the objectives contemplated, such as decreasing creatinine, potassium and phosphate, or increasing sodium and magnesium, the alterations in these parameters were small and the sample studied was insufficient to reflect statistical differences. The objective of decreasing liver function parameters (GGT, AP, ALT and bilirubin) was achieved, but did not show statistically significant differences.
Comparison between analytic values before and after pharmaceutical intervention (PI)
| Paramete and objective | Intervention | n | Pre-Pi Mean Value | Post-Pi Mean Value | Mean Difference | T | W |
| Increase albumin (g/L) | Direct | 31 | 24.51 | 25.96 | −1.45 | 0.085 | 0.057 |
| No | 30 | 27.30 | 27.33 | −0.03 | 0.96 | 0.79 | |
| Advice | – | – | – | – | – | – | |
| Increase prealbumin (mg/dL) | Direct | 24 | 10.08 | 14.61 | −4.61 | 0.001 | 0.002 |
| No | 18 | 14.46 | 15.53 | −1.05 | 0.52 | 0.50 | |
| Advice | – | – | – | – | – | – | |
| Decrease C-reactive protein (mg/L) | Direct | 17 | 220.48 | 133.12 | 87.35 | 0.003 | 0.006 |
| No | 2 | 207.40 | 101.70 | 105.70 | 0.141 | 0.180 | |
| Advice | – | – | – | – | – | – | |
| Decrease glucose (mmol/L) | Direct | 8 | 10.88 | 8.52 | 2.36 | 0.107 | 0.092 |
| No | 4 | 9.22 | 9.95 | −0.72 | 0.31 | 0.27 | |
| Advice | 13 | 10.68 | 7.63 | 3.04 | 0.002 | 0.001 | |
| Decrease triglycerides (mmol/L) | Direct | 5 | 4.40 | 2.74 | 1.66 | 0.053 | 0.08 |
| No | 1 | 4.90 | 5.50 | −0.6 | – | – | |
| Advice | – | – | – | – | – | – | |
| Decrease Urea (mmol/L) | Direct | 1 | 34.7 | 20.5 | 14.2 | – | – |
| No | 5 | 14.28 | 17.30 | −3.02 | 0.67 | 0.89 | |
| Advice | 1 | 21.4 | 14.9 | 6.5 | – | – | |
| Decrease creatinine (µmol/L) | Direct | 2 | 217.5 | 102.00 | 115.5 | 0.08 | 0.18 |
| No | – | – | – | – | – | – | |
| Advice | – | – | – | – | – | – | |
| Increase sodium (mEq/L) | Direct | 1 | 130 | 137 | −7 | – | – |
| No | – | – | – | – | – | – | |
| Advice | 1 | 129 | 148 | −19 | – | – | |
| Decrease potassium (mmol/L) | Direct | 1 | 5.63 | 4.40 | – | – | – |
| No | – | – | – | – | – | – | |
| Advice | – | – | – | – | – | – | |
| Increase potassium (mmol/L) | Direct | 9 | 3.21 | 4.31 | −1.10 | 0.016 | 0.066 |
| No | – | – | – | – | – | – | |
| Advice | 1 | 2.58 | 4.45 | −1.87 | – | – | |
| Increase magnesium (mmol/L) | Direct | 1 | 0.56 | 0.70 | −0.14 | – | – |
| No | 1 | 0.61 | 0,6 | 0.01 | – | – | |
| Advice | – | – | – | – | – | – | |
| Decrease phosphate (mmol/L) | Direct | 2 | 1.61 | 1.47 | 0.13 | 0.54 | 0.65 |
| No | – | – | – | – | – | – | |
| Advice | – | – | – | – | – | – | |
| Increase phosphate (mmol/L) | Direct | 4 | 0.40 | 1.05 | −0.64 | 0.06 | 0.068 |
| No | 1 | 0.66 | 1.1 | −0.44 | – | – | |
| Advice | |||||||
| Increase chloride (mmol/L) | Direct | 1 | 89 | 91 | −2 | – | – |
| No | 3 | 94 | 103 | −9 | – | – | |
| Advice | – | – | – | – | – | – | |
| Decrease GGT (µkat/L) | Direct | 5 | 6.06 | 5.12 | 0.94 | 0.45 | 0.34 |
| No | 8 | 6.22 | 5.43 | 0.79 | 0.38 | 0.39 | |
| Advice | – | – | – | – | – | – | |
| Decrease AP (µkat/L) | Direct | 6 | 7.55 | 9.20 | −1.65 | 0.32 | 0.46 |
| No | 9 | 11.71 | 9.32 | 2.38 | 0.52 | 0.86 | |
| Advice | – | – | – | – | – | – | |
| Decrease ALT (µkat/L) | Direct | 7 | 5.21 | 1.83 | 3.38 | 0.33 | 0.23 |
| No | 8 | 2.04 | 2.03 | 0.01 | 0.96 | 0.41 | |
| Advice | – | – | – | – | – | – | |
| Decrease bilirubin total (µmol/L) | Direct | 4 | 408 | 245.3 | 162.7 | 0.32 | 0.28 |
| No | 4 | 180.5 | 159.7 | 20.8 | 0.20 | 0.14 | |
| Advice | – | – | – | – | – | – |
PI: pharmaceutical intervention; t: t-test, w: Wilcoxon t-test
In a general context, the PNU activities take part in a model of Pharmaceutical Care from our Pharmacy Service, this implies to assume responsibilities in the assistance team and in pharmacotherapy design, including monitoring and evaluation.
The protocol presented here allows for a series of interventions that, among others (clinical, hight quality…) can be included in the patient's final results assessment.
Numerous studies have assessed the importance of protocolled nutrition for the prevention and treatment of various diseases1,3,7-16. Although some of these publications defend the idea that the pharmacist's contribution in the prescription process achieves more successful PN therapy4,5, there are few descriptions of pharmaceutical care in parenteral nutrition based on adjusting the composition of PN formulas according to the clinical status of individual patients at each point of their clinical process. Anoz Jiménez et al17 identificated medication errors and/or drug-related problems associated with both total parenteral nutrition and other pharmacological treatments.
It is clear that the response obtained in the present study has a multifactorial aspect; nevertheless the results show that protocolled pharmaceutical interventions have an impact on the clinical and metabolic outcome of patients receiving PN. These interventions mainly consisted of changes in the PN formula and additional support measures.
Increases in plasma albumin and prealbumin concentrations are related to improvements in nutritional status, by indicating an increase in protein synthesis or a decrease in proteolysis. In the present study the results for albumin did not show significant changes following the pharmaceutical intervention, a fact possibly attributable to problems of postoperative hemodilution or the elevated half-life of this protein. In contrast, the results for pre-albumin indicate that it is more suitable than albumin as an early indicator of improved protein synthesis, both for assessing the clinical evolution of the patient and for evaluating the impact of the nutrients provided.
Prealbumin levels are reduced in malnourished patients and are used as markers of acute malnutrition, mainly due to its short half-life18. For many years prealbumin has been used as an indicator to evaluate the impact of the nutrients administered, as reduced prealbumin levels can be reversed with refeeding19.
In spite of this, authors like López Hellín et al20 have questioned pre-albumin's role, and they have proposed to substitute it for other indicators with a minor artifactation, such as insulin-like growth factor-1, in order to assess the nutritional supply during the stress phase after surgery.
With the development of the pharmaceutical-nutrient concept, prealbumin has been also considered a response marker in immunologic-nutrition treatments (e.g., glutamine, omega 3). Experimental studies have found a direct relationship between the adding of immunologic nutrients and prealbumin levels. This association has also proven to be significant in several studies13,20-26.
To attain an increase in prealbumin values, the nitrogen supply was increased. In the cases associated with post-stress hypercatabolism, this was accomplished with glutamine dipeptides. Glutamine favors faster enterocyte recovery and recuperation of immunocompetence7-11,27.
Decreases in CRP concentration were used as a marker of improvement in the inflammatory state associated with post-stress aggression. When substantially elevated CRP values were noted, the interventional protocol established that omega-3 fatty acids should be added to the PN formula. There is now a sufficiently solid theoretical basis indicating the important immunomodulating and anti-inflammatory activity of omega 3 fatty acids12-14
Omega 3 fatty acids addition was made keeping w3/w6 ratios between 1:2 to 1:3. Lipid emulsions with omega-3 to omega-6 ratio of 1:2 exert the highest LTC5/LTC 4 (leukotriene) ratio and a better immune modulating effect28.
Adequate control of glucose and triglycerides is essential in nutritional therapy, since elevated levels of these parameters indicate inefficient metabolism and are associated with the development of clinical complications. The interventions to decrease hyperglycemia included reducing glucose content in the PN formula, adjusting fluid therapy, and providing recommendations for modifying insulin dosing. All recommendations were accepted.
To decrease hypertriglyceridemia, lipid content in the PN was decreased and lipid emulsions with faster and more effective plasma clearance were used, such as medium-chain triglyceride emulsions29,30
One important limitation in PN therapy is the development of hepatic complications associated with the lack of oral intake and factors related to toxicity or deficiencies31-35. Therefore, the protocol required routine monitoring of various parameters related to liver function and established several interventions to prevent or minimize hepatic alterations. These include limiting potential glucose overload and particularly, decreasing the lipid content, while assuring an adequate caloric supply at all times. The results obtained with protocolled interventions for this purpose in the present study did not show a significant decrease in analytical liver function alterations. Nevertheless, these parameters did not worsen, and given their tendency to increase over the duration of PN, this can be considered a positive achievement for the patient's clinical evolution.
The study did not include patients in intensive care units, since this population presents a high incidence of multiorgan failure. Renal failure is of particular concern because of the problems involved in nutritional management of this condition. Exclusion of these patients explains the relatively low level of alterations in hydroelectrolytes and parameters associated with renal failure. There were, however, statistically significant post-intervention increases in potassium and phosphate values in patients with abnormally low results for these parameters. The PN formulas were adjusted to the patients' hydoelectrolyte status when the analytic and therapeutic situation required an intervention, in keeping with standard practice36. The specific action of the pharmacist established for these cases consisted of increasing the amount of potassium and phosphate in the PN formula.
In conclusion, with regard to clinical and metabolic status, candidates for PN are complex and difficult to treat with standardize nutritional interventions derived from simple criteria. Nevertheless, the findings of this study indicate that systematic monitoring of specific analytic parameters can be an effective means for attaining success in nutritional therapy, in terms of improvements in nutritional status and prevention and control of associated complications. Therefore, even though the parameters assessed may be influenced by several factors other than the PN treatment received, the results obtained in this study provide further evidence of the importance of protocolled, quantified pharmaceutical interventions in surgery patients.
El trabajo ha sido comunicado previamente en el 35th European Symposium on Clinical Pharmacy (Viena Octubre 2006) en formato poster.

