
The COVID-19 pandemic caused by the SARS-CoV-2 virus greatly affected healthcare workers and healthcare systems. It also challenged schools and universities worldwide negatively affecting in-person education. We conducted this study is to assess the evolution of SARs-CoV-2 virulence over the course of the pandemic.
MethodsA combined cohort of University students in Spain and HCWs from the two hospitals in Spain, and one healthcare system in the Greater Boston area was followed prospectively from March 8th, 2020, to January 31st, 2022 for diagnosis with COVID-19 by PCR testing and related sequelae. Follow-up time was divided into four periods according to distinct waves of infection during the pandemic. Severity of COVID-19 was measured by case-hospitalization rate. Descriptive statistics and multivariable-adjusted statistics using the Poisson mixed-effects regression model were applied. As a sensitivity analysis, information on SARS-CoV-2 RNA in wastewater and COVID-19 deaths through May 30, 2023 from the Boston area was collected.
ResultsFor the last two periods of the study (January 1st to December 15th, 2021 and December 16th, 2021 to January 31st, 2022) and relative to the first period (March 8th to May 31st, 2020), the incidence rate ratios (IRRs) of hospitalization were 0.08 (95% CI, 0.03–0.17) and 0.03 (95% CI, 0.01–0.15), respectively. In addition, a relative risk 0.012 CI95% (0.012–0.012) was observed when comparing COVID-19 mortality versus SARS-CoV-2 RNA copies/mL in Boston-area wastewater over the period (16th December 2021 to 30th May 2023) and relative to the first period.
ConclusionsThe severity of COVID-19 and immunity of our populations evolved over time, resulting in a decrease in case severity. We found the case-hospitalization rate decreased more than 90% in our cohort despite an increase in incidence.
La pandemia de COVID-19 impactó profundamente en trabajadores y sistemas de salud, y afectó negativamente a la educación presencial a nivel global. Nuestro estudio tuvo como objetivo evaluar la evolución de la virulencia del SARS-CoV-2 durante la pandemia.
MétodosSeguimos prospectivamente a una cohorte combinada de estudiantes universitarios en España y trabajadores de la salud de 2 hospitales en España y un sistema sanitario en Greater Boston, desde el 8 de marzo de 2020 hasta el 31 de enero de 2022, diagnosticando COVID-19 mediante pruebas de PCR y sus secuelas relacionadas. El seguimiento se dividió en 4 periodos según las oleadas de infección. Medimos la gravedad de la COVID-19 mediante tasas de hospitalización. Empleamos estadísticas descriptivas y multivariables ajustadas con el modelo de regresión de efectos mixtos de Poisson. También se recopiló información sobre ARN de SARS-CoV-2 en aguas residuales y muertes por COVID-19 en el área de Boston hasta el 30 de mayo de 2023.
ResultadosComparando los 2 últimos periodos del estudio (1 de enero al 15 de diciembre de 2021 y 16 de diciembre de 2021 al 31 de enero de 2022) con el periodo inicial (8 de marzo al 31 de mayo de 2020), las tasas de incidencia de hospitalización fueron 0,08 (IC 95%: 0,03-0,17) y 0,03 (IC 95%: 0,01-0,15), respectivamente. Además, se observó un riesgo relativo de 0,012 (IC 95%: 0,012-0,012) al comparar la mortalidad por COVID-19 con las copias/ml de ARN de SARS-CoV-2 en aguas residuales de Boston entre el 16 de diciembre de 2021 y el 30 de mayo de 2023, en relación con el periodo inicial.
ConclusionesLa gravedad de la COVID-19 disminuyó un 90%.
Year to date (August 2023), the World Health Organization has confirmed more than 769 million cases of COVID-19 over the world, more than 15 million deaths and more than 13,400million vaccine doses administered. The first wave of the pandemic in the winter/spring of 2020 brought an oversaturation of hospitals and Intensive Care Units (ICUs), extreme fatigue to healthcare workers (HCWs) and a lack of Personal Protective Equipment (PPE) due to the huge increase of the demand. This situation left HCWs more susceptible to SARS-CoV-2 (the virus causing COVID-19) and led to more than 115,000 deaths between March 2020 and May 2021.1
Since the first outbreak of SARS-CoV-2 in December 2019 with the Alpha variant, the virus has mutated into more than 10 variants, reaching the current Omicron variant predominance since December 2021. These variants differ in their speed of emergence, transmissibility and virulence,2 which along with population immunity they determine the impact on the population in terms of COVID-19 severity. In fact, previous literature has shown decreasing COVID-19 complications throughout the first few months after the initial outbreak.3
On the other hand, the pharmaceutical industry urgently began to develop treatments4 and vaccines against SARS-CoV-2 using different mechanisms5 while at the hospitals some existing medication was used, such as azithromycin, hydroxychloroquine or dexamethasone,6 trying to mitigate the disease severity. COVID-19 vaccines were designed to protect against SARS-CoV-2, but evidence has shown the effectiveness against different variants varies. In general, the primary vaccination series and natural immunity have reduced the severity and death rates of the disease.2 The evolution of the virus, an accumulation of knowledge, population immunity and the development of treatments have altogether led to a better prognosis of COVID-19 over time.
The aim of this study was to evaluate the severity evolution in of SARS-CoV-2 infection over the course the pandemic as measured by case-hospitalization rates, among university students in Spain who kept attending to in-person classes, and HCWs in two university hospitals in Spain and one hospital in Boston.
Materials and methodsBetween March 8th, 2020 and January 31st, 2022, a prospective cohort study was conducted on 17,681 participants in Spain, where 12,050 were university students, 2446 were university staff, 1006 Healthcare Workers (HCWs) from Clinic University of Navarra in Madrid and 2179 HCWs in Pamplona, and 4700 HCWs from Cambridge Health Alliance (CHA) in the Greater Boston Area who were diagnosed with SARS-CoV-2 infection by PCR testing. The total number of participants was 22,381, and a total of 5710 SARS-CoV-2 positive cases were analyzed for this study.
The temporality of the study had an initial retrospective part (periods 1 and 2), and a prospective part (periods 3 and 4). Although these first data were collected prospectively in a clinical registry and all the analyses performed were carried out as a prospective analysis, since the study began with disease-free patients, with no prevalent cases, and we analyzed the risk of occurrence of the event.
VariablesWe categorized the main exposure variable of interest, timing throughout the pandemic, into four periods. The first period corresponds to COVID-19 pandemic's first wave from March 8th to May 30th, 2020; the second period corresponds to the time prior to primary vaccination from June 1st to December 31st, 2020; the third period covers primary vaccination campaigns and delta variant predominance from January 1st to December 15th, 2021; and the fourth period corresponds to the delivery of booster doses and the emergence of Omicron variant from December 16th, 2021 to January 31st, 2022.
The main outcome measure of COVID-19 severity was case-hospitalization rate, calculated per period as Number of Hospitalized Participants/Number of positive cases. Other outcomes included the rates of intubations and deaths. In addition, we collected the cases’ sociodemographic variables such as age, sex and workplace, as well as reinfection events. For the first period, only HCWs were taking into account because the pandemic declaration forced the university to remain closed, until its opening in September 2020.
On the other hand, we collected SARS-CoV-2 RNA information in Boston-area wastewater provided by Biobot Analytics (https://www.mwra.com/biobot/biobotdata.htm), and information on COVID-19 deaths in the same area through May 30, 2023 (https://www.mass.gov/info-details/covid-19-response-reporting).
Statistical analysisFor descriptive analyses of continuous variables, means, standard deviations and 95% confidence intervals were used, and t-tests were performed. The Chi-square test, Fisher's exact test or Student's t-tests, as appropriate, was used to compare the categorical variables across the four periods of the study. The mixed-effects Poisson regression model adjusting for sex, age, work-center, healthcare worker status and reinfection was conducted to evaluate the hospitalization risk for each period of time. COVID-19 incidence was calculated as cumulative incidence in 14 days (CI14=number of new COVID-19 cases during a 14-day period prior to and including the given date). We accounted for correlated data since reinfected cases were included in the analysis and contributed to more than one data entries.
Finally, crude relative risks of death from COVID-19 and SARS-CoV-2 RNA data in Boston-area wastewater were calculated as a sensitivity analysis, using the first wave as the reference category.
A two-tailed p values<0.05 were considered to be statistically significant. The STATA 15 and R software 3.6.3 were used for statistical analysis.
The study was conducted following the STROBE guidelines for cohort studies and in compliance with the study protocol, the current version of the Declaration of Helsinki, and the local, legal and regulatory requirements. It was approved by the University of Navarra Ethics committee: 2020.190 on October 30th, 2020 and the Cambridge Health Alliance Institutional Review Board (Symptoms Predictive of Positive COVID-19 Testing). In the case of the University of Navarra, participants completed an online informed consent form. In the case, at Cambridge Health Alliance, there was no consent, as the medical records of the employees were reviewed and the study was therefore exempt. AFM and SNK had access to de-identified patient data and anonymized the data for their analyses, in both cohorts respectively.
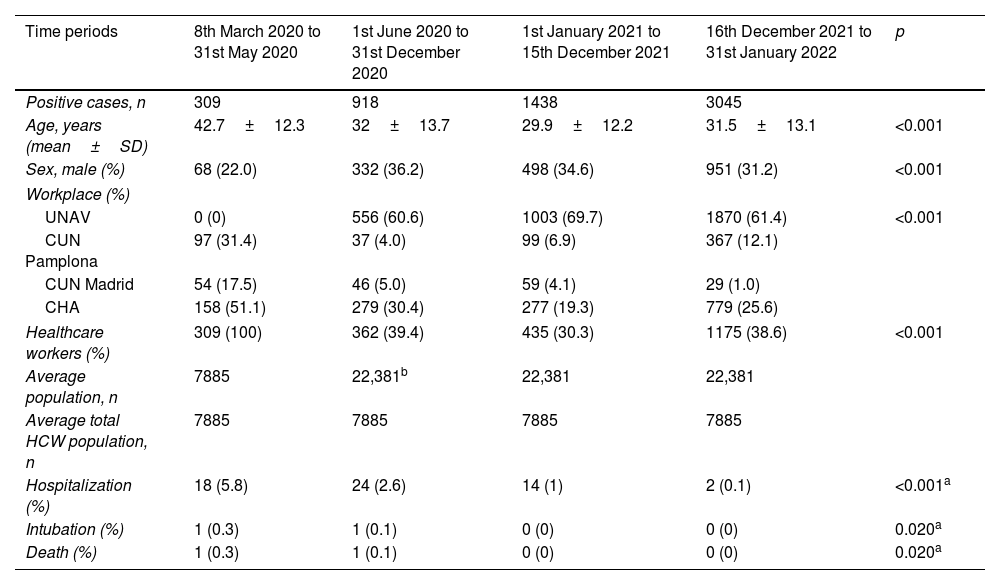
ResultsThe total number of cases of COVID-19 throughout the four periods was 5710 PCR-confirmed cases, where 156 cases were reinfections. The mean age of the study population was 31.7 years old (95% CI: 18.5–44.9), with mostly women, 67%. The cases’ characteristics and outcomes are described in Table 1, stratified by the four time periods.
Baseline characteristics of COVID-19 positive cases across the time periods 8th March 2020–31st January 2022.
| Time periods | 8th March 2020 to 31st May 2020 | 1st June 2020 to 31st December 2020 | 1st January 2021 to 15th December 2021 | 16th December 2021 to 31st January 2022 | p |
|---|---|---|---|---|---|
| Positive cases, n | 309 | 918 | 1438 | 3045 | |
| Age, years (mean±SD) | 42.7±12.3 | 32±13.7 | 29.9±12.2 | 31.5±13.1 | <0.001 |
| Sex, male (%) | 68 (22.0) | 332 (36.2) | 498 (34.6) | 951 (31.2) | <0.001 |
| Workplace (%) | |||||
| UNAV | 0 (0) | 556 (60.6) | 1003 (69.7) | 1870 (61.4) | <0.001 |
| CUN Pamplona | 97 (31.4) | 37 (4.0) | 99 (6.9) | 367 (12.1) | |
| CUN Madrid | 54 (17.5) | 46 (5.0) | 59 (4.1) | 29 (1.0) | |
| CHA | 158 (51.1) | 279 (30.4) | 277 (19.3) | 779 (25.6) | |
| Healthcare workers (%) | 309 (100) | 362 (39.4) | 435 (30.3) | 1175 (38.6) | <0.001 |
| Average population, n | 7885 | 22,381b | 22,381 | 22,381 | |
| Average total HCW population, n | 7885 | 7885 | 7885 | 7885 | |
| Hospitalization (%) | 18 (5.8) | 24 (2.6) | 14 (1) | 2 (0.1) | <0.001a |
| Intubation (%) | 1 (0.3) | 1 (0.1) | 0 (0) | 0 (0) | 0.020a |
| Death (%) | 1 (0.3) | 1 (0.1) | 0 (0) | 0 (0) | 0.020a |
Mean±SD for age. Count (%) for other variables.
UNAV; University of Navarra.
CUN Pamplona; University of Navarra Clinic, located in Pamplona.
CUN Madrid; University of Navarra Clinic, located in Madrid.
CHA; Cambridge Health Alliance.
In the first period, all the positive cases were HCWs because all university students and employees stayed at home due to the mandatory lockdown implemented in Spain starting on March 14th. In the following periods, university students and staff were included, so CHA center HCWs represented between 20% and 30% of positive cases, and all infected HCWs represented between 30% and 40% of the total number of cases. The greatest number of positive COVID-19 cases, more than 60%, corresponded to the University of Navarra students and employees.
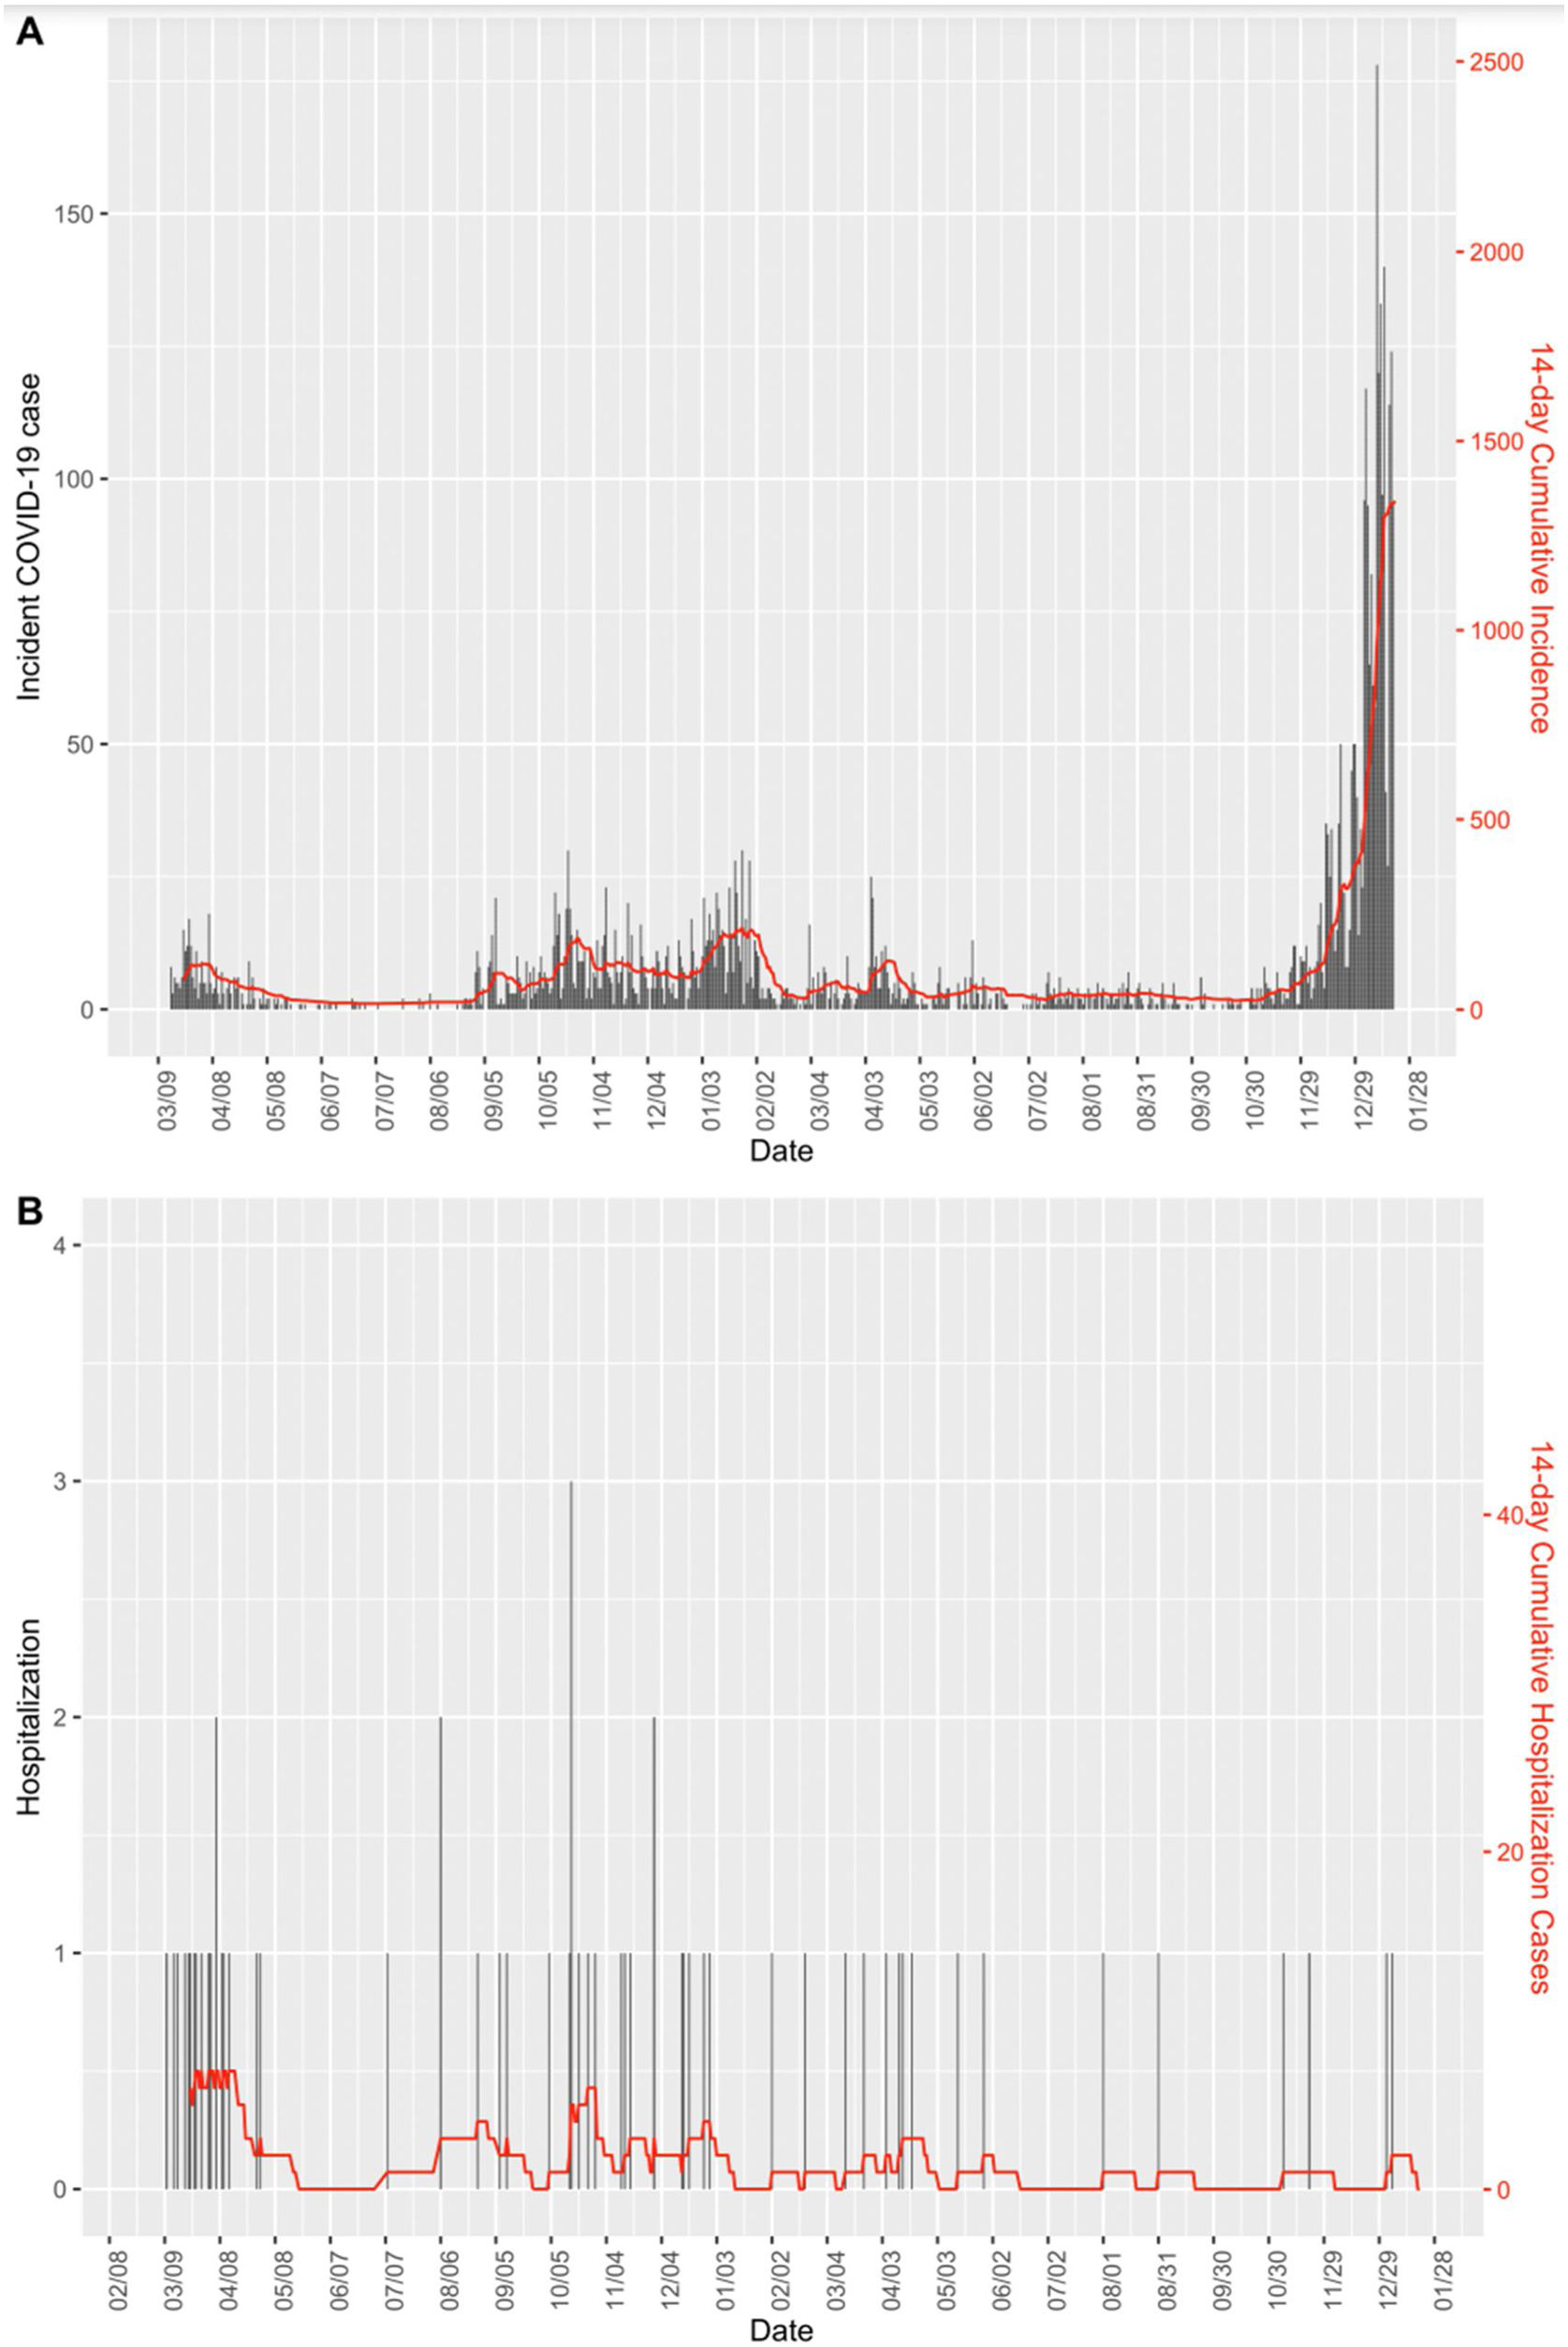
Fig. 1 shows the CI14 of infection cases and hospitalization cases between March 2020 and January 2022. It can be seen that despite the peak of incident cases in the latter period, hospitalization cases were below the preceding periods.
 between March 2020 and January 2022. (A) COVID-19 cases. (B) Hospitalization COVID-19 cases.")
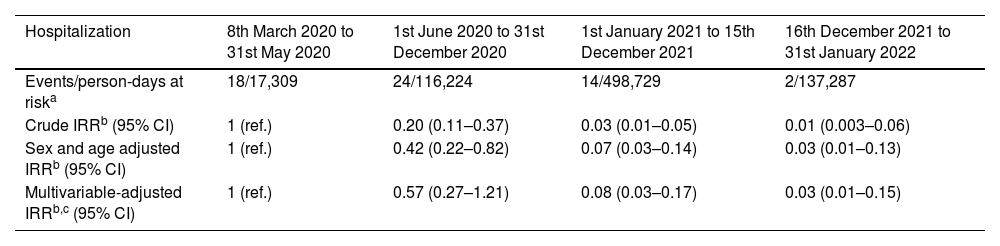
The observed crude Incidence Rate Ratio (IRR) of hospitalization among COVID-19 cases, or case-hospitalization rate ratio, in the second, third and fourth periods compared with the first period was 0.2 (95% CI: 0.11–0.37), 0.03 (95% CI: 0.01–0.05) and 0.01 (95% CI: 0.003–0.06), respectively (Table 2). After adjusting for several factors (i.e., sex, age, work center, healthcare worker status and reinfection), the decrement of hospitalization risk for the second period became non-significant, while the third and fourth period presented a significant decrease in hospitalizations, with an IRR of 0.08 (95% CI: 0.03–0.17) and 0.03 (95% CI: 0.01–0.15), respectively.
Hospitalization risk according to time periods 8th March 2020–31st January 2022.
| Hospitalization | 8th March 2020 to 31st May 2020 | 1st June 2020 to 31st December 2020 | 1st January 2021 to 15th December 2021 | 16th December 2021 to 31st January 2022 |
|---|---|---|---|---|
| Events/person-days at riska | 18/17,309 | 24/116,224 | 14/498,729 | 2/137,287 |
| Crude IRRb (95% CI) | 1 (ref.) | 0.20 (0.11–0.37) | 0.03 (0.01–0.05) | 0.01 (0.003–0.06) |
| Sex and age adjusted IRRb (95% CI) | 1 (ref.) | 0.42 (0.22–0.82) | 0.07 (0.03–0.14) | 0.03 (0.01–0.13) |
| Multivariable-adjusted IRRb,c (95% CI) | 1 (ref.) | 0.57 (0.27–1.21) | 0.08 (0.03–0.17) | 0.03 (0.01–0.15) |
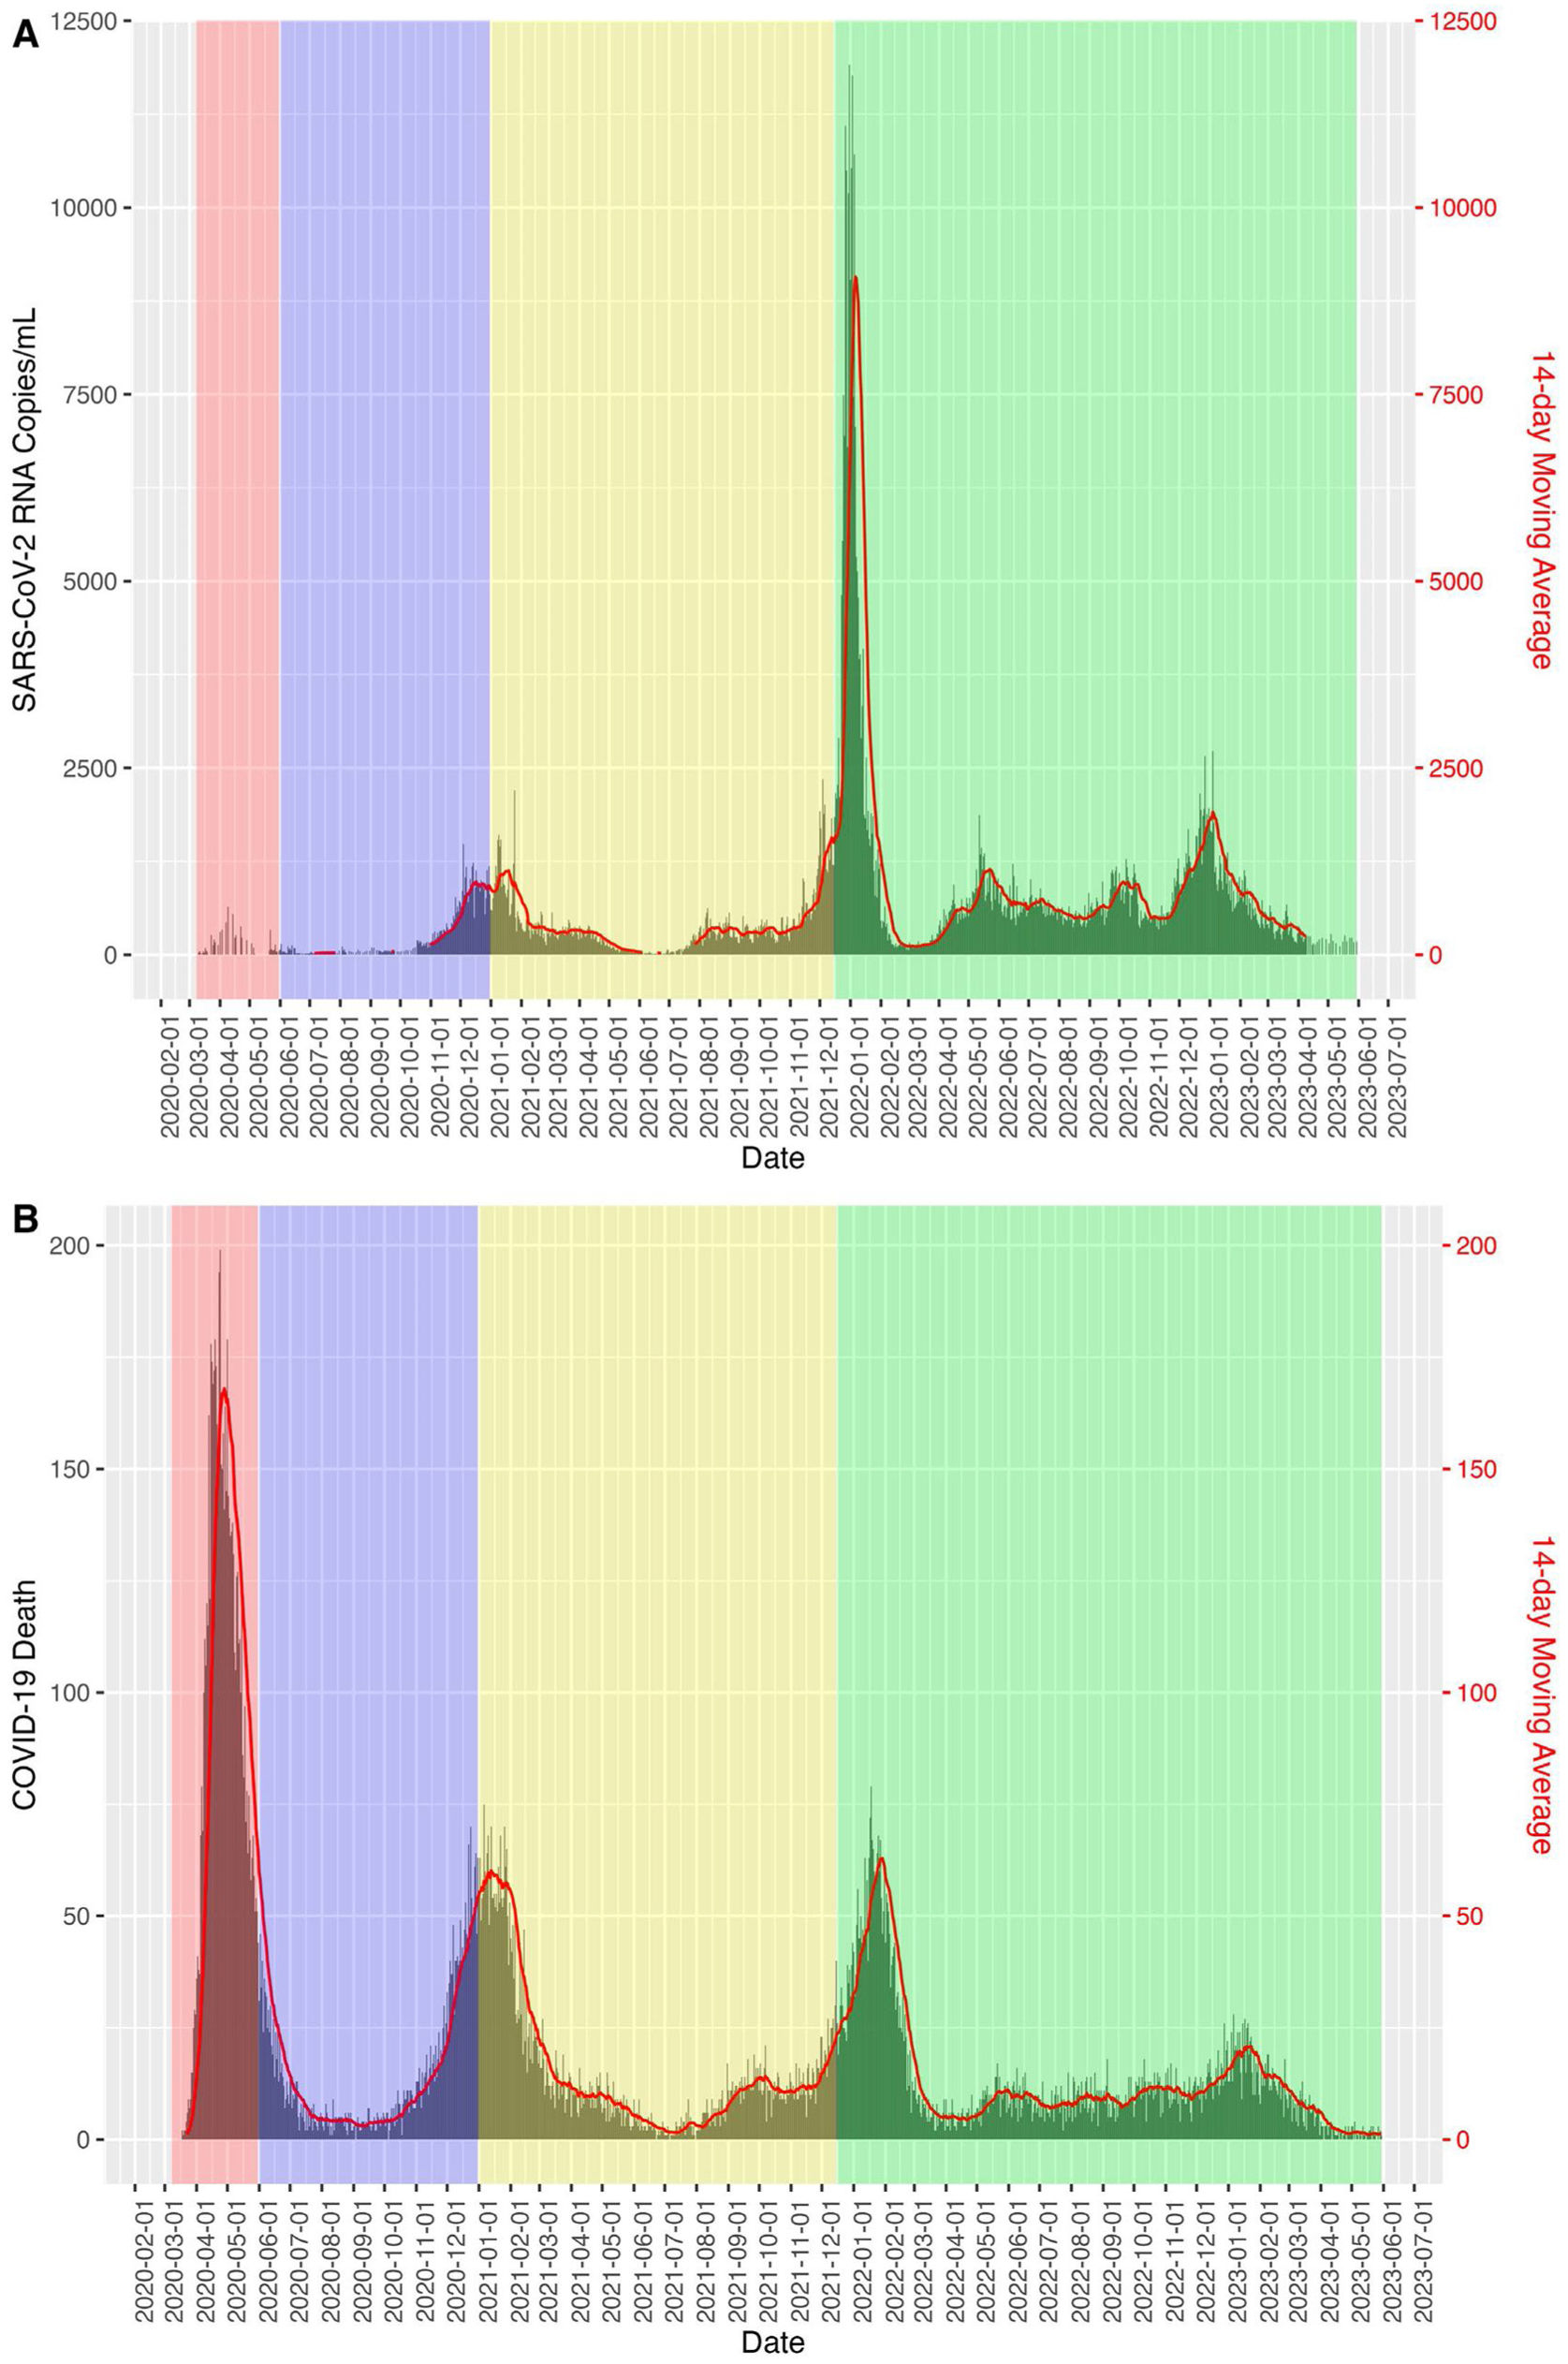
Fig. 2 shows how the relative risk between SARS-COV-2 viral concentration in sewage and COVID-19 mortality in the Boston area decreases as the periods progress, taking as a reference the time period of the first wave.
Discussion between March 2020 and May 2023. (A) SARS-CoV-2 RNA copies/mL in Boston-area wastewater. (B) Death of COVID-19 cases in Boston-area. Relative risk and 95%CI between the two measures.")
In this prospective cohort study, we followed HCWs of two different healthcare systems in the USA and Spain, a total of three hospitals, in between March 8th 2020 and January 31st 2022. We found a 97% reduction in hospitalization risks comparing the last period to initial outbreak, while the number of cases increased almost 10 times throughout the study period. Our findings provide real-world evidence of evolving SARS-CoV-2 virulence, which has decreased dramatically over time as the population gained widespread immunity and the virus became an endemic infection.
In the first period starting from March 14th 2020, despite mandatory lockdowns we observed the highest rate of case-hospitalization rate, 5.8%. Likely explanations include: a largely immunologically naïve population, a more virulent strain of virus, and less initial knowledge regarding transmission, protective measures and effective treatments.
Since the onset of the second period, research and practice identified various SARS-CoV-2 treatments such as corticosteroids, hydroxychloroquine, remdesivir, monoclonal antibodies, vaccines and lopinavir/ritonavir to mitigate severe COVID-19 complications.7,8 During this period, in October 2020, Delta variant was first identified and subsequently became globally dominant in June 2021. Compared to the original strain, the Delta variant was more contagious with a 97% higher transmission rate.9 Accordingly, we found an increase of COVID-19 cases in our population, while observed a less severe health impact (almost 50% less of hospitalizations in comparison with the first period) and a softer criteria for hospital admissions.
The first COVID-19 vaccine that received the emergency use authorization (EUA) was Pfizer's, in November 2020 in both the USA and Europe, and the vaccination campaigns started soon in December 2020. Therefore, the populational immunity had been rapidly established during the third period, especially among HCWs who were prioritized in the campaigns. In fact, most people in the study got their first dose of vaccine between December 2020 and June 2021. Even though the Delta variant became predominant in the summer of 2021, with its greater transmissibility and ability to escape immunity, we still observed a continued decreasing trend in complications.
The fourth period was characterized by the spread of the Omicron variant, which is from 3 to 5 times less virulent than the Delta variant, but more contagious.10 Nonetheless, we continued to observe decreased hospitalizations. Overall, throughout the study period, the incidence of COVID-19 and its CI14 increased over time, especially in certain periods such as the first wave in March 2020, the beginning of the academic year in 2020, Christmas Eve in 2020, Easter in 2021 and Christmas Eve in 2021. However, we observed that hospitalizations decreased, despite an increasing disease incidence and its CI14.
The application of sewage surveillance for COVID-19 has been shown to be an effective method of identification and quantification.11 To provide robustness to these claims, we calculated the relative risk of deaths from COVID-19 in relation to the amount of SARS-CoV-2 RNA measured in wastewater and observed that the risks of deaths decreased from the first pandemic period to a RR=0.0012 CI95% (0.012–0.012) in the fourth extended period through May 30, 2023. This suggests that the immunization status of the population, the new dominant strains and the knowledge acquired about COVID-19 have reduced its impact in terms of mortality.
Limitations and strengthsOur study has some limitations. First, our cohort was subject to a healthy worker/student effect relative to the general population, and thus, we had few cases of hospitalization, death and ICU admission. Another limitation is the lack of information about underlying health conditions of the HCWs, such as hypertension, COPD, asthma, etc., nor if there were any concomitant infection during the study periods. The small number of the outcomes limited our statistical power to analyze the risk of death and ICU admission. In addition, we did not collect information on symptoms at the time of hospital admission, and it is likely that at the later period, when more contagious variants emerged, COVID-19 hospitalization could be misclassified due to incidental findings from regular admission screening programs. The differential information bias could make our findings an underestimation. For COVID-19 diagnosis, a limitation was the lack of adequate testing in the first months of 2020, so until the second half of the year, these diagnoses were not 100% accurate and were based on reporting, this is why wastewater information was used in order to overcome this limitation. Also, another limitation is the lack of SARS-CoV-2 sequencing to identify the exact variants, although chronologically it could be inferred. Finally, we cannot tell from the results whether the decreased disease severity was due to viral evolution, vaccination rate, healthcare improvement, or other factors. However, the observation of more mild cases and less severe complications over time is a result of all these mechanisms combined.
Nonetheless, the study does have several strengths. First, all COVID-19 cases were diagnosed by PCR and were not self-referred, freeing the study population from misclassification. In addition, there is a large sample of 5710 incident cases across USA and Spain, which allowed us to analyze the risk of hospitalization in the different periods and enhance generalizability. Finally, all cases’ information was provided directly by the human resources department or extracted from the official diagnostic database of each institution, minimizing information bias. In conclusion, our present study on an international cohort of HCWs and university affiliates demonstrates that SARS-CoV-2 severity measured in number of hospitalizations and deaths has reduced by 98% and 100%, respectively, during the later periods of the pandemic.
Data availability statementThe data set is available to any interested reader. Please contact the corresponding author at afmontero@unav.es.
FundingNavarra Government (number 0011-3638-2020-000013).
Conflict of interestThe authors report there are no competing interests to declare.