


In 2010, the AIDS Study Group (Grupo de Estudio del SIDA [GESIDA]) developed 66 quality care indicators. The aim of this study is to determine which of these indicators are associated with mortality and hospital admission, and to perform a preliminary assessment of a prediction rule for mortality and hospital admission in patients on treatment and follow-up.
MethodsA retrospective cohort study was conducted in the Hospital Universitario Son Espases (Palma de Mallorca, Spain). Eligible participants were patients with human immunodeficiency syndrome ≥18 years old who began follow-up in the Infectious Disease Section between 1 January 2000 and 31 December 2012. A descriptive analysis was performed to evaluate anthropometric variables, and a logistic regression analysis to assess the association between GESIDA indicators and mortality/admission. The mortality probability model was built using logistic regression.
ResultsA total of 1944 adults were eligible (median age: 37 years old, 78.8% male). In the multivariate analysis, the quality of care indicators associated with mortality in the follow-up patient group were the items 7, 16 and 20, and in the group of patients on treatment were 7, 16, 20, 35, and 38. The quality of care indicators associated with hospital admissions in the follow-up patients group was the same as those in the mortality analysis, plus number 31. In the treatment group the associated quality of care indicators were items 7, 16, 20, 35, 38, and 40.
ConclusionsSome GeSIDA quality of care indicators were associated with mortality and/or hospital admissions. These indicators are associated with delayed diagnosis, regular monitoring, prevention of infections, and control of comorbidities.
En 2010 el Grupo Español de Estudio de SIDA (GeSIDA) desarrolló 66 indicadores de calidad asistencial. Nuestro objetivo es determinar cuáles de estos indicadores se asocian a mortalidad y/o ingreso, y realizar una evaluación preliminar de la utilidad de un índice predictor de mortalidad e ingreso.
MétodosEstudio de cohortes retrospectivo realizado en el Hospital Universitario Son Espases. Los pacientes con infección por el virus de la inmunodeficiencia humana incluidos fueron aquellos que iniciaron seguimiento en consultas entre el 1 de enero de 2000 y el 31 de diciembre de 2012. Se realizó análisis descriptivo de las variables demográficas y de los indicadores, y un estudio de regresión logística para valorar la asociación entre los indicadores y riesgo de mortalidad/ingreso. Se calcularon índices predictores de mortalidad e ingreso para pacientes en seguimiento y en tratamiento.
ResultadosFueron incluidos 1.944 pacientes (media de edad: 37 años, el 78,8% varones). En el análisis multivariante relativo a mortalidad, los indicadores asociados en pacientes en seguimiento fueron el 7, 16 y 20 y en pacientes en tratamiento se añaden el 35 y 38. En el análisis multivariante relativo a ingreso, los indicadores asociados en pacientes en seguimiento fueron los mismos que para mortalidad, además del 31, y en el grupo de pacientes en tratamiento se asociaban los indicadores 7, 16, 20, 35, 38 y 40.
ConclusiónSe han identificado varios indicadores de calidad que pueden estar relacionados con ingreso hospitalario y mortalidad. Estos indicadores hacen referencia fundamentalmente al retraso diagnóstico, seguimiento regular, prevención de las infecciones y control de comorbilidades.
Since the discovery of human immunodeficiency virus (HIV) infection, we have witnessed significant progress in knowledge about its diagnosis and in the clinical and therapeutic management of persons affected, as shown by the numerous clinical guidelines that are currently available. However, until recently the use of indicators or care quality rating systems in these patients was limited.
Several initiatives for the development of care quality indicators with the objective of identifying and planning changes for the continuous improvement of HIV units have emerged in recent years. In this regard, in 2010 the Spanish AIDS Study Group [Grupo Español de Estudio de SIDA (GeSIDA)] set out a list of 66 indicators based on the clinical practice guidelines of this working group. Of these 66 indicators, 22 were considered relevant, and GeSIDA understands that the use of these indicators is recommended in all care units for people with HIV infection.1 These indicators, which were considered relevant, have recently been validated.2
In 2012, the British Columbia Centre for Excellence in HIV/AIDS in Vancouver (Canada) developed and validated the Programmatic Compliance Score, based on the IAS-USA treatment guidelines for HIV-infected adults. In this study, the Programmatic Compliance Score was validated as a predictor of all-cause mortality in patients who were receiving antiretroviral therapy (ART).3
Furthermore, the Department of Health and Human Services in Washington has also developed a series of care quality indicators to monitor clinical care related to prevention, treatment and clinical services of patients with HIV infection. The creation of these indicators is aimed at controlling the use and administration of resources. The indicators can be consulted on the website http://kff.org/state-category/hivaids/.
The Veterans Aging Cohort Study (VACS) has developed a prognostic index which has added some analytical markers related to non-AIDS events to the prognostic indicators of morality due to HIV,4,5 demonstrating their usefulness as predictors of mortality and admissions to hospital or to intensive care units.6,7
The objective of this study is to determine which of the GeSIDA quality indicators are associated with mortality and/or admission. Furthermore, we will carry out a preliminary assessment of the usefulness of a predictor for mortality and admission in patients undergoing follow-up and in the subgroup of patients who started ART during the study period.
MethodsStudy conducted at the Hospital Universitario Son Espases located in Palma de Mallorca (Spain). The hospital offers healthcare to 330,000 inhabitants. 3372 patients with HIV infection from the Hospital Universitario Son Espases underwent follow-up in outpatient consultations from 2000 until 2012. At the study end date, 1825 patients with HIV infection were undergoing follow-up.
Patients with HIV infection over 18 years of age and who started follow-up in outpatient consultations in the Infectious Diseases unit at the Hospital Universitario Son Espases between 1 January 2000 and 31 December 2012 were enrolled in the study. The follow-up period started when the patient was first registered until the time of death or loss to follow-up due to any cause, and in the remainder of patients until the completion date of the study on 30 June 2013.
It is a retrospective cohort study and was conducted by collecting variables from a specific database (eVIHa) of patients with HIV infection from the hospital, in which all patients, without exception, who started follow-up from 2000 were enrolled. This database is monitored by periodic quality checks and contributes to national and international cohorts.
The variables studied were: age at the time of starting follow-up, gender, the status of having been an injecting drug user (IDU) at any point of the study as a risk factor for HIV infection, date of first visit to the HIV clinic, date of starting ART, date of last recorded visit, loss to follow-up, death, hospital admission to medical services and automated GeSIDA care quality indicators available in the eVIHa database. At the time of the study there were a total of 19 variables (15 of which were considered relevant by GeSIDA). These are described in Table 1. The indicator was considered to be carried out in accordance with the standards established in the GeSIDA quality indicators document.1
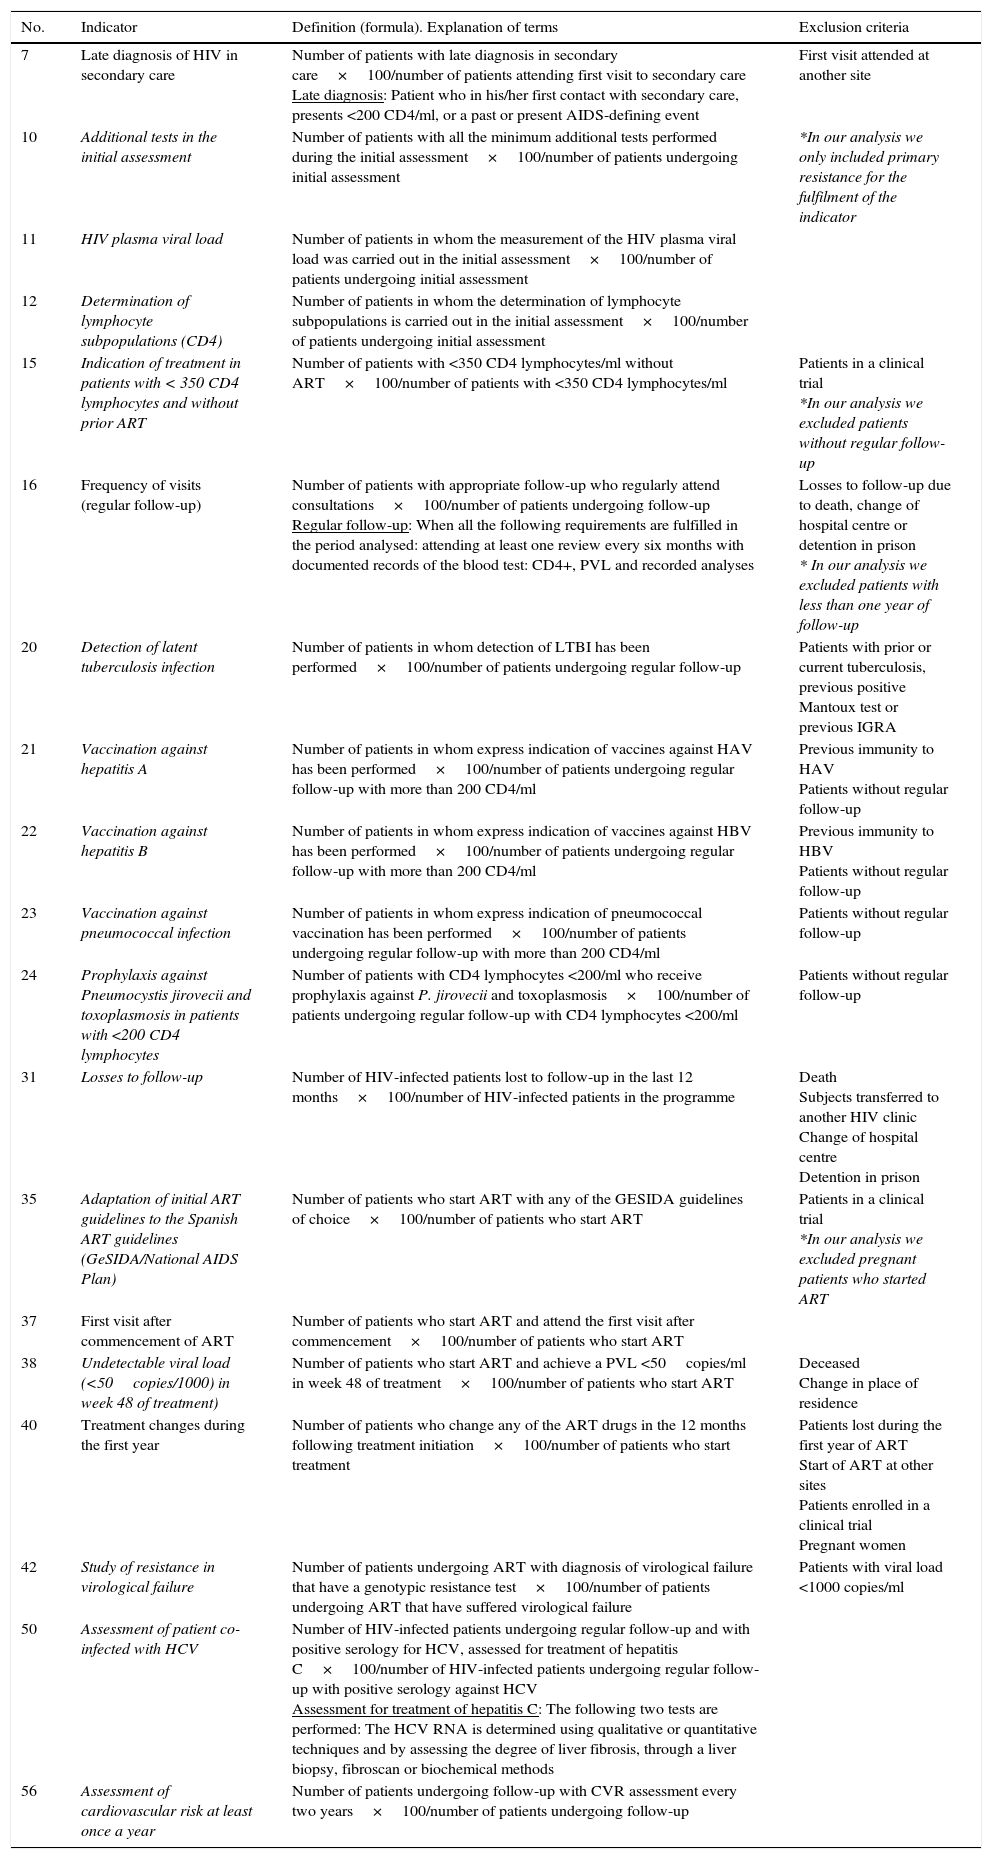
Description of the GeSIDA indicators selected for this study (the indicators considered relevant by GeSIDA appear in italics).
| No. | Indicator | Definition (formula). Explanation of terms | Exclusion criteria |
|---|---|---|---|
| 7 | Late diagnosis of HIV in secondary care | Number of patients with late diagnosis in secondary care×100/number of patients attending first visit to secondary care Late diagnosis: Patient who in his/her first contact with secondary care, presents <200 CD4/ml, or a past or present AIDS-defining event | First visit attended at another site |
| 10 | Additional tests in the initial assessment | Number of patients with all the minimum additional tests performed during the initial assessment×100/number of patients undergoing initial assessment | *In our analysis we only included primary resistance for the fulfilment of the indicator |
| 11 | HIV plasma viral load | Number of patients in whom the measurement of the HIV plasma viral load was carried out in the initial assessment×100/number of patients undergoing initial assessment | |
| 12 | Determination of lymphocyte subpopulations (CD4) | Number of patients in whom the determination of lymphocyte subpopulations is carried out in the initial assessment×100/number of patients undergoing initial assessment | |
| 15 | Indication of treatment in patients with < 350 CD4 lymphocytes and without prior ART | Number of patients with <350 CD4 lymphocytes/ml without ART×100/number of patients with <350 CD4 lymphocytes/ml | Patients in a clinical trial *In our analysis we excluded patients without regular follow-up |
| 16 | Frequency of visits (regular follow-up) | Number of patients with appropriate follow-up who regularly attend consultations×100/number of patients undergoing follow-up Regular follow-up: When all the following requirements are fulfilled in the period analysed: attending at least one review every six months with documented records of the blood test: CD4+, PVL and recorded analyses | Losses to follow-up due to death, change of hospital centre or detention in prison * In our analysis we excluded patients with less than one year of follow-up |
| 20 | Detection of latent tuberculosis infection | Number of patients in whom detection of LTBI has been performed×100/number of patients undergoing regular follow-up | Patients with prior or current tuberculosis, previous positive Mantoux test or previous IGRA |
| 21 | Vaccination against hepatitis A | Number of patients in whom express indication of vaccines against HAV has been performed×100/number of patients undergoing regular follow-up with more than 200 CD4/ml | Previous immunity to HAV Patients without regular follow-up |
| 22 | Vaccination against hepatitis B | Number of patients in whom express indication of vaccines against HBV has been performed×100/number of patients undergoing regular follow-up with more than 200 CD4/ml | Previous immunity to HBV Patients without regular follow-up |
| 23 | Vaccination against pneumococcal infection | Number of patients in whom express indication of pneumococcal vaccination has been performed×100/number of patients undergoing regular follow-up with more than 200 CD4/ml | Patients without regular follow-up |
| 24 | Prophylaxis against Pneumocystis jirovecii and toxoplasmosis in patients with <200 CD4 lymphocytes | Number of patients with CD4 lymphocytes <200/ml who receive prophylaxis against P. jirovecii and toxoplasmosis×100/number of patients undergoing regular follow-up with CD4 lymphocytes <200/ml | Patients without regular follow-up |
| 31 | Losses to follow-up | Number of HIV-infected patients lost to follow-up in the last 12 months×100/number of HIV-infected patients in the programme | Death Subjects transferred to another HIV clinic Change of hospital centre Detention in prison |
| 35 | Adaptation of initial ART guidelines to the Spanish ART guidelines (GeSIDA/National AIDS Plan) | Number of patients who start ART with any of the GESIDA guidelines of choice×100/number of patients who start ART | Patients in a clinical trial *In our analysis we excluded pregnant patients who started ART |
| 37 | First visit after commencement of ART | Number of patients who start ART and attend the first visit after commencement×100/number of patients who start ART | |
| 38 | Undetectable viral load (<50copies/1000) in week 48 of treatment) | Number of patients who start ART and achieve a PVL <50copies/ml in week 48 of treatment×100/number of patients who start ART | Deceased Change in place of residence |
| 40 | Treatment changes during the first year | Number of patients who change any of the ART drugs in the 12 months following treatment initiation×100/number of patients who start treatment | Patients lost during the first year of ART Start of ART at other sites Patients enrolled in a clinical trial Pregnant women |
| 42 | Study of resistance in virological failure | Number of patients undergoing ART with diagnosis of virological failure that have a genotypic resistance test×100/number of patients undergoing ART that have suffered virological failure | Patients with viral load <1000 copies/ml |
| 50 | Assessment of patient co-infected with HCV | Number of HIV-infected patients undergoing regular follow-up and with positive serology for HCV, assessed for treatment of hepatitis C×100/number of HIV-infected patients undergoing regular follow-up with positive serology against HCV Assessment for treatment of hepatitis C: The following two tests are performed: The HCV RNA is determined using qualitative or quantitative techniques and by assessing the degree of liver fibrosis, through a liver biopsy, fibroscan or biochemical methods | |
| 56 | Assessment of cardiovascular risk at least once a year | Number of patients undergoing follow-up with CVR assessment every two years×100/number of patients undergoing follow-up |
A descriptive analysis of the demographic variables was carried out, calculating means and standard deviations or median and quartiles, depending on the distribution of the quantitative variable and frequencies and ratios with confidence intervals at 95% for qualitative variables. To assess the strength of association between the non-compliance of indicators and dependent variables, hospital admission and mortality, the odds ratio (OR) was calculated with confidence intervals at 95% for each indicator, and each multivariate analysis was carried out using logistic regression, including indicators, age as a continuous quantitative variable and IDU. Variables with no association, with a P value >0.15, and with no confounding effect on the rest of the variables were disregarded. From the coefficients, a rate was calculated to summarise the overall effect of the non-compliance of the indicators associated with mortality and hospital admission. Their discriminatory capacity was assessed using ROC curves. IBM® SPSS® Statistics v22 was used for the calculations.
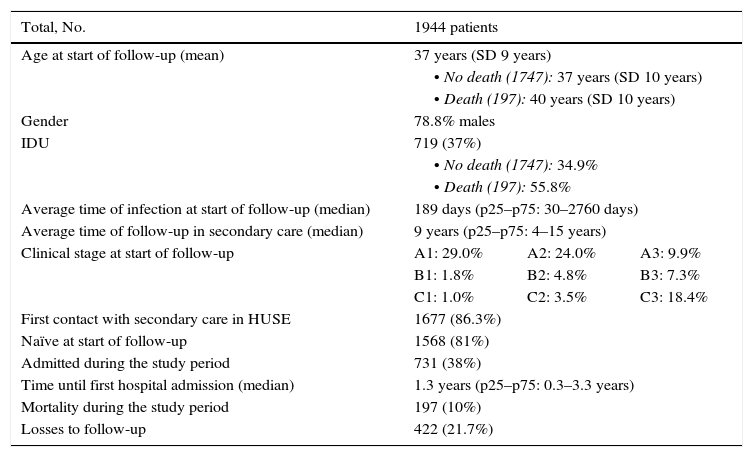
Results1944 patients were enrolled. The mean age was 37 years (SD 9 years) and 78.8% were male. The clinico-epidemiological characteristics of interest are presented in Table 2. The mean time for follow-up was 9.10 years, during which time 197 patients died (10%), 731 were admitted to medical services (38%) and 422 were lost or changed their residence (21.7%). Of the total number of patients who died, 70.1% were admitted at some point during the follow-up period; of the patients who did not die, 23.1% were admitted.
Clinico-epidemiological characteristics of interest from the study sample.
| Total, No. | 1944 patients | ||
|---|---|---|---|
| Age at start of follow-up (mean) | 37 years (SD 9 years) | ||
| • No death (1747): 37 years (SD 10 years) | |||
| • Death (197): 40 years (SD 10 years) | |||
| Gender | 78.8% males | ||
| IDU | 719 (37%) | ||
| • No death (1747): 34.9% | |||
| • Death (197): 55.8% | |||
| Average time of infection at start of follow-up (median) | 189 days (p25–p75: 30–2760 days) | ||
| Average time of follow-up in secondary care (median) | 9 years (p25–p75: 4–15 years) | ||
| Clinical stage at start of follow-up | A1: 29.0% | A2: 24.0% | A3: 9.9% |
| B1: 1.8% | B2: 4.8% | B3: 7.3% | |
| C1: 1.0% | C2: 3.5% | C3: 18.4% | |
| First contact with secondary care in HUSE | 1677 (86.3%) | ||
| Naïve at start of follow-up | 1568 (81%) | ||
| Admitted during the study period | 731 (38%) | ||
| Time until first hospital admission (median) | 1.3 years (p25–p75: 0.3–3.3 years) | ||
| Mortality during the study period | 197 (10%) | ||
| Losses to follow-up | 422 (21.7%) | ||
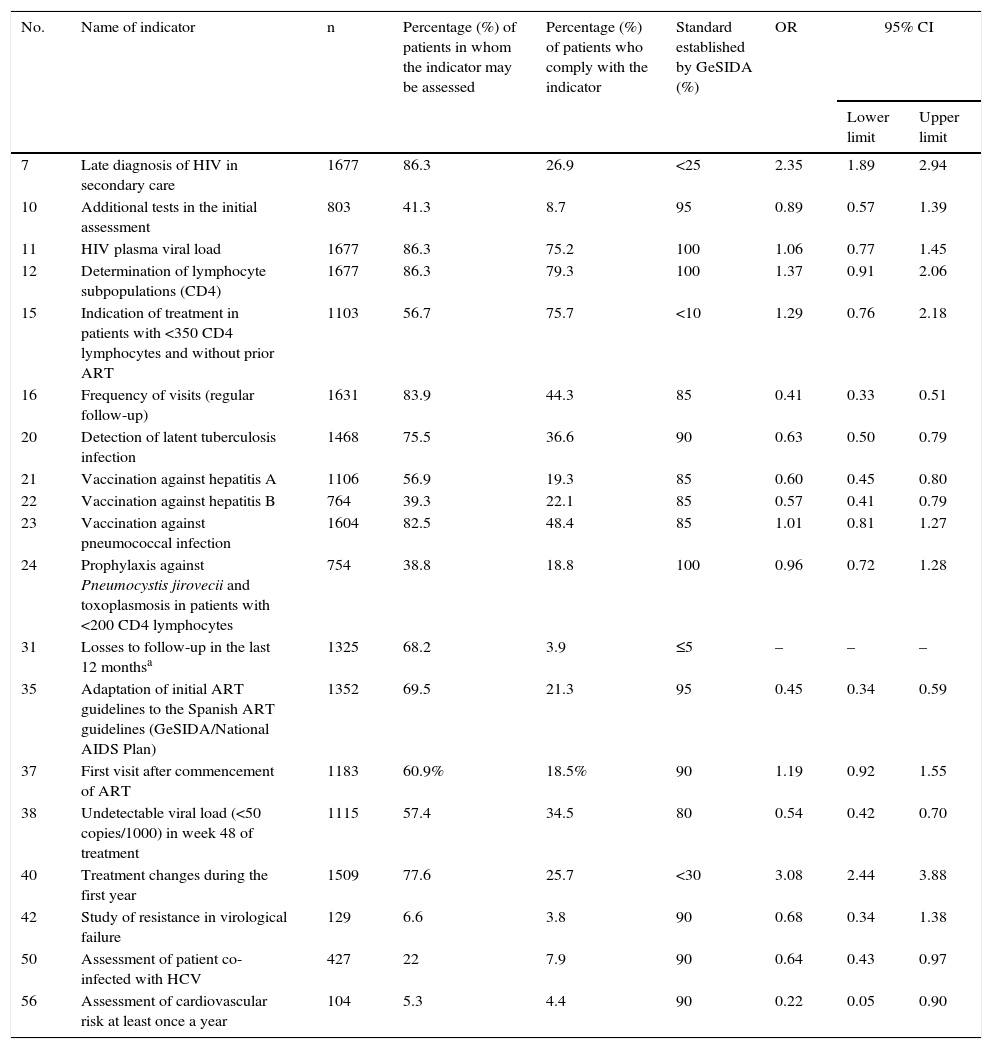
The univariate analysis of the quality indicators associated with mortality is shown in Table 3. The only indicator that was associated with an increase in the risk of mortality was 7 (late diagnosis of HIV in secondary care) with an OR of 3.10 (95% CI 2.26–4.25). A number of protection indicators were associated with a lower risk of mortality: 10 (additional tests in the initial assessment); 11 (HIV plasma viral load); 15 (indication of treatment in patients with <350 CD4 lymphocytes and without prior ART); 16 (frequency of visits); 20 (detection of latent tuberculosis infection); 21 (vaccination against hepatitis A); 22 (vaccination against hepatitis B); 23 (vaccination against pneumococcal infection); 24 (prophylaxis against Pneumocystis jirovecii [P. jirovecii] and toxoplasmosis in patients with <200 CD4 lymphocytes); 35 (adaptation of initial ART guidelines to Spanish guidelines); 38 (undetectable viral load <50 copies/ml in week 48 of treatment) and 50 (evaluation of patient co-infected with HCV). Indicator 31 (losses to follow-up) was not included in this analysis, since the status of death is incompatible with loss to follow-up.
Univariate analysis of the quality indicators associated with mortality.
| No. | Name of indicator | n | Percentage (%) of patients in whom the indicator may be assessed | Percentage (%) of patients who comply with the indicator | Standard established by GeSIDA (%) | OR | 95% CI | |
|---|---|---|---|---|---|---|---|---|
| Lower limit | Upper limit | |||||||
| 7 | Late diagnosis of HIV in secondary care | 1677 | 86.3 | 31.2 | <25% | 3.10 | 2.26 | 4.25 |
| 10 | Additional tests in the initial assessment | 803 | 41.3 | 21.2 | 95 | 0.38 | 0.15 | 0.97 |
| 11 | HIV plasma viral load | 1677 | 86.3 | 87.2 | 100 | 0.56 | 0.37 | 0.83 |
| 12 | Determination of lymphocyte subpopulations (CD4) | 1677 | 86.3 | 91.9 | 100 | 1.03 | 0.58 | 1.83 |
| 15 | Indication of treatment in patients with <350 CD4 lymphocytes and without prior ART | 1103 | 56.7 | 94 | <10 | 0.55 | 0.29 | 1.06 |
| 16 | Frequency of visits (regular follow-up) | 1631 | 83.9 | 52.9 | 85 | 0.36 | 0.24 | 0.53 |
| 20 | Detection of latent tuberculosis infection | 1468 | 75.5 | 48.5 | 90 | 0.43 | 0.29 | 0.65 |
| 21 | Vaccination against hepatitis A | 1106 | 56.9 | 34 | 85 | 0.28 | 0.14 | 0.56 |
| 22 | Vaccination against hepatitis B | 764 | 39.3 | 56.2 | 85 | 0.22 | 0.11 | 0.44 |
| 23 | Vaccination against pneumococcal infection | 1604 | 82.5 | 58.7 | 85 | 0.38 | 0.24 | 0.58 |
| 24 | Prophylaxis against Pneumocystis jirovecii and toxoplasmosis in patients with <200 CD4 lymphocytes | 754 | 38.8 | 48.5 | 100 | 0.68 | 0.46 | 1.01 |
| 31 | Losses to follow-up in the last 12 monthsa | 1325 | 68.2 | 3.9 | ≤5 | – | – | – |
| 35 | Adaptation of initial ART guidelines to the Spanish ART guidelines (GeSIDA/National AIDS Plan) | 1352 | 69.5 | 30.7 | 95 | 0.22 | 0.12 | 0.39 |
| 37 | First visit after commencement of ART | 1183 | 60.9 | 30.4 | 90 | 0.85 | 0.56 | 1.29 |
| 38 | Undetectable viral load (<50 copies/1000) in week 48 of treatment | 1115 | 57.4 | 60.1 | 80 | 0.25 | 0.16 | 0.41 |
| 40 | Treatment changes during the first year | 1509 | 77.6 | 33.1 | <30 | 1.28 | 0.89 | 1.85 |
| 42 | Study of resistance in virological failure | 129 | 6.6 | 57.4 | 90 | 0.45 | 0.18 | 1.14 |
| 50 | Assessment of patient co-infected with HCV | 427 | 22 | 35.8 | 90 | 0.26 | 0.10 | 0.70 |
| 56 | Assessment of cardiovascular risk at least once a year | 104 | 5.3 | 82.7 | 90 | 0.20 | 0.01 | 3.36 |
The univariate analysis of the quality indicators associated with admission is shown in Table 4. The indicators related to a greater risk of admission were 7 (late diagnosis of HIV in secondary care) with an OR of 2.35 (95% CI 1.89–2.94) and 40 (treatment changes during the first year) with an OR of 3.08 (95% CI 2.44–3.88). The protection indicators were: 16 (frequency of visits) OR 0.41 (95% CI 0.33–0.51); 20 (detection of latent tuberculosis infection); 21 (vaccination against hepatitis A); 22 (vaccination against hepatitis B); 31 (losses to follow-up) with an OR of 0.61 (95% CI 0.47–0.79); 35 (adaptation of initial guidelines for ART to Spanish guidelines) with an OR of 0.45 (95% CI 0.34–0.59); 38 (undetectable viral load in week 48 of treatment); 50 (evaluation of patient co-infected with HCV) and 56 (assessment of cardiovascular risk once a year).
Univariate analysis of the quality indicators associated with admission.
| No. | Name of indicator | n | Percentage (%) of patients in whom the indicator may be assessed | Percentage (%) of patients who comply with the indicator | Standard established by GeSIDA (%) | OR | 95% CI | |
|---|---|---|---|---|---|---|---|---|
| Lower limit | Upper limit | |||||||
| 7 | Late diagnosis of HIV in secondary care | 1677 | 86.3 | 26.9 | <25 | 2.35 | 1.89 | 2.94 |
| 10 | Additional tests in the initial assessment | 803 | 41.3 | 8.7 | 95 | 0.89 | 0.57 | 1.39 |
| 11 | HIV plasma viral load | 1677 | 86.3 | 75.2 | 100 | 1.06 | 0.77 | 1.45 |
| 12 | Determination of lymphocyte subpopulations (CD4) | 1677 | 86.3 | 79.3 | 100 | 1.37 | 0.91 | 2.06 |
| 15 | Indication of treatment in patients with <350 CD4 lymphocytes and without prior ART | 1103 | 56.7 | 75.7 | <10 | 1.29 | 0.76 | 2.18 |
| 16 | Frequency of visits (regular follow-up) | 1631 | 83.9 | 44.3 | 85 | 0.41 | 0.33 | 0.51 |
| 20 | Detection of latent tuberculosis infection | 1468 | 75.5 | 36.6 | 90 | 0.63 | 0.50 | 0.79 |
| 21 | Vaccination against hepatitis A | 1106 | 56.9 | 19.3 | 85 | 0.60 | 0.45 | 0.80 |
| 22 | Vaccination against hepatitis B | 764 | 39.3 | 22.1 | 85 | 0.57 | 0.41 | 0.79 |
| 23 | Vaccination against pneumococcal infection | 1604 | 82.5 | 48.4 | 85 | 1.01 | 0.81 | 1.27 |
| 24 | Prophylaxis against Pneumocystis jirovecii and toxoplasmosis in patients with <200 CD4 lymphocytes | 754 | 38.8 | 18.8 | 100 | 0.96 | 0.72 | 1.28 |
| 31 | Losses to follow-up in the last 12 monthsa | 1325 | 68.2 | 3.9 | ≤5 | – | – | – |
| 35 | Adaptation of initial ART guidelines to the Spanish ART guidelines (GeSIDA/National AIDS Plan) | 1352 | 69.5 | 21.3 | 95 | 0.45 | 0.34 | 0.59 |
| 37 | First visit after commencement of ART | 1183 | 60.9% | 18.5% | 90 | 1.19 | 0.92 | 1.55 |
| 38 | Undetectable viral load (<50 copies/1000) in week 48 of treatment | 1115 | 57.4 | 34.5 | 80 | 0.54 | 0.42 | 0.70 |
| 40 | Treatment changes during the first year | 1509 | 77.6 | 25.7 | <30 | 3.08 | 2.44 | 3.88 |
| 42 | Study of resistance in virological failure | 129 | 6.6 | 3.8 | 90 | 0.68 | 0.34 | 1.38 |
| 50 | Assessment of patient co-infected with HCV | 427 | 22 | 7.9 | 90 | 0.64 | 0.43 | 0.97 |
| 56 | Assessment of cardiovascular risk at least once a year | 104 | 5.3 | 4.4 | 90 | 0.22 | 0.05 | 0.90 |
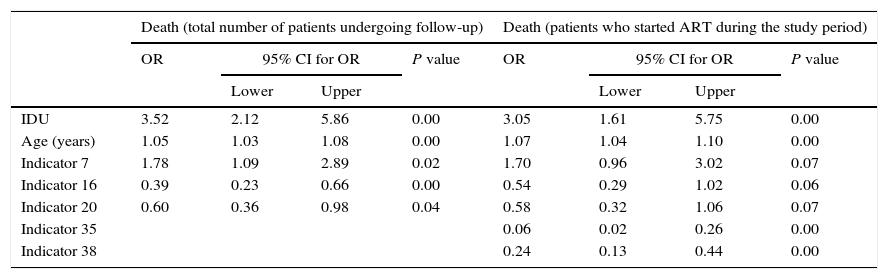
The multivariate analysis for mortality and admission, in the total number of patients undergoing follow-up and in the group of patients who started ART during the study period, is shown in Table 5. For the multivariate analysis of mortality at the start of follow-up, we have included indicators 7, 11, 12, 16 and 20. Those applicable to a small section of the population or those that were determined midway through or at the end of the study period were excluded: indicators 21, 22 and 23 (referring to vaccinations); 24 (prophylaxis against P. jirovecii); 56 (assessment of cardiovascular risk); 10 and 42 (related to conducting the primary and secondary resistance test) and 50 (evaluation of patient co-infected with HCV). In the final model and in the index of patients undergoing follow-up, indicators 7 (late diagnosis), 16 (frequency of visits) and 20 (detection of latent tuberculosis infection) were included. With regard to indicators associated with mortality in patients who started ART, we assessed indicators 7, 10, 15, 16, 20, 35, 37, 38 and 40, with indicators 7, 16 and 20 being included in the final model and in the index, together with indicators 35 (adaptation of initial guidelines for ART) and 38 (undetectable viral load in week 48 of treatment). The ROC curves corresponding to the rate calculated from the indicators associated with risk of death and admission are shown in Fig. 1. These are also separated in accordance with whether they are patients undergoing follow-up or who have started ART. The area of the ROC curve of the rate calculated for mortality for patients undergoing follow-up is 0.78 and the rate calculated only for patients undergoing ART is 0.85.
Multivariate models for death and hospital admission, for all patients and for those in whom indicators related to ART are used.
| Death (total number of patients undergoing follow-up) | Death (patients who started ART during the study period) | |||||||
|---|---|---|---|---|---|---|---|---|
| OR | 95% CI for OR | P value | OR | 95% CI for OR | P value | |||
| Lower | Upper | Lower | Upper | |||||
| IDU | 3.52 | 2.12 | 5.86 | 0.00 | 3.05 | 1.61 | 5.75 | 0.00 |
| Age (years) | 1.05 | 1.03 | 1.08 | 0.00 | 1.07 | 1.04 | 1.10 | 0.00 |
| Indicator 7 | 1.78 | 1.09 | 2.89 | 0.02 | 1.70 | 0.96 | 3.02 | 0.07 |
| Indicator 16 | 0.39 | 0.23 | 0.66 | 0.00 | 0.54 | 0.29 | 1.02 | 0.06 |
| Indicator 20 | 0.60 | 0.36 | 0.98 | 0.04 | 0.58 | 0.32 | 1.06 | 0.07 |
| Indicator 35 | 0.06 | 0.02 | 0.26 | 0.00 | ||||
| Indicator 38 | 0.24 | 0.13 | 0.44 | 0.00 | ||||
| Admission (total number of patients undergoing follow-up) | Admission (patients who started ART during the study period) | |||||||
|---|---|---|---|---|---|---|---|---|
| OR | 95% CI for OR | P value | OR | 95% CI for OR | P value | |||
| Lower | Upper | Lower | Upper | |||||
| IDU | 2.42 | 1.80 | 3.26 | <0.001 | 1.92 | 1.34 | 2.76 | 0.009 |
| Age (years) | 1.03 | 1.01 | 1.04 | <0.001 | 1.04 | 1.02 | 1.06 | <0.001 |
| Indicator 7 | 2.07 | 1.55 | 2.77 | <0.001 | 1.39 | 0.99 | 1.94 | 0.02 |
| Indicator 16 | 0.51 | 0.38 | 0.68 | <0.001 | 0.59 | 0.41 | 0.83 | <0.001 |
| Indicator 20 | 0.80 | 0.60 | 1.06 | 0.11 | 0.79 | 0.57 | 1.09 | 0.15 |
| Indicator 31 | 1.33 | 1.03 | 1.70 | 0.03 | ||||
| Indicator 35 | 0.48 | 0.34 | 0.69 | <0.001 | ||||
| Indicator 38 | 0.51 | 0.36 | 0.72 | <0.001 | ||||
| Indicator 40 | 1.80 | 1.29 | 2.49 | <0.001 | ||||
 Mortality rate for patients undergoing and not undergoing ART; (b) mortality rate for patients in whom the indicators related to ART are used; (c) hospital admission rate for patients undergoing and not undergoing ART; (d) hospital admission rate for patients in whom the indicators related to ART are used.")
ROC curves of the rates calculated for death and hospital admission. (a) Mortality rate for patients undergoing and not undergoing ART; (b) mortality rate for patients in whom the indicators related to ART are used; (c) hospital admission rate for patients undergoing and not undergoing ART; (d) hospital admission rate for patients in whom the indicators related to ART are used.
Variables 7, 11, 16, 20 and 23 were assessed to measure the association of admission with the indicators related to follow-up. The same indicators as those for the mortality rate (7, 16 and 20) were included in the model. Regarding the association of indicators at the start of ART with admission, we assessed 7, 15, 16, 20, 35, 37 and 38. The same indicators as those for the mortality rate (7, 16, 20, 35 and 38), as well as indicator 40 (changes to ART in the first year) were included in the final model. The area of the ROC curve of the rate calculated for hospital admission for patients undergoing follow-up is 0.69 and the rate calculated only for patients undergoing ART is 0.74.
DiscussionOf the quality indicators proposed and validated by GeSIDA, some seem to be obvious predictors of mortality and risk of hospital admission. In particular, indicators 7 (late diagnosis of HIV in secondary care), 16 (frequency of visits (regular follow-up)) and 20 (detection of latent tuberculosis infection) in the total number of patients undergoing follow-up are predictor indicators of mortality and admission in the multivariate analysis, adjusted for age and IDU. In patients who start ART, as well as the above-mentioned indicators, indicators 35 (adaptation of the initial ART guidelines to the GeSIDA ART Spanish guidelines) and 38 (undetectable viral load in week 48 of treatment) were also predictors of mortality and admission. In addition, indicator 40 (treatment changes during the first year) was also a predictor of admission.
The fact that the indicators identified are easily applied to most patients undergoing follow-up, and that they have been associated with both mortality and admission, means that we consider them solid parameters that need to be applied in order to provide quality health care for this type of patient.
Indicators which refer to the late diagnosis of HIV infection and to regular follow-up in secondary care have been related to both mortality and hospital admission, indicating that we are faced with two cornerstones in the care of patients with HIV infection. In this regard, in 2013, a multicentre study conducted in Spain8 and another conducted in 2007 in France9 confirmed the results obtained in our cohort, and put into objective terms the higher mortality rates in patients in the advanced clinical stage, at the start of follow-up in secondary care. In addition, in accordance with the objective data in the study conducted by Moore and Keruly,10 patients with CD4 values <350cells/μl at diagnosis did not achieve full immune recovery, with the possible consequences that this fact could have in terms of mortality and hospital admissions.
Similarly, in 2014 a multicentre study was conducted in which the importance of continued care in these patients was demonstrated, as the loss to follow-up was associated independently with an increase in all-cause mortality.11 Indicator 16 concerning regular follow-up, which involves attending a review at least every 6 months with blood tests, seems to be a good follow-up indicator and is the one that is best associated with mortality or admission.
Other indicators related to good follow-up of patients with HIV infection in consultations, such as the indicators concerning vaccination against hepatitis, pneumococcus, detection of latent tuberculosis infection and assessment of patients co-infected with HCV, were also associated with a lower mortality and need for admission in the univariate analysis.
With regard to the indicator related to the adaptation of the ART guidelines to the current GeSIDA guidelines, our study confirmed the results of the Spanish multicentre study conducted in 2013, which put into objective terms an increase in mortality in the event of failing to comply with the indicator.12 To some extent, this indicator reflects the importance of patients with HIV infection being attended to by specialist healthcare personnel, and keeping up to date with ART.
Another piece of data to highlight from the results of our study is the impact that both age and the use of drugs through injection has on mortality and hospital admissions. There are numerous bibliographic references that relate the use of drugs through injection with a poorer prognosis in these patients, whether they are associated directly with an increase in mortality13 or to other factors that may also contribute to a more unfavourable prognosis, such as a poorer immune10 and virological response, lower rates of treatment adherence, need for dosage adjustment of drugs due to concomitant treatment with methadone or a greater risk of pharmacological toxicity due to overdose, intercurrent infections or co-infection with other hepatotropic viruses.13
As in our study, the correlation of age with a later diagnosis, increased mortality and an increase in hospital admissions9 was observed. The study conducted by Lanoy et al. in 2007 describes a longer diagnostic delay in patients over 60 years of age, with a resultant increase in mortality.9 The study by Moore and Keruly in 200910 describes a poorer immune response in these patients, despite better adherence and virological response. Some studies have observed that smoking and the presence of other comorbidities, such as COPD, diabetes mellitus or HTN are variables which are not related to HIV infection, but that are associated with hospital admissions in these patients, observing that in recent years there has been an increase in the number of admissions due to cardiovascular, respiratory and renal causes.6,7
The use of indicators 7, 16 and 20 in patients undergoing follow-up, along with age and the status of being an IDU makes it possible to create a predictive rate of mortality and admission with some more than acceptable ROC curves. ROC curves improve if we consider only patients who started ART in the follow-up period, and if we take into account indicators related to the adaptation of ART and virological response. This group of patients is probably more homogeneous, which explains these improved results.
In 2012, the British Columbia Centre for Excellence in HIV/AIDS in Vancouver developed and validated the Programmatic Compliance Score as a predictor of mortality in patients who started antiretroviral therapy during the study period.3 In 2013, we used this same score with patients who started antiretroviral therapy in Hospital Son Espases between 1 January 2000 and 1 June 2013, obtaining similar results to those in the Canadian cohort.14 Similar areas under the curve were observed when comparing the AUROC with this score or the score obtained with the GESIDA indicators.
It is worth stressing that the database used to conduct this study was designed for the specific management of patients with HIV infection. It was updated at each visit or hospital admission and was monitored by quality controls periodically. Furthermore, taking into account that the follow-up period was 12 years, we believe that the number of patients lost represents a low annual percentage.
Despite having access to the database, there were some limitations in the collection of variables, as this tool was not specific for the study of these indicators and the retrospective collection made it difficult to collect them. We have adjusted the indicators only for age and history of IDU (as we did not have an active use variable). The indicators have not been adjusted for other variables potentially related to mortality or admission, such as smoking, co-infection with HCV or other comorbidities. The obtaining of any indicator such as 10, referring to additional examinations requested at the first visit, is complicated and should be re-assessed. Some determinations, such as primary resistance, were carried out systematically from 2005. The assessment of cardiovascular risk in 2011 and some of the indicators, such as vaccinations, are not applicable to all patients. Only admissions to the Hospital Son Dureta/Son Espases were recorded, and some of the patients could have been admitted to other hospital centres, but the percentage of patients admitted is similar to that of other cohorts.7
The usefulness of these quality indicators as predictors of mortality and admission would require validation in a second, larger cohort and an assessment to determine if the indicators for the calculation of the risk rate should be weighted.
In conclusion, it has been possible to identify several care quality indicators which may be related to hospital admission and mortality. The indicators selected refer fundamentally to a delayed diagnosis, to regular follow-up of patients, to the prevention of infections and the control of comorbidities. Controlling the viral load and indicators related to the adaptation of the ART initial guidelines are also important in patients who start treatment. All these quality indicators should be considered a priority in the health care of patients with HIV infection.
Conflicts of interestThe authors declare that there are no conflicts of interest.
Please cite this article as: Delgado-Mejía E, Frontera-Juan G, Murillas-Angoiti J, Campins-Roselló AA, Gil-Alonso L, Peñaranda-Vera M, et al. Indicadores de calidad asistencial de GeSIDA para la atención de personas infectadas por el VIH/sida asociados a mortalidad e ingreso hospitalario. Enferm Infecc Microbiol Clin. 2017;35:67–75.
