


To determine the first manifestation of cardiovascular or kidney disease (CVKD) and associated resource use in type 2 diabetes mellitus (T2DM) patients during seven years of follow-up.
MethodsObservational-retrospective secondary data study using medical records of patients aged ≥18 years with T2DM and without prior CVKD between 2013 and 2019. The index date was 01/01/2013 (fixed date). The manifestation of CVKD was defined by the first diagnosis of heart-failure (HF), chronic-kidney disease (CKD), myocardial-infarction (MI), stroke or peripheral-artery disease (PAD). The main variables were baseline characteristics, manifestation of CVKD, mortality, resource use and costs. Descriptive analyses and Cox model were applied to the data.
Results26,542 patients were selected (mean age: 66.6 years, women: 47.8%, mean duration of T2DM: 17.1 years). 18.7% (N=4974) developed a first CVKD manifestation during the seven years [distribution: HF (22.4%), CKD (36.6%), MI (14.5%), stroke (15.3%) and PAD (11.3%)]. Overall mortality was 8.3% (N=2214). The mortality risk of the group that developed HF or CKD as the first manifestation compared to the CVKD-free cohort was higher [HR: 2.5 (95% CI: 1.8–3.4) and 1.8 (95% CI: 1.4–2.3)], respectively. The cumulative costs per patient of HF (€50,942.80) and CKD (€48,979.20) were higher than MI (€47,343.20) and stroke (€47,070.30) and similar to PAD (€51,240.00) vs. €13,098.90 in patients who did not develop CVKD, p<0.001.
ConclusionsIn T2DM patients, HF and CKD were the first most common manifestations and had higher mortality and re-hospitalisation rates. HF and CKD were associated with the highest resource use and costs for the Spanish National-Health-System.
Determinar la primera manifestación de enfermedad cardiovascular o renal (ECVR) y el uso de los recursos asociados en pacientes con diabetes mellitus tipo 2 (DM2) durante siete años de seguimiento.
MétodosEstudio observacional-retrospectivo utilizando historias clínicas con datos secundarios de pacientes ≥ 18 años con DM2 y sin ECVR previa, entre 2013 y 2019. La fecha índice fue el 01/01/2013 (fecha fija). La manifestación de ECV se definió como el primer diagnóstico de insuficiencia cardíaca (IC), enfermedad renal crónica (ERC), infarto de miocardio (IM), ictus o enfermedad arterial periférica (EAP). Las variables principales fueron: las características basales, la manifestación de ECVR, la mortalidad, el uso de los recursos y costes. Los datos se proporcionaron mediante análisis descriptivos y modelos de Cox.
ResultadosSe seleccionaron 26.542 pacientes (edad media: 66,6 años, mujeres: 47,8%, duración media de la DM2: 17,1 años). El 18,7% (N = 4.974) desarrolló una primera manifestación de ECVR durante los siete años [distribución: IC (22,4%), ERC (36,6%), IM (14,5%), ictus (15,3%) y EAP (11,3%)]. La mortalidad global fue del 8,3% (N = 2.214). El riesgo de mortalidad del grupo que desarrolló como primera manifestación IC o ERC, en comparación con la cohorte libre de ECVR, fue mayor [HR: 2,5 (IC 95%: 1,8-3,4) y 1,8 (IC 95%: 1,4-2,3)], respectivamente. Los costes acumulados por paciente de IC (50.942,80 EUR) y ERC (48.979,20 EUR) fueron superiores al IM (47.343,20 EUR) e ictus (47.070,30 EUR), y similares a la EAP (51.240,00 EUR) frente a los 13.098,90 EUR de los pacientes que no desarrollaron ECVR, p < 0,001.
ConclusionesEn los pacientes con DM2, la IC y la ERC fueron las primeras manifestaciones más frecuentes y presentaron una mayor mortalidad y reingresos. La IC y la ERC se asociaron con un mayor uso de recursos y costes para el Sistema Nacional de Salud español.
Type 2 diabetes mellitus (T2DM) is a disease with a large social and health impact due to its high prevalence, the chronic macro and microvascular complications, and, mainly, due to cardiovascular manifestations.1,2 The prevalence is about 6–10% in the general population3 and is estimated to be 13.8% in Spain.4 Around 11.3% of all-cause deaths are associated with diabetes, and half these deaths occur in persons aged<60 years.5
A diagnosis of T2DM is often accompanied by heart failure (HF, 13–47%), chronic kidney disease (CKD, 30–40%) or both, in a high proportion of patients.2 In fact, HF is more frequent, earlier, more recurrent and has a worse prognosis in people with diabetes than ischaemic heart disease.6,7 It has recently been reported that a diagnosis of HF at any time after the diagnosis of diabetes is associated with the highest risk of relative and absolute mortality at five years, and with a decrease in life expectancy at five years, when compared with any other cardiovascular or renal diagnosis.8
In T2DM, myocardial involvement presents very early and it is not easily recognised by usual tests. Up to two-thirds of patients present systolic and/or diastolic dysfunction within a few years of diagnosis9 and even when cardiovascular risk factors (blood glucose, blood pressure, cholesterol, smoking, albuminuria) are controlled, the incidence of HF is not reduced, unlike that of ischaemic heart disease or stroke.10
The onset of CKD is a determining factor in the increased risk of HF.10 Through a series of complex mechanisms (confluence of haemodynamic, neurohormonal and inflammatory interactions), the heart and kidney are intimately connected and contribute to the onset of HF. When presented together, they create a disorder known as cardiorenal syndrome.11-13 Cardiovascular and renal disease (CVKD) in T2DM is a significant source of morbidity and contributes to continuing increases in health expenditure.6 Real-life data show that, in patients with T2DM, cardiorenal events (HF or CKD) are the most common first manifestation of cardiovascular disease (four times more frequent than stroke and myocardial infarction (MI) and six times more frequent than peripheral artery disease (PAD), and are associated with a high risk of mortality and other cardiovascular risks.
In Spain, there is little evidence on the type and time to the first manifestation of CVKD after diagnosis of T2DM and subsequent impact on health resource use in usual clinical practice.14 The aim of this study was to determine the first manifestation requiring hospital admission due to a CVKD manifestation in initially CVKD-free T2DM patients during a seven-year follow-up and to quantify the use of health and non-health related resources and costs in these patients.
Patients and methodsDesign and study populationThis was a retrospective, observational study based on electronic medical records from the BIG-PAC15 administrative database (secondary data source; owner: Atrys Health-RLD) which includes 1.8 million patients (http://www.encepp.eu/encepp/viewResource.htm?id=29236#). Primary data came from the computerised medical records of seven integrated Spanish public healthcare areas (primary care centres and hospitals) from seven Spanish Autonomous Communities. Before exporting to the BIG-PAC database15 all electronic records were rigorously anonymised by the centres/hospitals of origin, in compliance with Organic Law 3/2018, of December 5, on the Protection of Personal Data and Guarantee of Digital Rights (https://www.boe.es/doue/2016/119/L00001-00088.pdf). Atrys Health-RLD has no access to primary data sources.
Study population and follow-upAll patients with a diagnosis of T2DM (CIE-09-MC: 250) and without prior CVKD on 1 January 2013 (fixed index date) were selected. During the seven-year follow-up (2013–2019), the first CVKD manifestation (a diagnosis of HF, CKD, MI, stroke, or PAD) with hospital admission was evaluated and the percentage of new cases, or cumulative incidence, was determined. Angina and transient ischaemic accident were not counted as CVKD during the follow-up. In addition, all-cause mortality was determined. Codes for CVD and CKD were as follows: HF (428, 404.90), CKD (583–585), acute MI (410, 412), unstable angina (411), stroke (430–432, 433–434, 436) and PAD (440–441, 444).
Inclusion and exclusion criteriaInclusion criteria were: (a) age ≥18 years, (b) presence of diagnosis code for T2DM or prescription fill for antidiabetic drug (oral or injectable glucose lowering medication), (c) patients active in the database for ≥12 months before study inclusion, (d) inclusion in the prescription programme (≥2 prescriptions during follow-up), (e) regular monitoring of patients (≥2 health records in the computer system) and (f) without CVKD on or before the index date. Exclusion criteria were (a) patients displaced or out of area, (b) permanently institutionalised (geriatric residences), and (c) patients with severe mental illness or terminal illness.
Other variables of interestDemographic variables, comorbidities, biochemical/anthropometric parameters, and baseline treatment were obtained (Table 1). Medication was obtained according to records from the pharmacological dispensing of medicinal products according to the Anatomical Therapeutic Chemical Classification System (ATC).16 The choice of drug in a specific patient was at the discretion of the physician (clinical practice).
Baseline characteristics.
| Description | Group who stayed CVKD-free during follow-up* | Group who developed CVKD during follow-up | Total | p | OR (95% CI) |
|---|---|---|---|---|---|
| N (%) | 21,568 (81.3%) | 4974 (18.7%) | 26,542 (100%) | ||
| Clinical characteristics | |||||
| Age, mean (SD) | 65.7 (12.1) | 70.8 (11.7) | 66.6 (12.2) | <0.001 | 1.02 (1.01–1.04)† |
| Gender, n (%); female | 10,088 (46.8%) | 2600 (52.3%) | 12,688 (47.8%) | <0.001 | |
| Diabetes duration (years) | 16.1 (15.2) | 21.6 (19.5) | 17.1 (16.2) | <0.001 | 1.03 (1.01–1.05)* |
| BMI (kg/m2) | 28.5 (4.5) | 28.1 (4.3) | 28.4 (4.5) | 0.524 | |
| Comorbidities, n (%) | |||||
| Hypertension | 10,698 (49.6%) | 4288 (86.2%) | 14,986 (56.5%) | <0.001 | 4.81 (3.58–6.46)‡ |
| Hyperlipidaemia | 9958 (46.2%) | 4168 (83.8%) | 14,126 (53.2%) | <0.001 | 3.89 (2.91–5.21)‡ |
| Smoking status, n (%) | 1910 (8.9%) | 508 (10.2%) | 2418 (9.1%) | <0.001 | 4.25 (3.44–5.26)‡ |
| Clinical tests, mean (SD) | |||||
| HbA1c | 7.0 (1.4) | 7.1 (1.3) | 7.1 (1.4) | 0.002 | 1.05 (1.01–1.09)† |
| eGFR (mL/min/1.73m2) | 83.5 (16.2) | 79.9 (16.2) | 82.9 (16.3) | <0.001 | 0.96 (0.95–0.98)* |
| SBP (mmHg) | 137.9 (19.4) | 139.2 (19.5) | 138.1 (19.4) | <0.001 | |
| DBP (mmHg) | 80.4 (11.3) | 79.7 (11.5) | 80.3 (11.3) | 0.121 | |
| HDL (mg/dL) | 49.6 (11.2) | 49.9 (11.2) | 49.6 (11.2) | 0.687 | |
| LDL (mg/dL) | 112.1 (32.8) | 110.1 (32.0) | 111.8 (32.6) | 0.001 | |
| Triglycerides (mg/dL) | 172.3 (123.7) | 169.1 (111.6) | 171.8 (121.7) | <0.001 | |
| Albumin (g/dL) | 4.8 (1.0) | 4.7 (0.9) | 4.8 (9.5) | 0.198 | |
| Creatinine (mg/dL) | 0.8 (0.2) | 0.8 (0.3) | 0.8 (0.2) | 0.746 | |
| Medication | |||||
| CVD risk treatment. n (%) | 17,492 (81.1%) | 4330 (87.1%) | 21,822 (82.2%) | <0.001 | |
| Lipid lowering drugs | 9738 (45.2%) | 2226 (44.8%) | 13,536 (51.1%) | 0.021 | 1.25 (1.01–1.55)* |
| Antihypertensives. n (%) | 13,880 (64.4%) | 3858 (77.6%) | 17,738 (66.8%) | <0.001 | |
| Anticoagulant/antiplatelet | 3450 (16.0%) | 670 (13.5%) | 5255 (19.8%) | <0.001 | |
| Glucose lowering drugs, n (%) | 18,444 (85.5%) | 4064 (81.7%) | 22,508 (84.8%) | <0.001 | |
| Metformin | 14,664 (68.0%) | 3106 (62.4%) | 17,770 (67.0%) | <0.001 | |
| SU | 7092 (32.9%) | 1454 (29.2%) | 8546 (32.2%) | <0.001 | |
| DPP-4 inhibitors | 5028 (23.3%) | 1050 (21.1%) | 6078 (22.9%) | <0.001 | |
| GLP-1 RA | 354 (1.6%) | 20 (0.4%) | 374 (1.4%) | <0.001 | |
| Meglitinides | 552 (2.6%) | 530 (10.7%) | 1082 (4.1%) | <0.001 | |
| Glitazones | 184 (0.9%) | 38 (0.8%) | 222 (0.8%) | 0.469 | |
| Acarbose (miglitol) | 248 (1.1%) | 68 (1.4%) | 316 (1.2%) | 0.183 | |
| Insulin | 4388 (20.3%) | 770 (15.5%) | 5158 (19.4%) | <0.001 | |
CVKD: cardiovascular or kidney disease (heart failure, kidney disease, myocardial infarction, stroke, peripheral artery disease); * includes angina and transient ischaemic accident. BMI: body mass index; HbA1c: glycated haemoglobin; eGFR: estimated glomerular filtration rate; SBP: systolic blood pressure; DBP: diastolic blood pressure; HDL: high-density lipoprotein; LDL: low-density lipoprotein; SU: sulfonylureas; GLP-1 RA: glucagon-like peptide-1 receptor agonists; DPP-4: inhibitors of dipeptidyl peptidase 4; OR: odds ratio (logistic regression; statistician: Wald; method: consecutive steps by blocks); CI: confidence intervals.
Significance
We analysed: (a) direct healthcare costs, defined as costs related to care (primary care medical visits, specialist visits, days of hospitalisation (hospital admissions), hospital emergency department admissions, diagnostic or therapeutic requests and medication; and (b) indirect costs, defined as days of productivity lost due to disability. Costs were expressed as the mean cost per patient and absolute cumulative cost. Rates were obtained from hospital accounting, except for the costs of medication and indirect costs (Table S1). Medical prescriptions were quantified according to the retail price per package at the time of dispensing (according to the General Council of Official Pharmacists’ Colleges of Spain (https://botplusweb.portalfarma.com). Indirect costs were considered as days of lost productivity due to disability according to the mean interprofessional wage (source: NEI).17 Use of resources and costs were calculated only for cardiovascular or renal disease. Total costs were obtained for the first manifestation of CVKD and for each subsequent hospitalisation due to CVKD.
Confidentiality of information/ethical aspectsConfidentiality of the anonymous records was respected in accordance with the Organic Law on the Protection of Personal Data. The study was classified and approved by local regulatory authorities and a Research Ethics Committee.
Statistical analysisThe presented data were initially validated to ensure the quality of the results. A descriptive, univariate analysis of the variables of interest was made. Qualitative data were expressed as absolute and relative frequencies and quantitative data as means and standard deviation (SD). The 95% ratios and confidence intervals (CI) were analysed according to the total number of subjects with non-missing values. A bivariate analysis was made using the Chi-square test and the ANOVA test for independent groups. A Cox proportional risk model was constructed to estimate the time-to-first manifestation and the mortality risk according to the different CVKD. The dependent variable was time (manifestation or death) and the covariates (confounding factors) were age, sex, and time from diagnosis (procedure: enter; method: maximum likelihood 2).
A logistic regression model (statistic: Wald) was established. The dependent variable was the presence of CVKD during follow-up. The covariates of the model were included according to the method of consecutive steps by blocks; block 1: age, gender, diabetes duration, BMI, hypertension, hyperlipidaemia and smoking; block 2: clinical tests; and block 3: medication. The final model was established with the variables that were statistically significant in each block. A value of p<0.05 was considered statistically significant. The analysis was made using the SPSSWIN version 23 statistical programme.
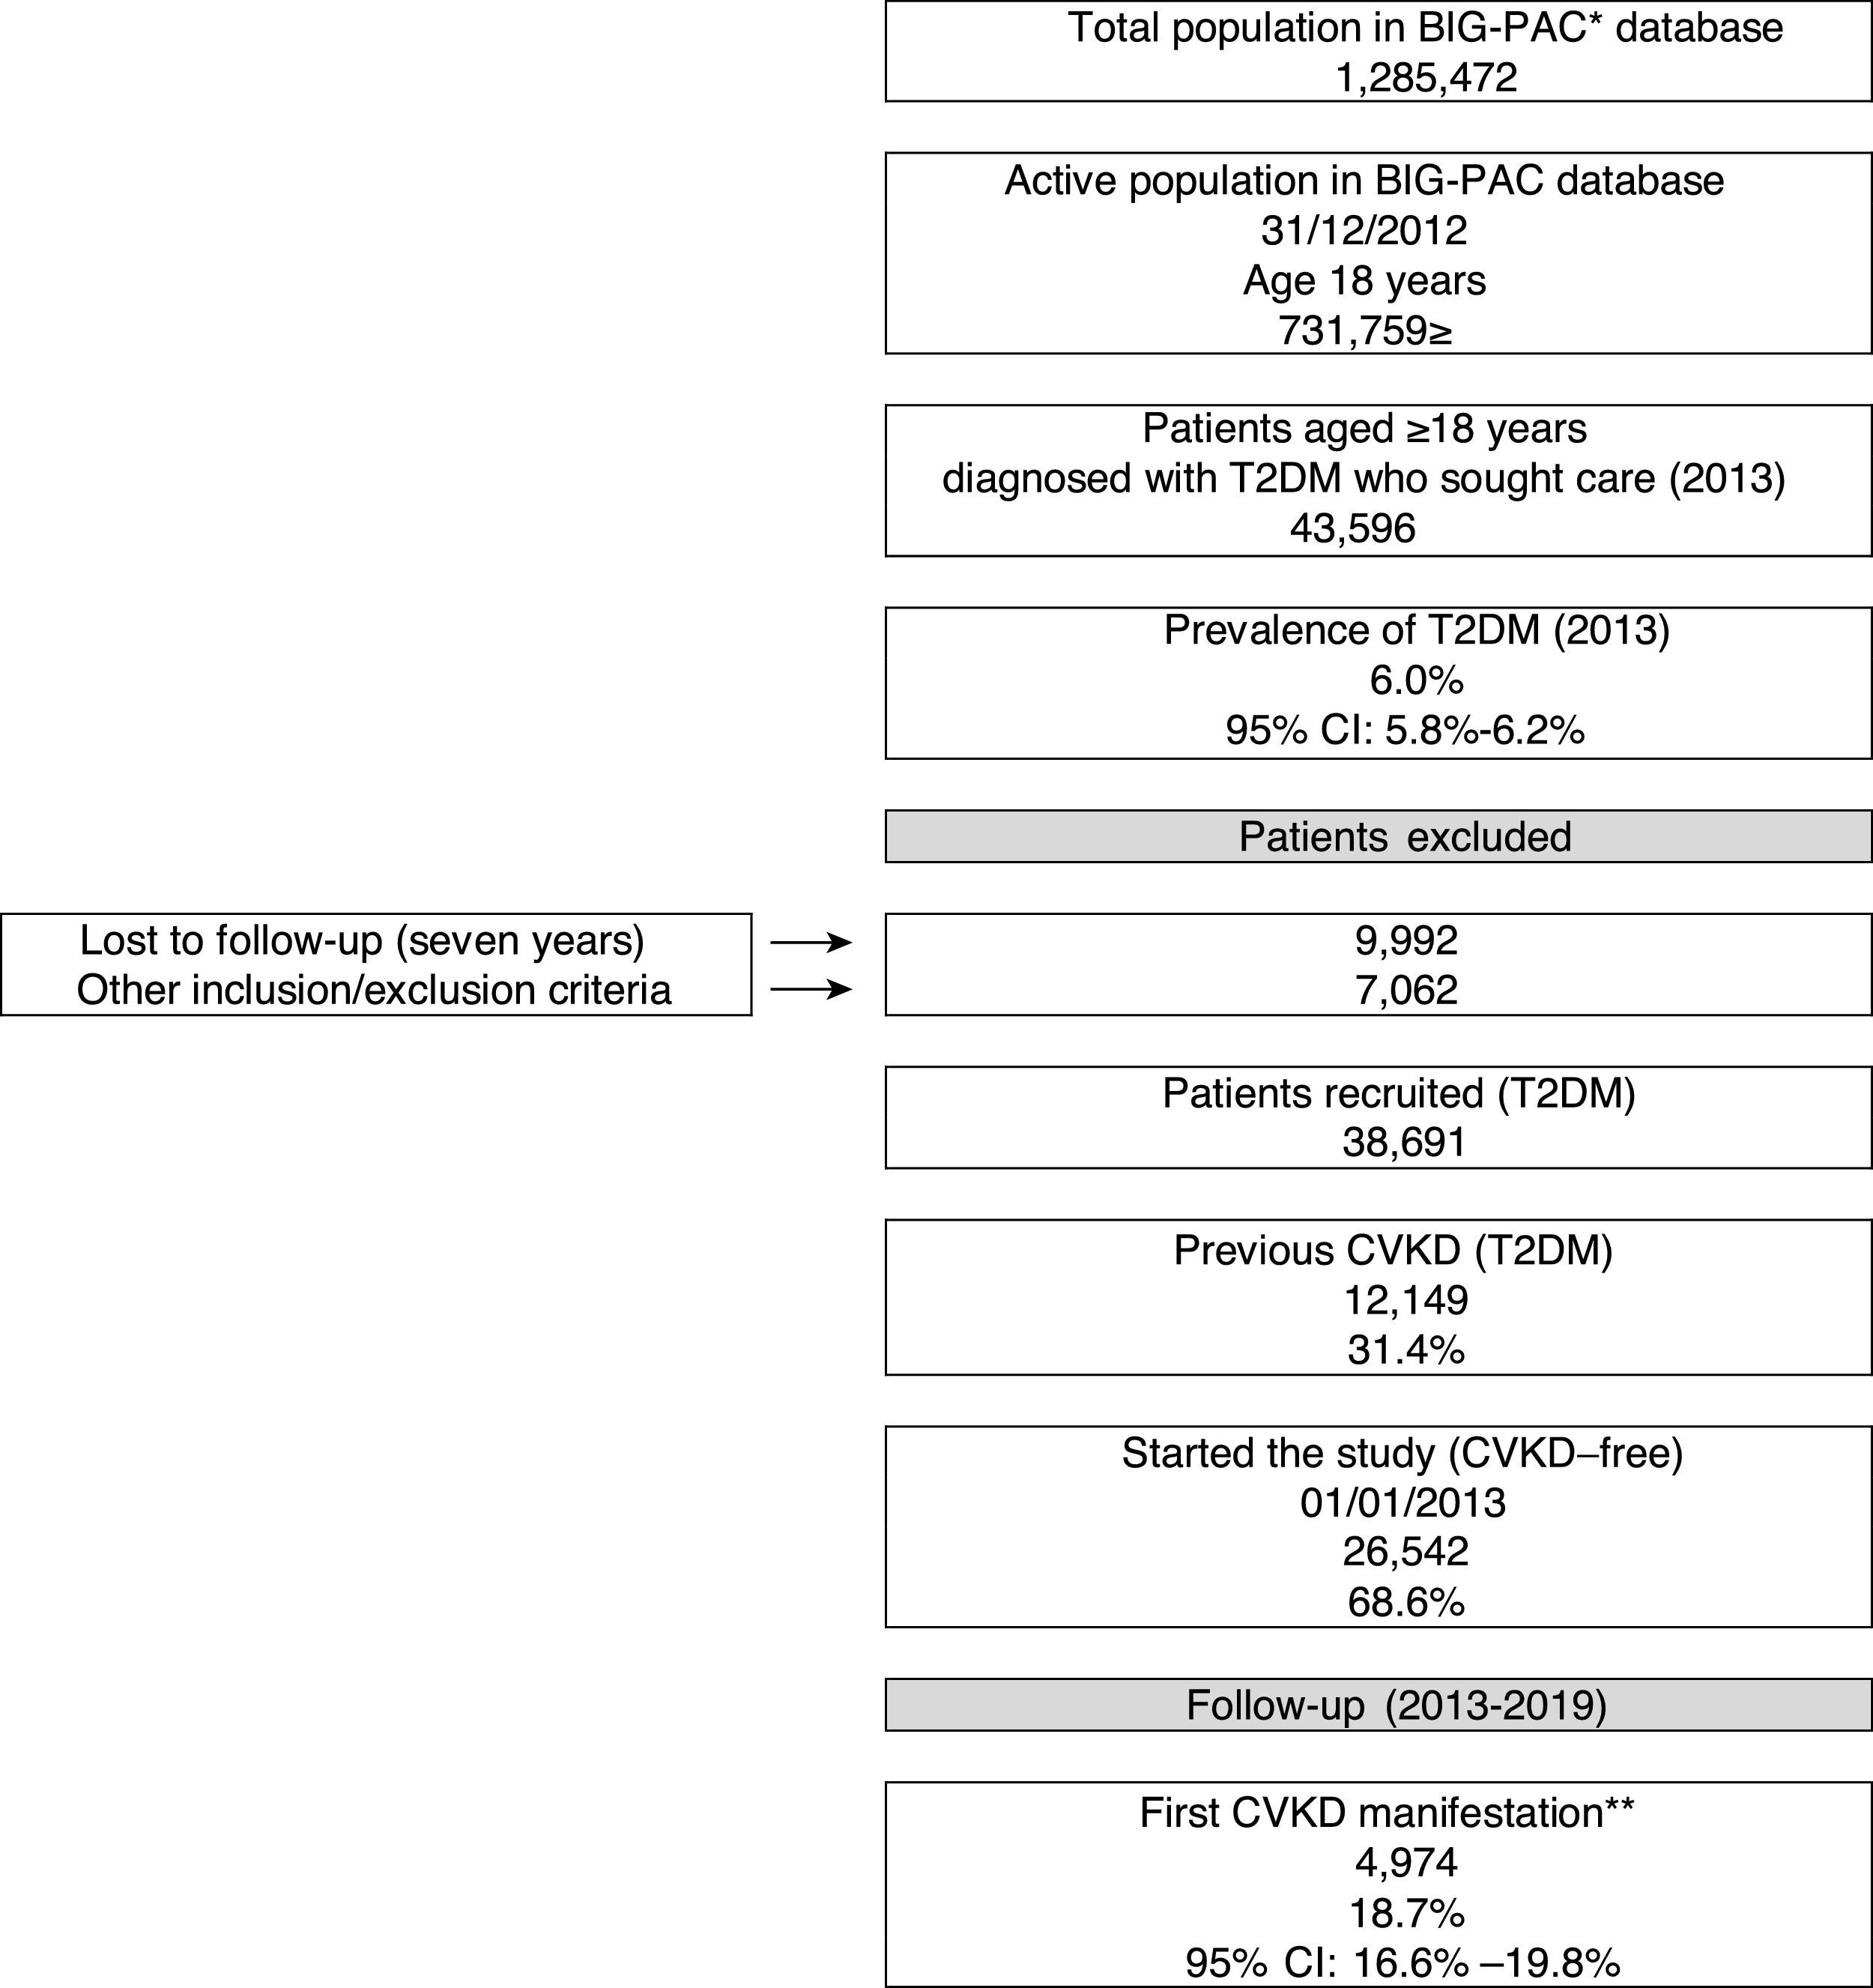
ResultsBaseline characteristicsOf an initial population of 731,759 patients aged ≥18 years on index date 01/01/2013, 43,596 had a diagnosis of T2DM (prevalence in the population attended: 6%; 95%CI: 5.8–6.2%). Of the 38,691 T2DM patients who met the inclusion/exclusion criteria on the index date, 31.4% (N=12,149) had prior CVKD and were excluded from the study population, while 68.6% (N=26,542) were free from CVKD and were selected for the study (Fig. 1). Table 1 shows baseline participant characteristics. The mean age was 66.6 years (70.7% aged ≥65 years), 47.8% were female and the mean duration of T2DM was 17.1 years. Hypertension (56.5%) and dyslipidaemia (53.2%) were the most frequent comorbidities.
. CVKD: cardiovascular or kidney disease (heart failure, kidney disease, myocardial infarction, stroke, peripheral artery disease). *Database, ** excludes angina and transient ischaemic accident. DM: type 2 diabetes mellitus CVD: cardiovascular disease. CI: confidence interval.")
Study flow chart (2013–2019). CVKD: cardiovascular or kidney disease (heart failure, kidney disease, myocardial infarction, stroke, peripheral artery disease). *Database, ** excludes angina and transient ischaemic accident. DM: type 2 diabetes mellitus
CVD: cardiovascular disease. CI: confidence interval.
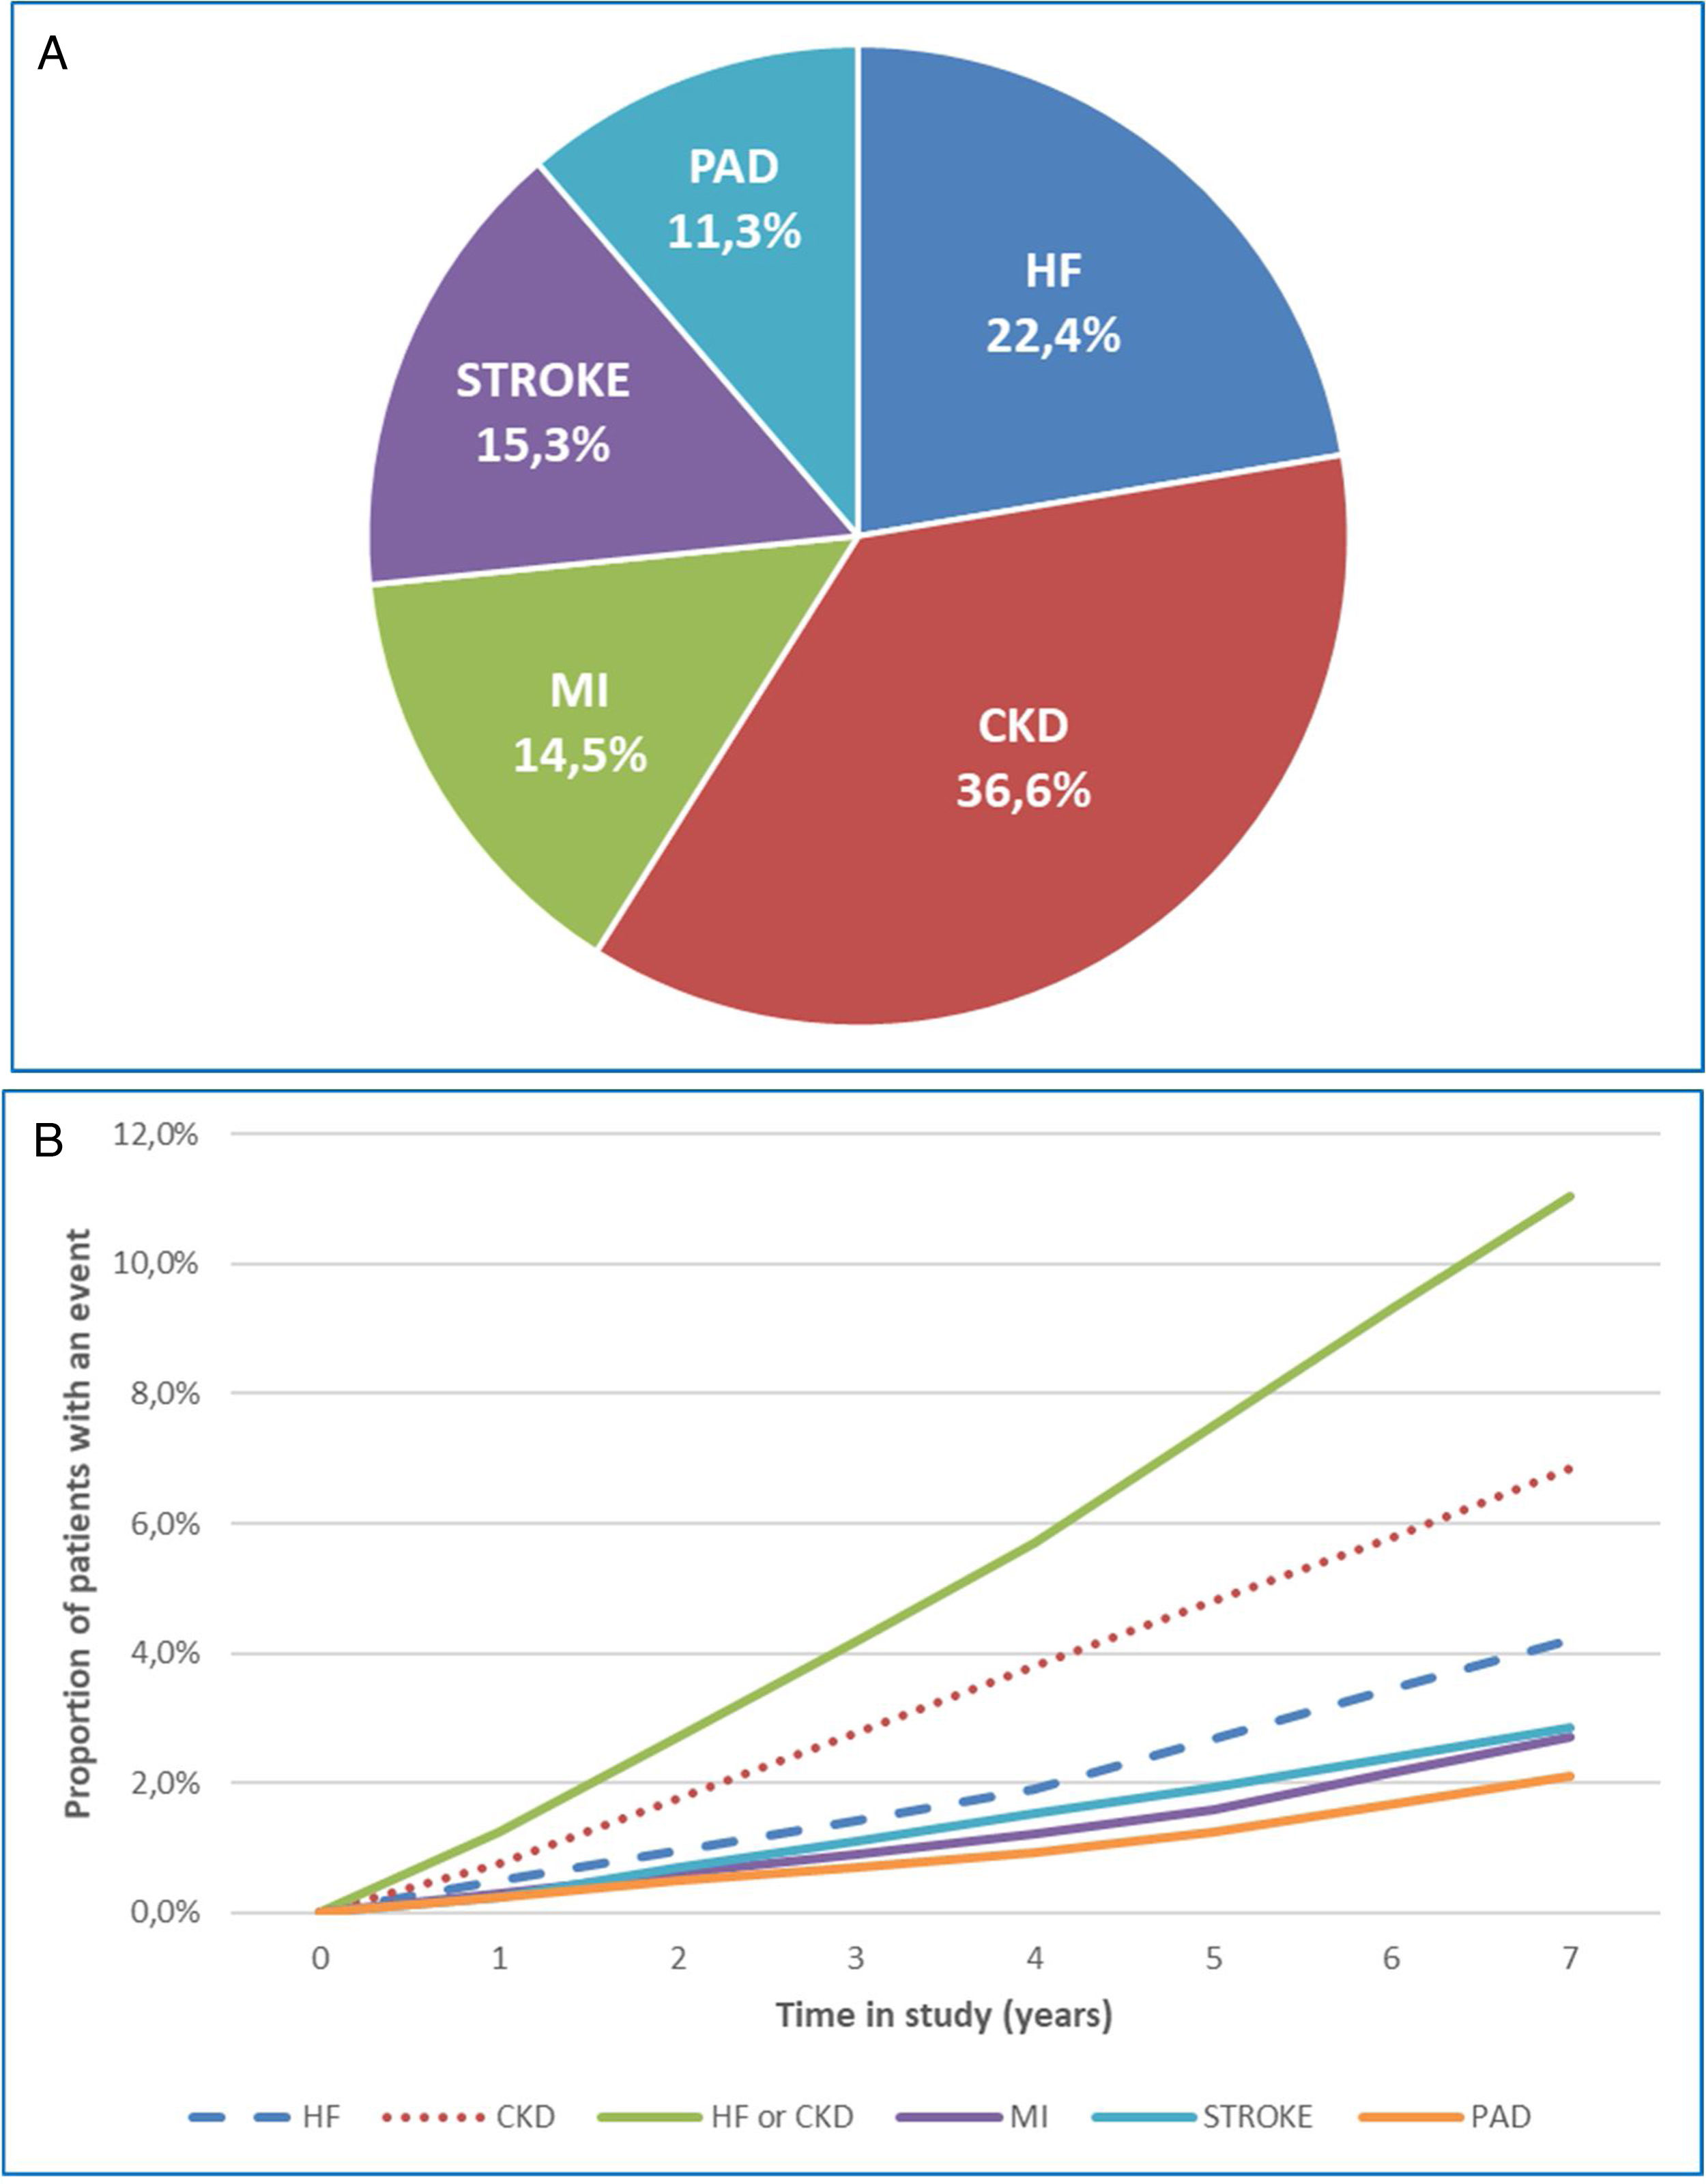
A total of 4974 (18.7%) patients developed a first CVKD manifestation during the seven-year follow-up (Fig. 1). The percentage of events/manifestations was: HF (N=1112; 22.4%), CKD (N=1820; 36.6%), MI (N=720; 14.5%), stroke (N=760; 15.3%) and PAD (N=562; 11.3%) (Fig. 2A). The mean time to the first manifestation was HF 0.52 years (median: 0.56), CKD 0.53 years (median: 0.54), MI 0.57 years (median. 0.58), stroke 0.58 years (median: 0.63) and PAD 0.57 years (median: 0.64), respectively. The number of patients who had any CVKD as first manifestation increased over the seven years of follow-up (2013=536, 2014=658, 2015=622, 2016=676, 2017=757, 2018=850 and 2019=875 patients; p<0.001) (Fig. 2B).
. N=4974. HF: heart failure; CKD: chronic kidney disease; MI: myocardial infarction; PAD: peripheral artery disease.")
The cumulative incidence rates of HF, CKD, MI, stroke, and PAD were 51.6, 84.4, 33.4, 35.2 and 26.1 new events per 1000 patient/years, respectively. Mortality rates were 10.6, 16.9, 5.4, 6.4 and 3.5 deaths per 1000 patient-years, respectively.
Fig. S1 shows the percentage of patients who had additional CVKD events/diagnoses different from the first event/diagnosis. Patients with HF or CKD as the first event had the greatest number of events due to other CVKD. In fact, in these two groups, 10% of the patients had three or more additional events/diagnoses different from the first one (HF, CKD, MI, stroke and/or PAD; Fig. S1).
Patients who had HF or CKD as first CVKD manifestation had an increased mortality risk vs. those patients who stayed CVKD free (HF; HR: 2.5; 95% CI: 1.8–3.4; CKD; HR: 1.8; 95% CI: 1.4–2.3). This risk was higher than that in patients who had MI (HR: 1.6; 95% CI: 1.1–2.3), stroke (HR: 1.5; 95% CI: 1.0–2.1) or PAD (HR: 1.2; 95% CI: 0.8–1.9) as their first CVKD manifestation. Additionally, the risk of having HF or CKD as the first event was higher than that of having MI, stroke or PAD (HR: 2.1: 95% CI: 1.8–2.4).
Overall mortality was 8.3% (N=2214) and was more common in patients who developed HF (N=280 patients; 25.2% mortality; median [time]: 666 days) and/or CKD (N=451; 24.8%; median: 811 days) as the first CVKD manifestation than in those with MI (N=143; 19.8%; 1099 days) stroke (N=169; 22.3%; 1074 days) and PAD (N=93; 16.5%; 1184 days). Mortality was lower in patients who remained without CVKD (N=1079; 5%; 1259 days).
HF and CKD were associated with a higher frequency of hospitalisations than classic CV complications (MI, stroke, or PAD). Days of occupational disability were low, as might be expected, since the mean patient age was ≥65 years (Table S2).
There were important baseline differences between patients who remained without CVKD compared with those who developed any CVKD manifestation during the follow-up (Table 1). Patients without CVKD were younger (65.7 vs. 70.8 years; p<0.001), with fewer comorbidities (hypertension: 49.6% vs. 86.2%, p<0.001; hyperlipidaemia: 46.2% vs. 83.8%, p<0.001), better preserved kidney function (eGFR: 83.5 vs. 79.9mL/min/1.73m2; p<0.001), greater use of antidiabetic agents (85.5% vs. 81.7%; p<0.001) and better glycaemic control (HbA1c: 7.0% vs. 7.1%; p=0.002). The variables resulting from the logistic regression model are detailed in Table 1. There was no evidence of additive or multiplicative interaction effects between the final variables analysed.
Use of resources in CVKDTotal healthcare and indirect related costs for the population studied during the seven-year follow-up were € 527 million, of which 96.0% were for direct healthcare costs and 4.0% for indirect costs. The main cost components were hospital admissions (39%), cardiovascular and antidiabetic medication (19%), specialist visits (14%) and primary care visits (13%) (Table 2). According to the first manifestation of CVKD the mean cost per patient was HF: € 50,943, CKD: € 48,979, MI: € 47,343, stroke: € 47,070 and PAD: € 51,240. The mean cost in patients without CVKD was € 13,099 (Table 2).
Costs per patient during the follow-up period (2013 –2019) according to first cardiorenal manifestation in Euros.
| Description | Group who stayed CVKD-free during follow-up* | HF | CKD | MI | Stroke | PAD |
|---|---|---|---|---|---|---|
| N (%) | 21,568 (81.3%) | 1112 (4.2%) | 1820 (6.9%) | 720 (2.7%) | 760 (2.9%) | 562 (2.1%) |
| Primary care visits | 2533.4 (2025.7) | 2439.8 (1998.9) | 2529.6 (2241.8) | 1941.4 (1763.4) | 2473.4 (1943.6) | 2531.9 (2028.1) |
| Laboratory requests | 419.7 (278.1) | 398 (273.2) | 391.1 (291.9) | 310 (252.8) | 402.6 (251.9) | 408.2 (283.9) |
| Radiology requests | 139.3 (69.5) | 119.7 (65.9) | 130.6 (70.5) | 181 (61.4) | 149.9 (68.9) | 166.6 (54.6) |
| Computed tomographies | 380.4 (174.8) | 334.1 (161.6) | 385.3 (186.9) | 572.5 (114) | 398.7 (167.5) | 364.5 (162.7) |
| Magnetic nuclear resonance | 682.7 (171.4) | 682.5 (159) | 708.8 (168.3) | 710.5 (196.5) | 645.1 (166.8) | 543.6 (165.3) |
| Other tests | 229.4 (200.6) | 218.9 (186.9) | 208.4 (214.2) | 144.7 (183.2) | 186.7 (194.3) | 228.3 (217.4) |
| Specialised visits | 2896 (1900.2) | 2939 (2158.1) | 2872.1 (2073) | 2156.7 (1713) | 2753.4 (1922.8) | 2623.8 (1863.3) |
| Emergency dept. visits | 1372.3 (417.5) | 1462.9 (386.9) | 1460.2 (418.2) | 1457.6 (417.6) | 1366.2 (327.8) | 1252.1 (348.1) |
| Hospitalisation, days | 686.1 (2201.9) | 39,608.5 (23,081.7) | 37,220.6 (23,210.7) | 37,740 (26,722.1) | 35,749.9 (28,596.7) | 39,875.3 (24,077.4) |
| Cardiovascular medication | 812.2 (1127.1) | 715 (874.9) | 768.7 (1049.6) | 557.3 (787.1) | 790 (1087.5) | 869.3 (1001.2) |
| Antidiabetic medication | 2200 (3232.7) | 1480 (2748.5) | 1751.7 (2887) | 1175.9 (2207.9) | 1723.3 (2632.2) | 1766.3 (2984) |
| Health costs | 12,351.5 (6299.3) | 50,398.5 (24,064.9) | 48,427 (23,569.9) | 46,947.4 (27,112.1) | 46,639 (29,748.5) | 50,629.9 (25,131.1) |
| Indirect costs (disability) | 747.4 (3235.7) | 544.3 (2593.9) | 552.2 (2879.1) | 395.8 (2056.5) | 431.2 (1599.2) | 610.1 (2179.5) |
| Total cost | 13,098.9 (7309.5) | 50,942.8 (24,327.7) | 48,979.2 (23,666.3) | 47,343.2 (27,269.9) | 47,070.3 (29,846.3) | 51,240 (25,183.2) |
CVKD: cardiovascular or kidney disease (heart failure, kidney disease, myocardial infarction, stroke, peripheral artery disease).
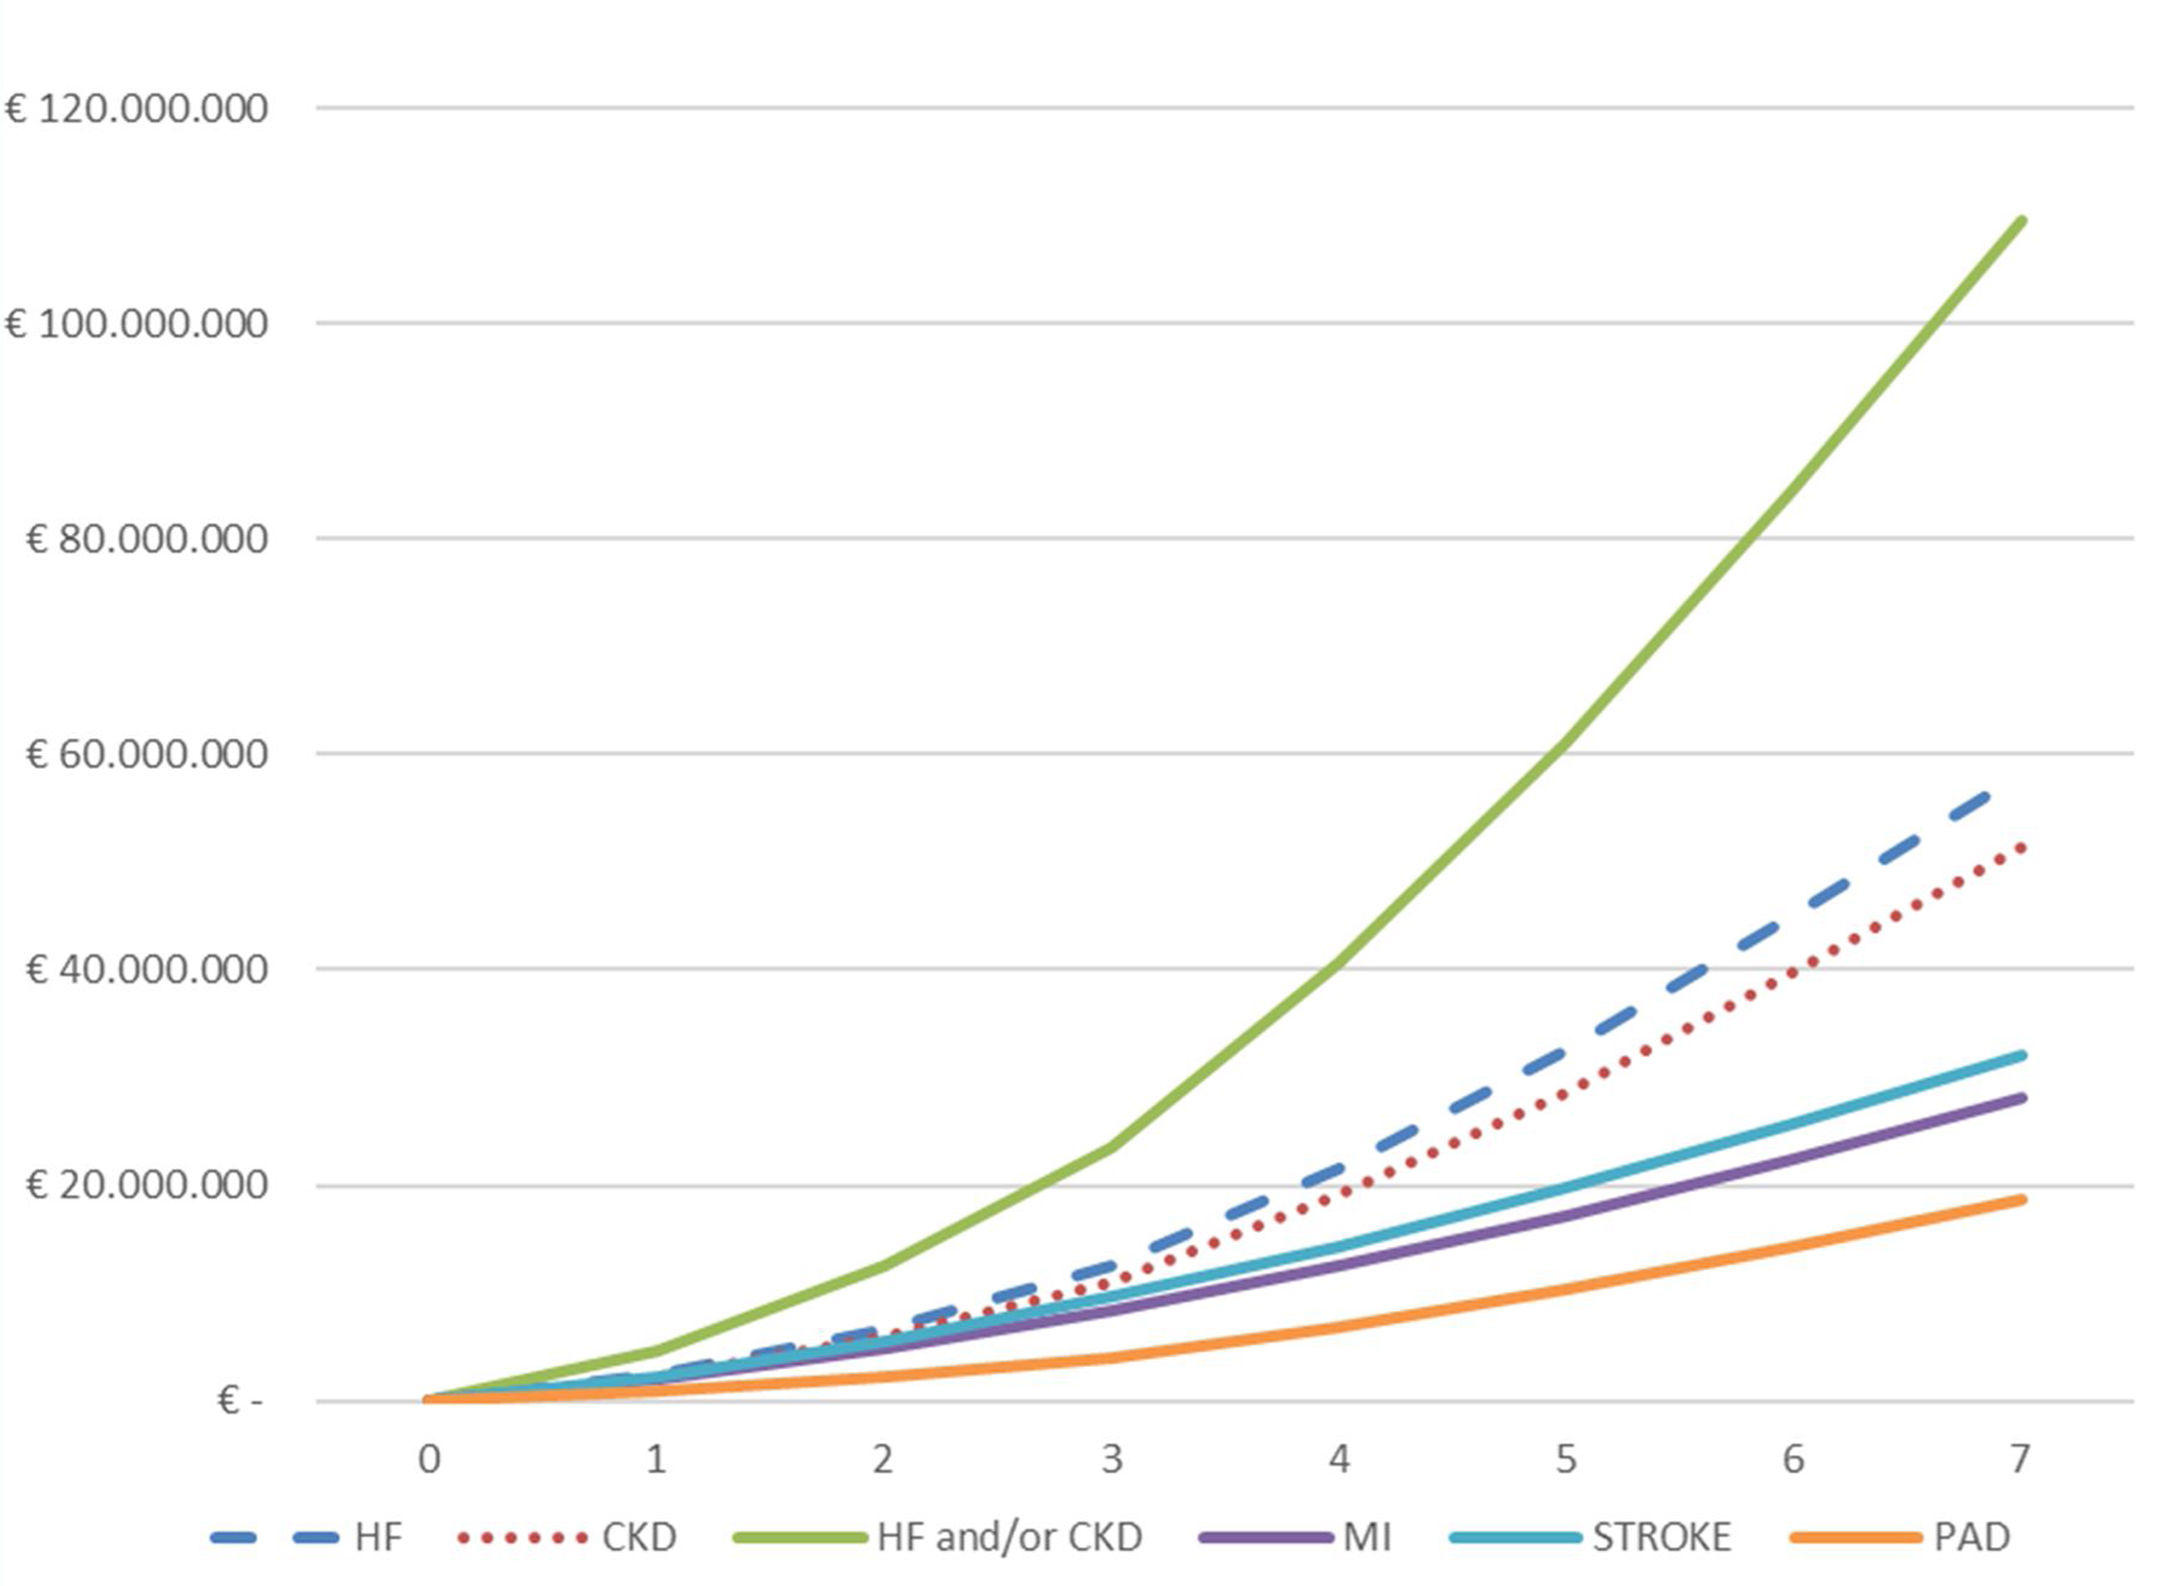
The total cumulative hospital absolute cost (N=4974) of CVKD in T2DM patients per year of follow-up (2013–2019) is shown in Fig. 3 and Table S3. The total hospital cost for the population over the seven years of the study studied was €188.5 million, equivalent to a mean per patient of € 37,905. The total hospital cost due to HF (€ 58,258,479) and CKD (€ 51,471,084) as the first complications of T2DM was significantly higher than that for MI (€ 28,092,277), stroke (€ 32,051,591) and PAD (€18,665,338); p<0.001. Moreover, a significantly higher expenditure was observed when comparing the mean cost per patient/year before the first event versus that after (Table S4) for the groups presenting HF (N=1112) or CKD (N=1820) as first manifestation: (a) HF (€ 1509 vs. € 10,063; p<0.001) and (b) CKD € 2162 vs. € 9508; p<0.001).
Discussion. N=4974. HF: heart failure; CKD: chronic kidney disease; MI: myocardial infarction; PAD: peripheral artery disease.")
The results of this population-based study show that two-thirds of T2DM patients were free of CVDK on the index date. During the follow-up (2013–2019), HF and CKD were the most frequent first manifestations compared with MI, stroke, and PAD, and also had higher mortality rates. In addition, both were associated with a higher incidence of re-hospitalisation when compared with MI, stroke, and PAD, increasing the use of healthcare and indirect resources, and increasing Spanish National Health System expenditure. These two diseases also resulted in a worse prognosis because, as described in our study, both HF and CKD are accompanied by a higher incidence of subsequent diagnoses that worsen the evolution. It should be noted that the 6% prevalence that we found corresponds approximately to the 50% of known diabetes that is described in the usual prevalence studies.4
Winell,18 in a 1996–2012 study in Finland, found that diabetic patients have a higher incidence rate of HF, with a worse prognosis, than non-diabetic patients. Sukkar19 studied 9313 diabetic patients and found that 22.6% developed CKD during a mean follow-up of 5.7 years. Advanced age and cardiovascular comorbidity, among other factors, were associated with an increased incidence. Our results are in line with these studies, with HF and CKD being the two most common manifestations of T2DM, and these two complications presented earlier than other CVD analysed.20
Albuminuria increases the cardiovascular risk, and its association with reduced glomerular filtration increases mortality.21 Based on the results of the study, which show the importance of CKD and HF as serious and early complications in T2DM, strategies should be established to prevent and treat these patients early. Among them, the use of albuminuria and the albumin/creatinine ratio as early markers are of special importance. Koye22 found an annual incidence rate of microalbuminuria of 7–8% in T2DM patients. Until recently, the treatments used for preventing kidney disease (renin angiotensin system inhibitors) were of very limited efficacy and there was no optimal tool to prevent HF development or its progression in any way. Our data are not surprising and show one of the therapeutic areas with unmet needs. Therefore, current data on SGLT-2 inhibitors are encouraging since they have demonstrated a capacity to both prevent and slow the progression of HF and CKD in diabetic patients and reduce the hospitalisation rate due to HF which is the most important cause of increased healthcare expenditure.23–31 HF of ischaemic aetiology is associated with a higher risk of death compared with non-ischaemic HF among patients with T2DM,32 however, this has not been confirmed in more recent data.33 We had no access to the aetiology of HF in our sample and therefore cannot analyse this aspect, which is a limitation of the study.
The cumulative hospital costs per patient of HF (€ 50,942.80) and CKD (€ 48,979.20) were higher than those for MI (€ 47,343.20) and stroke (€ 47,070.30) and similar to those for PAD (€ 51,240.00), compared with € 13,098.90 in patients without CVKD. Re-hospitalisation is common in these types of patients (HF and CKD), and results in high health resource use and costs. The most striking cost components were hospital admissions (39%) and medication (19%). A review by Einarson34 described high comorbidity in T2DM patients with a mean annual cost per patient according to the absence or presence of CVD of $3418 and $9705, respectively. Wan,35 in a large cohort of patients (1.6 million patient-years) and with an 8.5 year follow-up, found that the effect of CVD, cerebrovascular accidents, CKD and the combination of these factors has an additive impact on health costs, with special emphasis on CKD on T2DM patients. A Spanish study also highlighted a higher cost in patients with CKD+HF (€ 14,868) compared with those with HF (€ 9365). The comorbidity associated with HF was high.14 Goncalves36 described the associated cost of HF and CKD attributable to diabetes in 2010–2016 in Brazil, which was $180 million per year for HF, with an upward trend. The presence of CKD increased the cost ($475 million). The authors emphasised that the economic burden of CKD will gradually increase in coming years, with serious implications for the financial sustainability of the Brazilian public health system. McQueen37 found that costs increase as kidney function decreases in T2DM patients (phase 1: $1732 vs. phase 5: $6949). Other authors highlighted the effect of prevention and self-care in the early stages of HF, reviewing the medical record and symptoms with the aim of reducing the economic burden of HF+T2DM on hospital admissions.38 All these studies conclude that the cost of hospitalisation and the presence of HF and/or CKD increases health costs in T2DM patients.
The study had some limitations: (a) the main limitation was the bias regarding the time of evolution of T2DM, as a single fixed index date was used for patient selection; (b) the inherent limitations of retrospective, observational studies using databases, such as disease underreporting or possible variations in the recording of information by health professionals; the database was constructed in 2012, and therefore, for some patients it was not possible to determine with certainty whether patients were CVKD-free on or before the index date, even though the obtention of records from both primary and hospital care may have minimised this bias; (c) the possible inaccuracy of disease coding in the diagnosis of CVKD and other comorbidities; (d) the absence of specific variables, such as socioeconomic level, adherence and variations in the dose of the medication administered, comorbidities, healthy lifestyle, variations in blood pressure or cholesterol, among other unmeasured factors which could have influenced the results; (e) only hospitalisations due to CVKD were considered, so there could be an underestimate of less serious conditions; f) the lack of information from the private healthcare sector, which although much less relevant in Spain, could have had a certain influence on the results. Furthermore, at the beginning of the study, all patients were free of CVKD (according to the available data), although it is unknown whether there were differences in the follow-up of the clinical protocols in the participating centres. It is also unknown when the last screening for complications was performed in the subjects studied; therefore, this circumstance should be considered a limitation of the study. Another limitation of the study is the possible underreporting of new CVKD episodes during follow-up. It is possible that there are unidentified aspects as it is a retrospective study; although the default bias of CVKD, to our knowledge, is very low in the database. Finally, angina pectoris and TIA were not counted as CVKD, as they are conditions that may not require hospital admission, despite being clear manifestations of CVKD.
ConclusionsIn T2DM patients, HF and CKD were the first and most common manifestations during a seven-year follow-up, with a significantly higher impact on mortality and rehospitalisation rates. This resulted in increased healthcare resource use and related costs for HF and CKD, respectively, in the Spanish National Health System.
Authors’ contributionsThe conception and design of the manuscript were made by all authors. The collection of data and statistical analysis was by ASN, and the interpretation of the data, drafting, revision and approval of the manuscript submitted, by all authors.
Author agreementNone.
Funding sourceThis work has been funded by AstraZeneca, Spain.
Conflict of interestASM and ASN are independent consultants in relation to the development of this manuscript. BP, MS and JB are employees of AstraZeneca. AH has carried out paid activities for AstraZeneca Laboratories as a speaker at national meetings. MABL have no conflict of interest for the subject of the work. I have received honoraria for lectures, consultancies and collaborations for research and attendance at conferences from Almirall, AstraZeneca, Boehringer, Esteve, FAES, Ferrer, Fresenius, Janssen, Lilly, MSD, Nestlé, NovoNordisk, Novartis, Nutricia, Rovi, Sanofi. NM, conferences and advisory boards for AstraZeneca. RAA reports personal fees from AstraZeneca, during the conduct of the study; personal fees from AstraZeneca, personal fees from Vifor-Fresenius, personal fees from Otsuka, personal fees from Boehringer Ingelheim, personal fees from Fresenius Medical Care, outside the submitted work.
The following are the supplementary data to this article: