


The procedure for arterial blood sampling can be technically difficult with limitations and complications.
AimsTo evaluate the correlation and agreement between arterial and central venous blood pH, PO2, PCO2 and HCO3− values and infer whether central venous blood gas (CVBG) values could replace arterial blood gas (ABG) values.
DesignProspective observational study.
Methods and MaterialA total of 100 samples were collected from 50 adult normotensive and normothermic patients requiring mechanical ventilation. Arterial blood was collected from radial artery and within 2 minutes central venous blood was withdrawn from the same patient. Correlation and agreement was tested using Pearson's Correlation and Bland Altman Analysis.
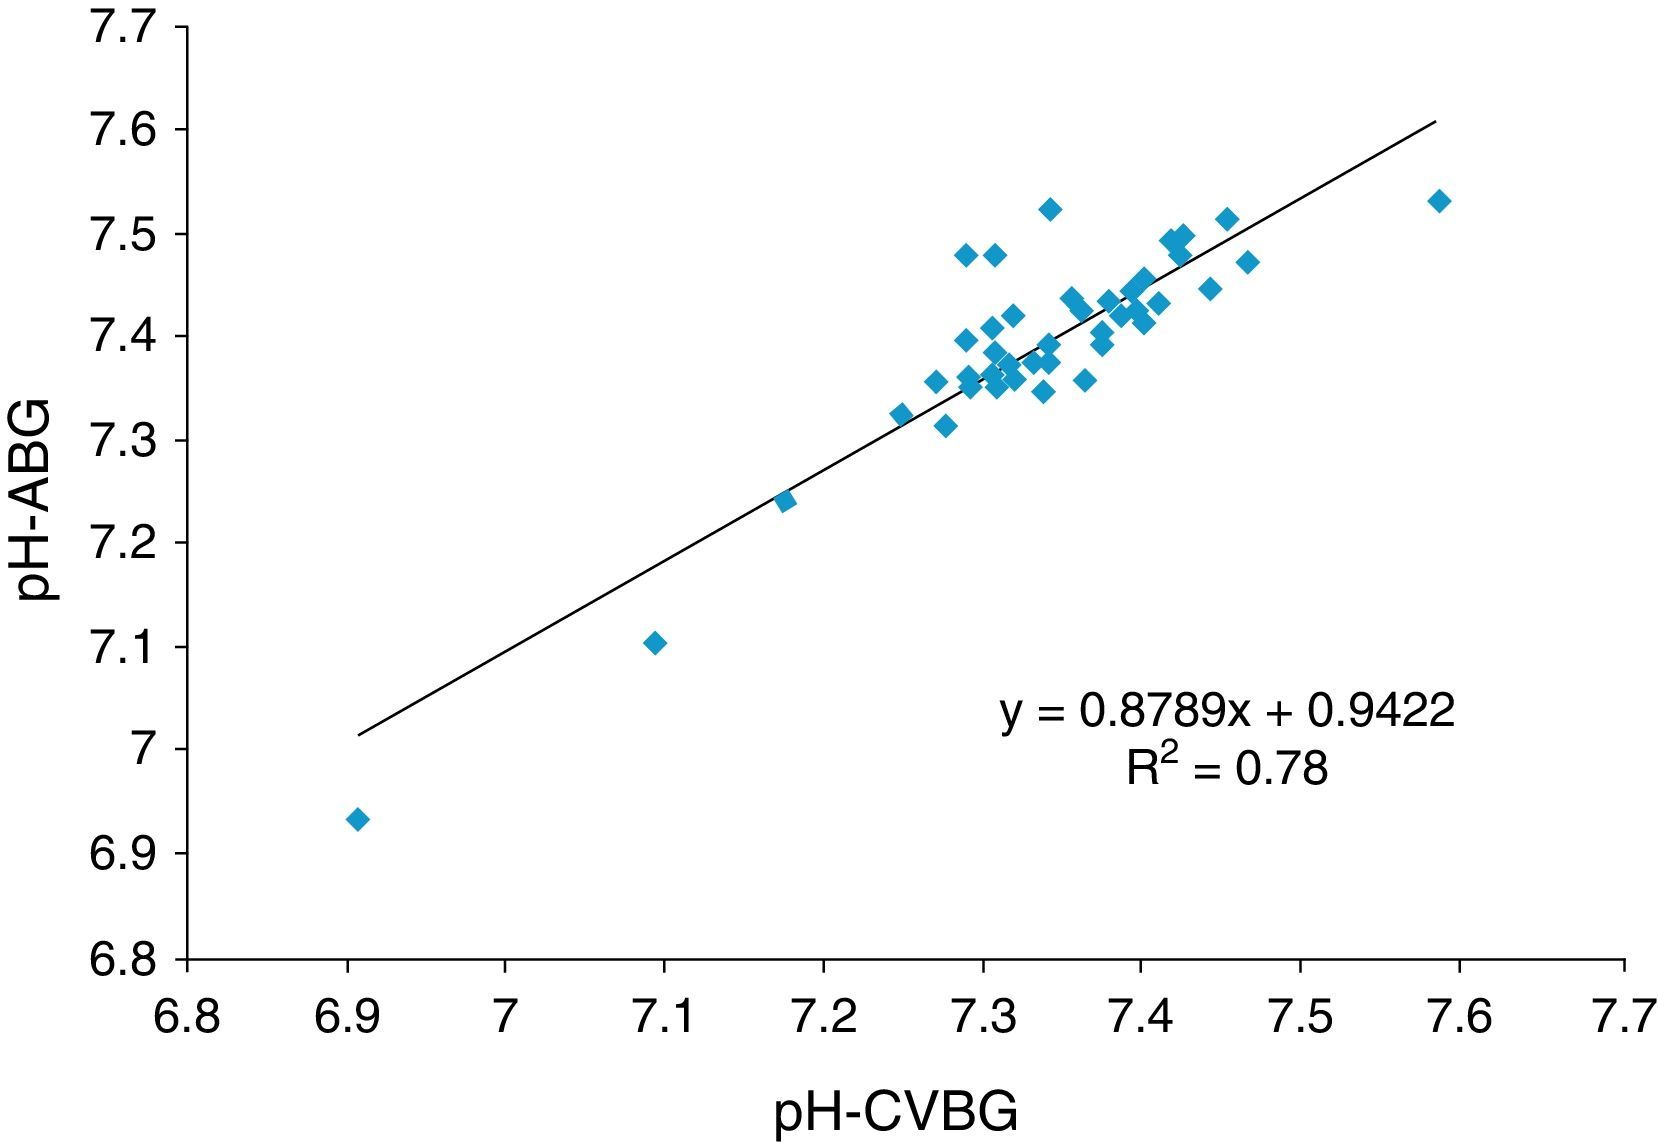
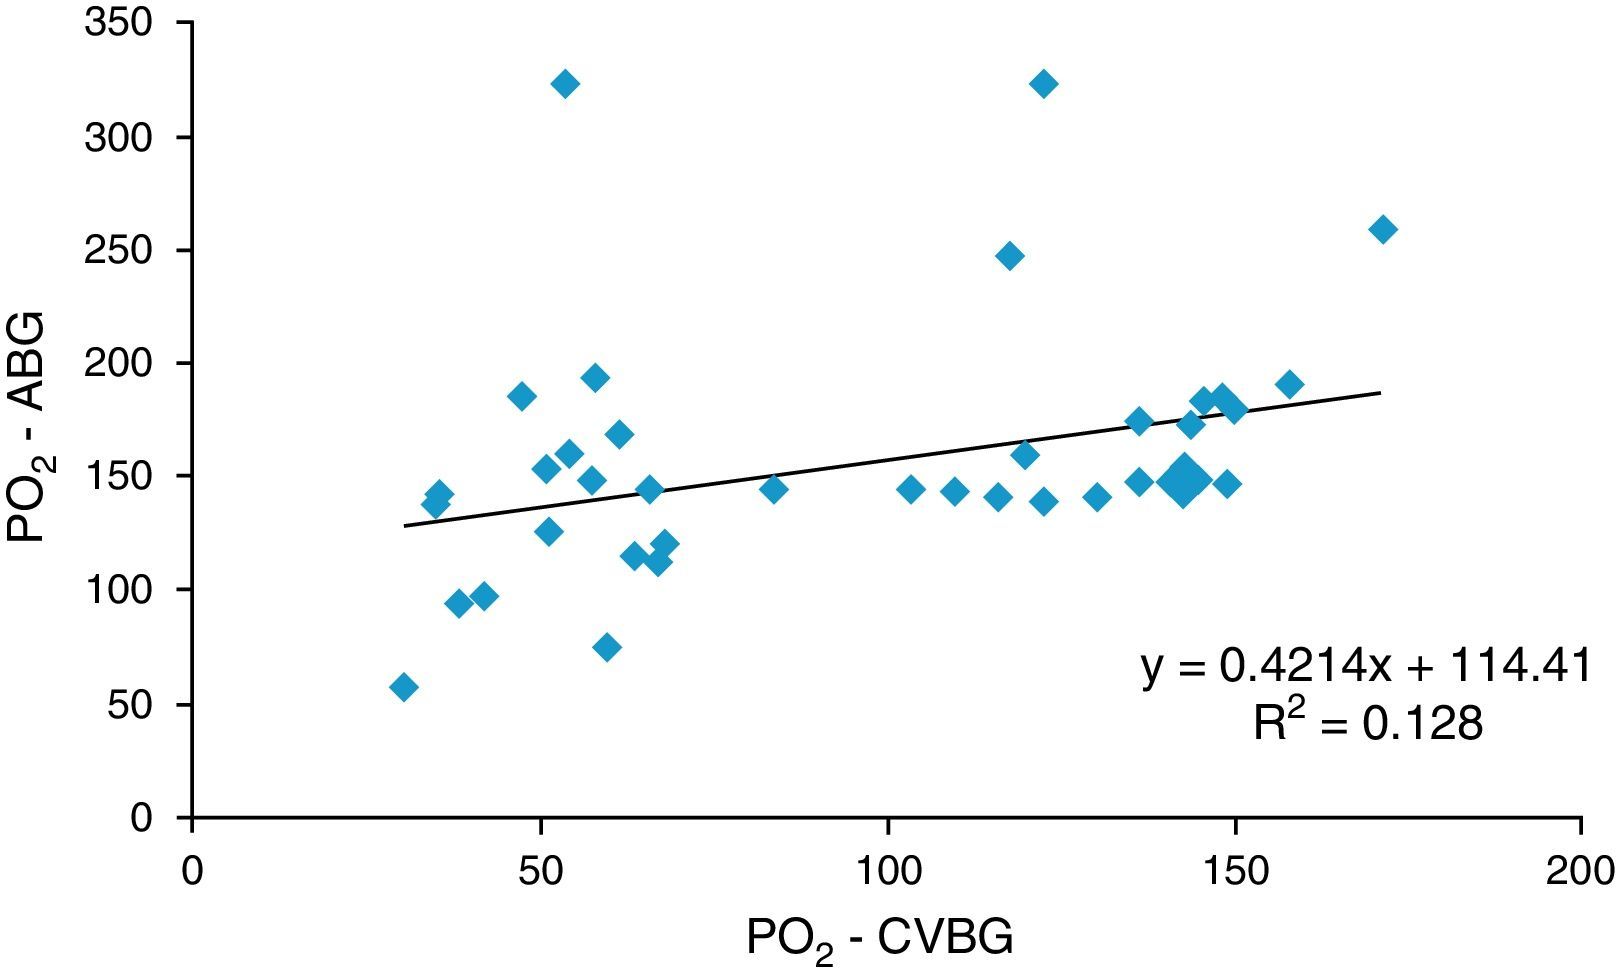
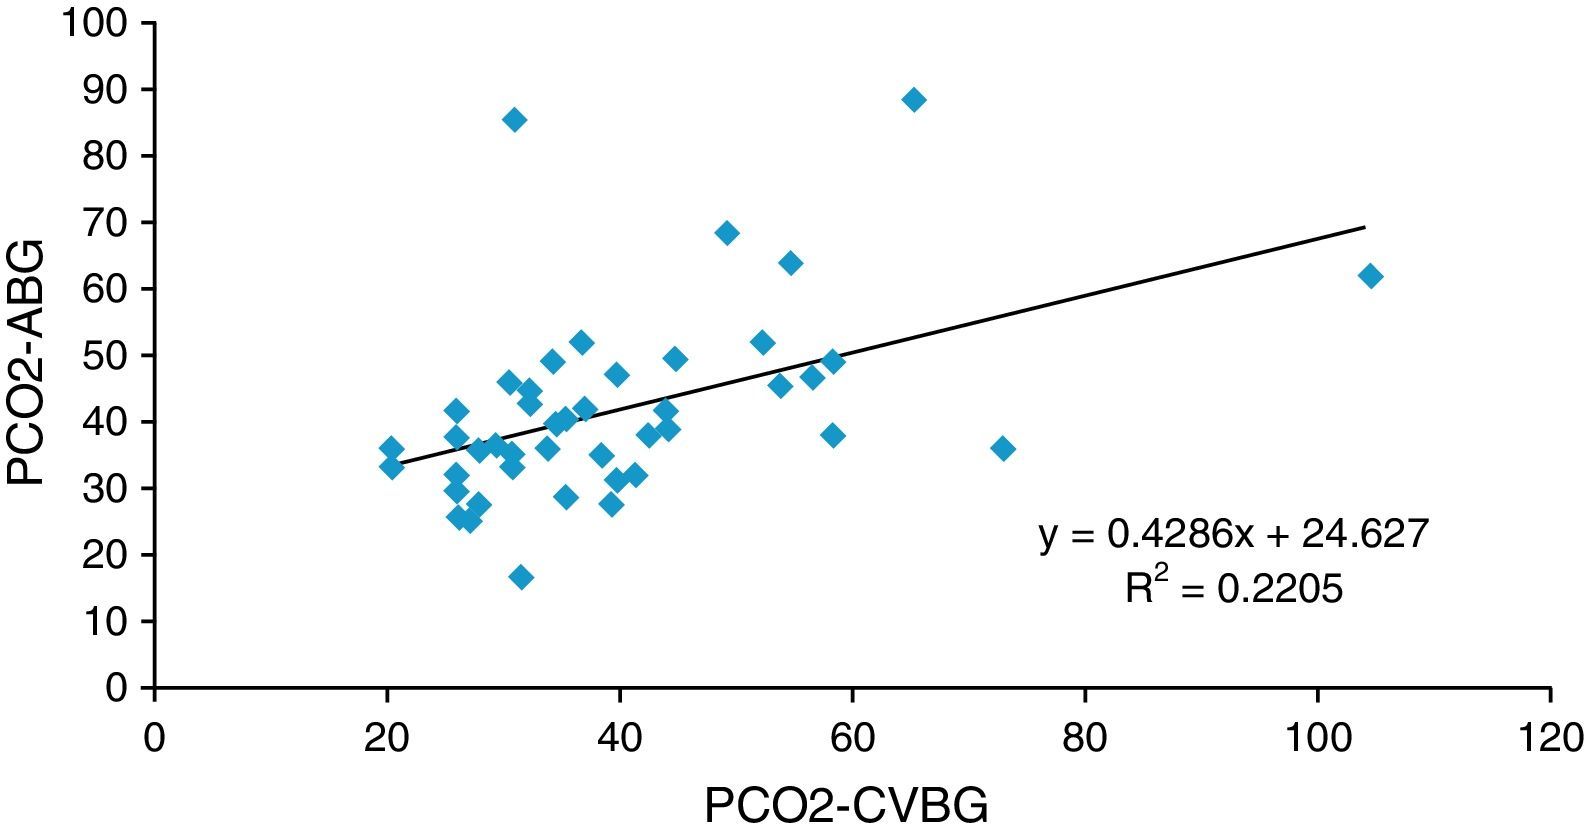
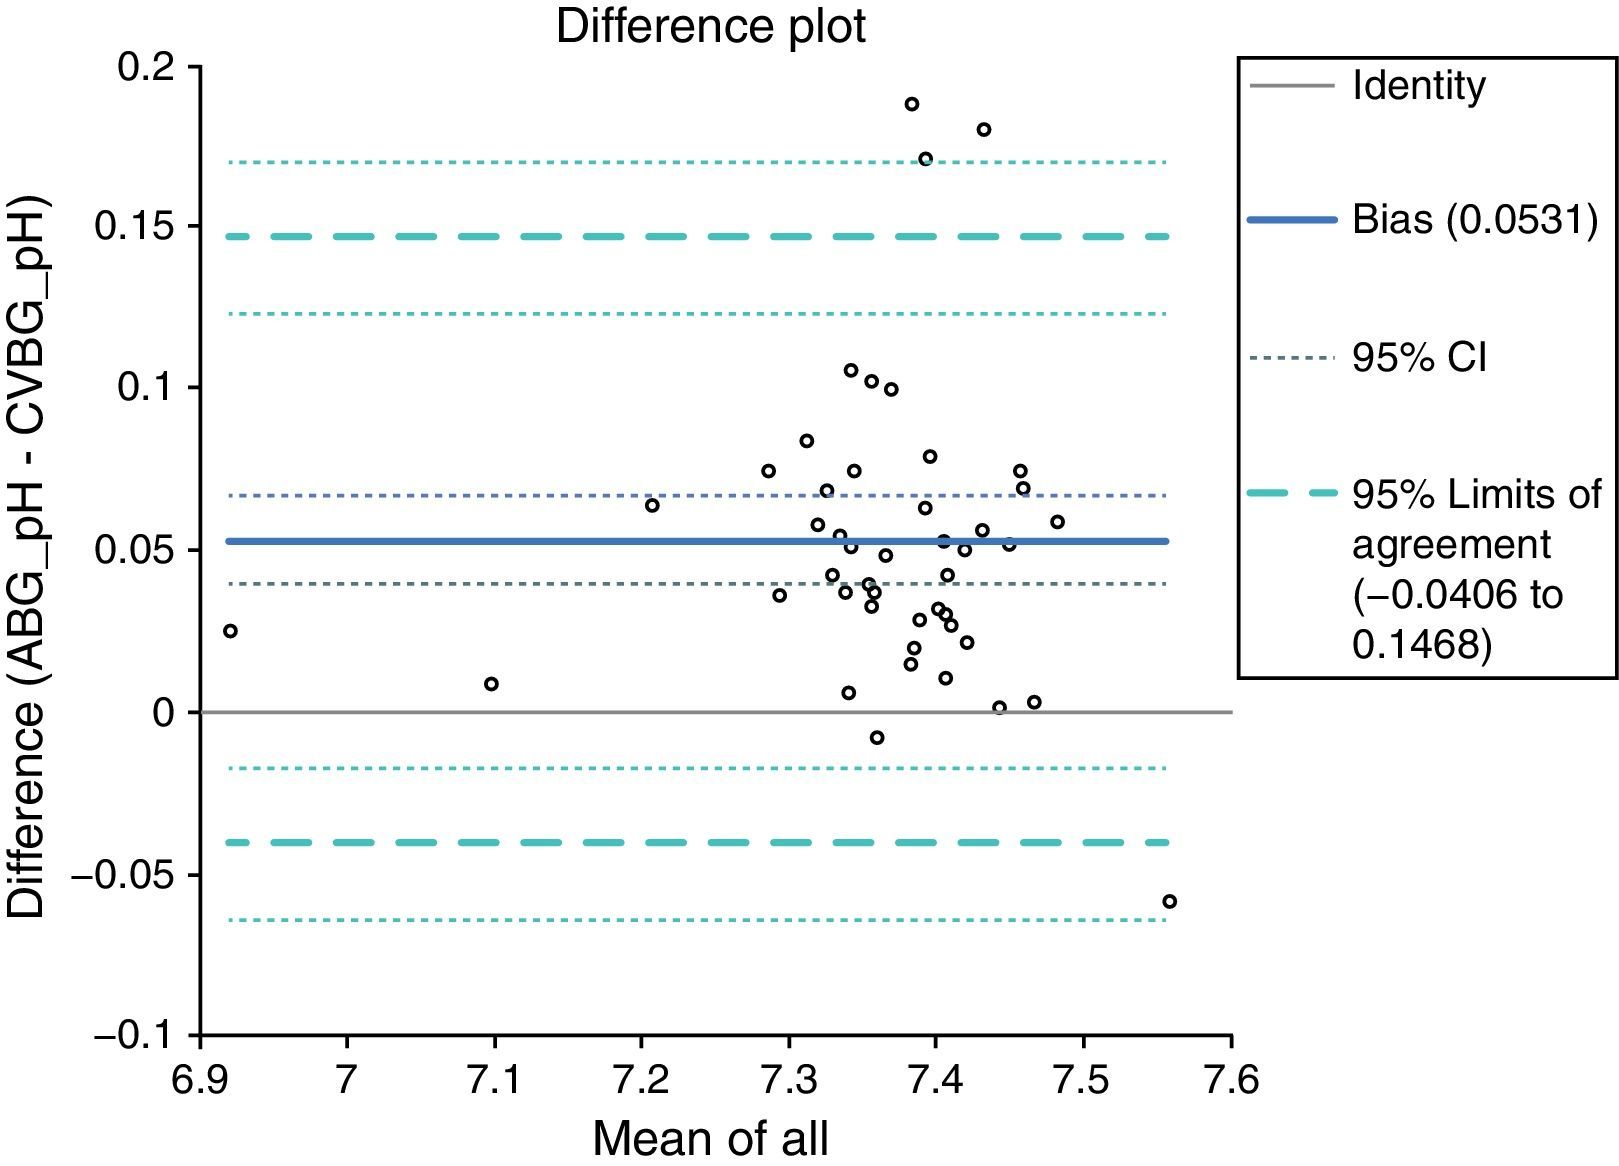
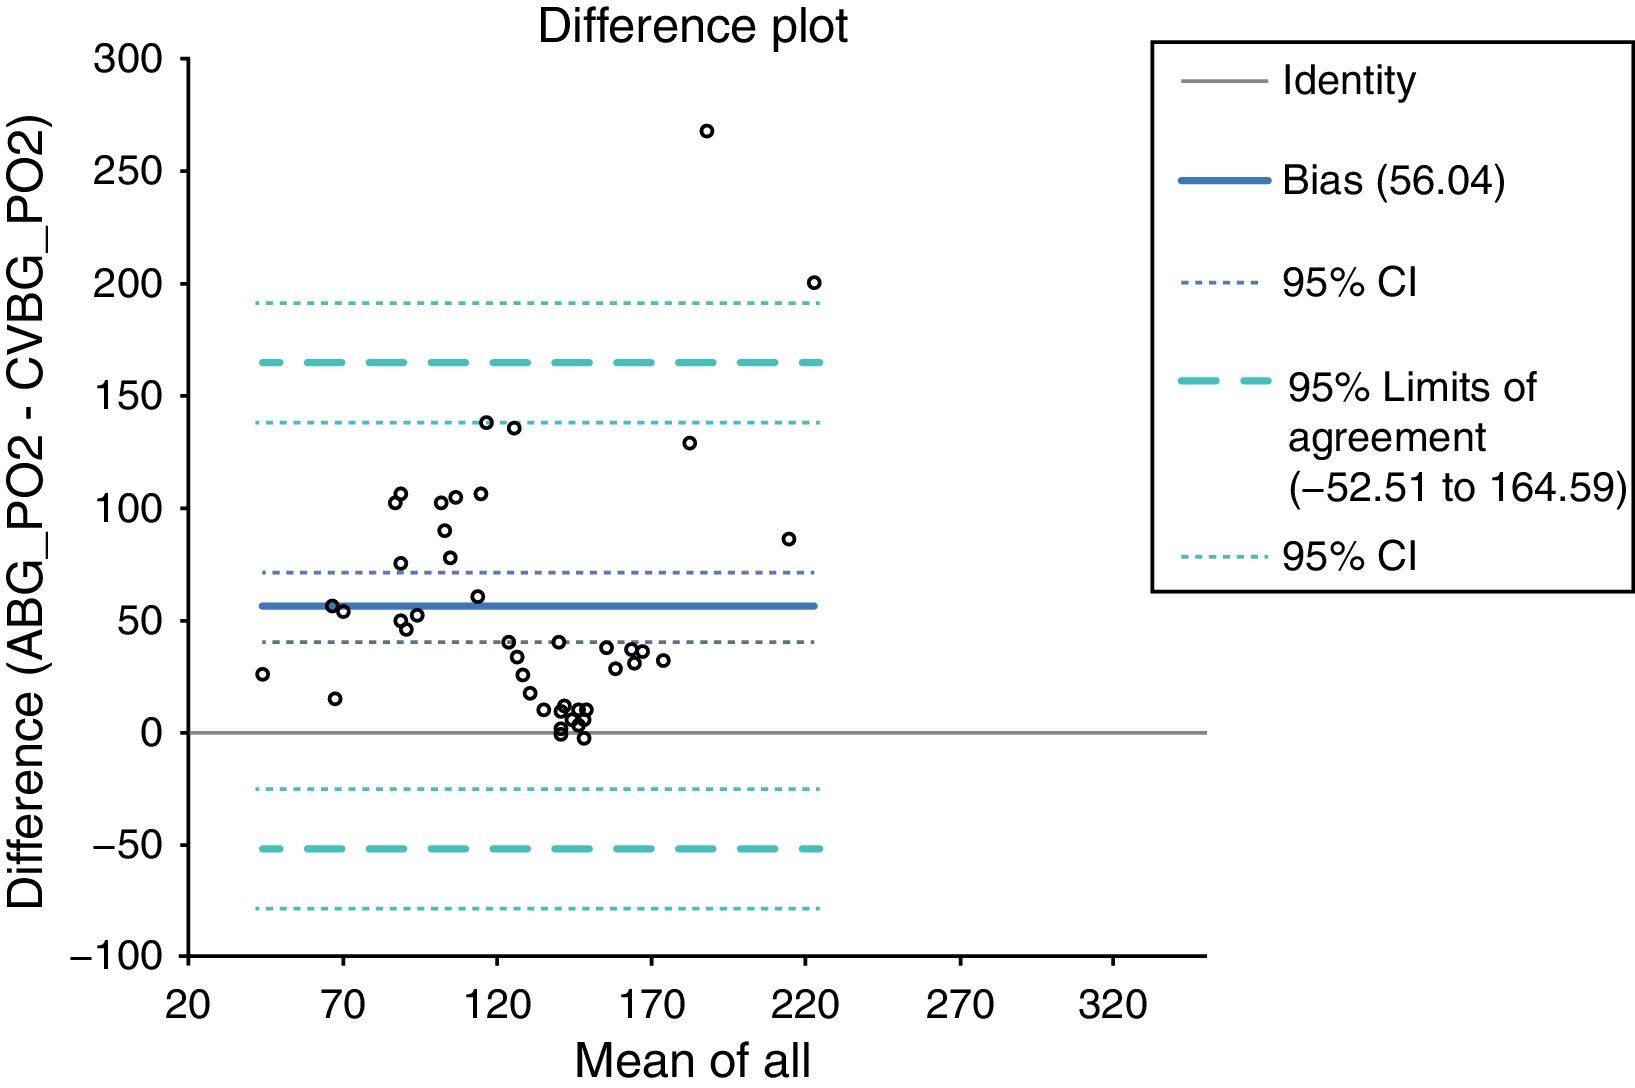
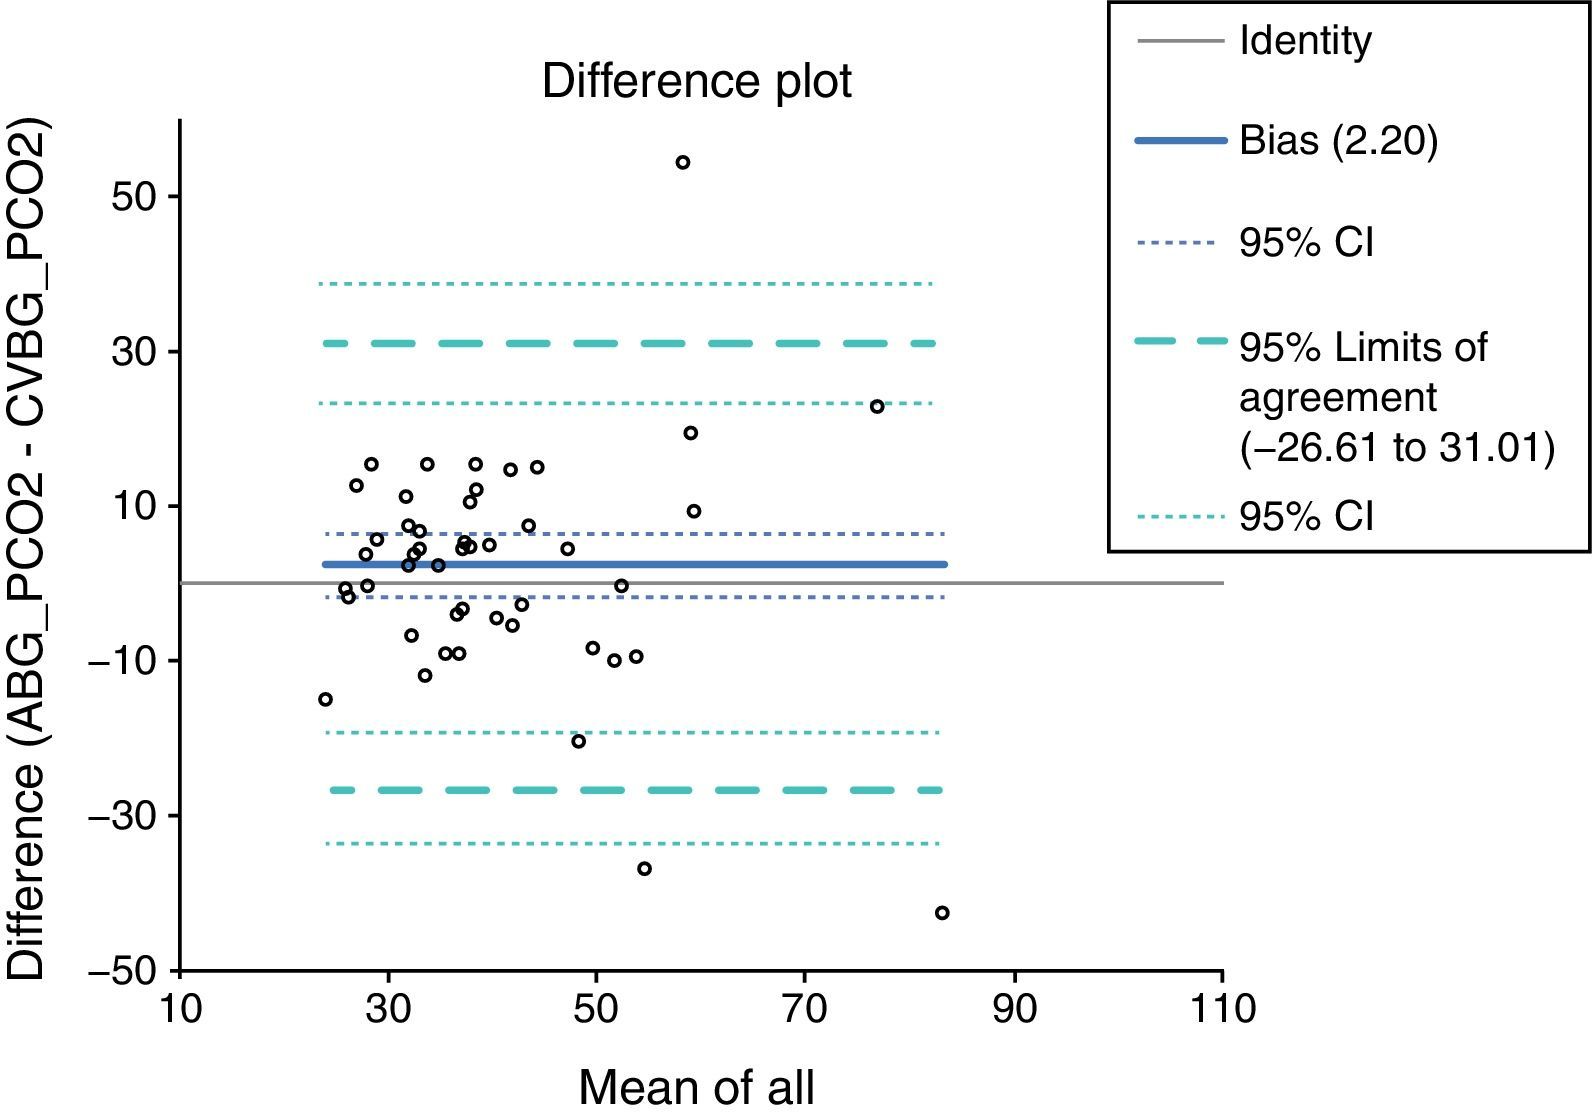
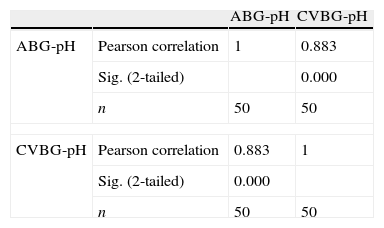
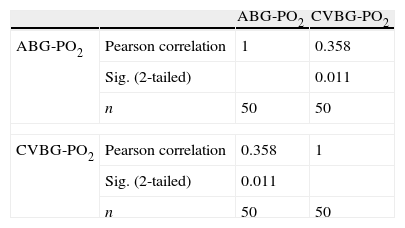
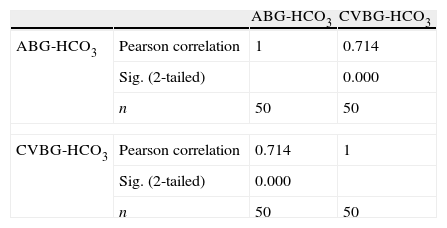
ResultsThe pH, PO2, PCO2 and HCO3− of CVBG correlated significantly with arterial values (rpH=0.88, p<0.001; rPO2=0.358, p<0.05; rPCO2=0.470, p<0.001 and rHCO3=0.714, p<0.001). Regression equations were derived to predict AVG values from CVBG values as follows: Arterial pH=0.879×central venous pH+0.9422 (constant), arterial PO2=0.421×central venous PO2+114.4 (constant), R2=0.128, arterial PCO2=0.429×central venous PCO2+24.627 (constant), R2=0.2205 and arterial HCO3=1.045×central venous HCO3+3.402 (constant), R2=0.5101.The mean arterial minus venous difference for pH, PO2, PCO2, and bicarbonate was 0.053±0.014, 56.04±15.74, 2.20±4.4 and 4.30±1.64 respectively. Bland-Altman plots for agreement of pH, PO2, PCO2, and bicarbonate showed 95% limits of agreement of −0.04 to 0.146, −52.51 to 164.59, −26.61 to 31.01 and −7.0 to 15.6, respectively.
ConclusionsThe arterial pH, PO2, PCO2 and HCO3− values correlated well with central venous values. However, only the arterial pH value can replace the central venous pH value.
la toma de gases arteriales (GA) puede ser difícil con limitaciones y complicaciones.
Objetivoevaluar la correlación y concordancia entre valores de pH, PO2, PCO2 y HCO3− en sangre arterial y venosa central e inferir si valores de gases venosos centrales (GVC) pueden reemplazar valores de GA.
DiseñoEstudio prospectivo observacional.
Materiales y Métodosse tomaron 100 muestras en 50 pacientes adultos normotensos y normotérmicos, que requirieron ventilación mecánica. Los GA se tomaron de la arteria radial y 2 minutos después se tomaron los GVC. Se evaluó la correlación y concordancia utilizando la Correlación de Pearson y Análisis de Bland Altman.
Resultadoslos valores venosos y arteriales de pH, PO2, PCO2 y HCO3− correlacionaron significativamente (rpH=0.88, p<0.001; rPO2=0.358, p<0.05; rPCO2=0.470, p<0.001 y rHCO3=0.714, p<0.001). Las ecuaciones que predicen los valores de GA a partir de valores de GVC, son: pH arterial=0.879×pH venoso central+0.9422; PO2 arterial=0.421×PO2 venoso central+114.4, R2=0.128, PCO2 arterial=0.429×PCO2 venoso central +24.627, R2=0.2205 y HCO3 arterial=1.045×HCO3 venoso central+3.402, R2=0.5101. La diferencia media de GA menos GVC de pH, PO2, PCO2, y bicarbonato fue de 0.053±0.014, 56.04±15.74, 2.20±4.4 y 4.30±1.64, respectivamente. Las gráficas de Bland-Altman para concordancia del pH, PO2, PCO2 y bicarbonato mostraron límites de concordancia del 95% de -0.04 a 0.146, −52.51 a 164.59, −26.61 a 31.01 y −7.0 a 15.6, respectivamente.
Conclusioneshubo correlación entre los valores de GA y GVC de pH, PO2, PCO2 y HCO3−. Sin embargo, solamente el pH venoso puede reemplazar el pH arterial.
Arterial blood gas (ABG) analysis represents the gold standard for determining acid–base status of a mechanically ventilated patient.1 The procedure at times can be technically difficult with various limitations and complications.2–5
The information obtained from an ABG report can also be obtained from venous blood sampling.6 Central venous access is almost a routine and mandatory procedure in OT, ICU, Accident and Emergency unit. It can therefore be a much easier, quicker and less complicated method of identifying venous blood gas status of the patient.3,6
However, in order to replace ABG values with central venous blood gas (CVBG) values we need to first find a correlation and agreement between the two blood gas values.
Previous studies have examined the relationship between arterial and central venous gas samples. Most of those studies were disease specific. They have dealt with either agreement or correlation of one or two blood gas parameters. Further, the inference of most of the studies was not in congruence with each other.6–10
Hence, the aim of the present study was to evaluate the correlation and agreement between arterial and central venous blood pH, PO2, PCO2 and HCO3− values in medical and surgical patients admitted in the ICU and infer whether central venous blood gas could replace arterial blood gas.
Subjects and methodsThe study was conducted in the ICU of a Medical College Hospital. Ethical clearance was obtained from departmental ethical committee. 50 adult patients including both sexes, age ranging between 20 and 50 yrs and requiring mechanical ventilation were enrolled in the study. Informed consent was obtained from the patients nearest relatives. No patient was included twice for the study.
The blood (1ml) was collected simultaneously from either radial or femoral artery and central vein of the same patient by two different observers so as to avoid difference in sample collection time. The sample was drawn in two separately labelled pre-heparinised syringes and immediately analysed in the ABG machine (Eschweiler Combisys 2 analyser) kept in the ICU, so as to avoid maintenance of cold chain with ice. A total of 100 samples (50 ABG plus 50 CVBG) were analysed. The PO2, PCO2, pH and HCO3−, were recorded from the ABG report and evaluated for the study. Additional data recorded were: the Diagnosis of the disease, Ventilator setting, Heart Rate, mean arterial pressure (MAP), arterial oxygen saturation (SpO2), temperature, hemogram, and renal profile. Patients with severe hypotension, severe sepsis, trauma in hands, no central venous access and hypothermia (≤36°C) were not included in the study.
All statistical analysis were done using SPSS version 17. A sample size of 50 in each group was based on power analysis in which alpha level was fixed at 0.05, anticipated effect size (Cohen's d) of 0.8 and for a desired statistical power level of 0.8, a minimum required sample size per group was calculated to be 26 and minimum total required sample size was calculated to be 52. Pearson correlation test was used to measure the correlation significance (p<0.05) and regression analysis was used to calculate the regression equation between arterial and central venous values. Bland–Altman analysis was used to find the agreement between arterial and central venous pH, PO2, PCO2 and HCO3−. The A−V (arterial−venous) difference versus the average value ([A+V]/2) was plotted. Means, SDs and 95% prediction intervals (limits of agreement) were evaluated (A=arterial parameter, V=central venous parameter). The predefined value for acceptable limits of agreement (LOA) for pH was −0.05 to +0.05, for pCO2 −10 to +10, for pO2 −10 to +10 and for HCO3 was −2 to +2.
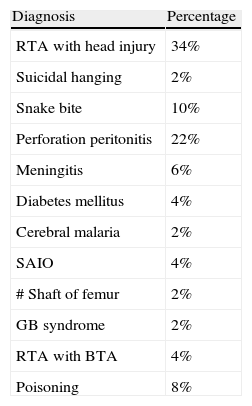
ResultsThe demography and the diagnosis of the patients are shown in Table 1.
Distribution in terms of diagnosis in study population.
| Diagnosis | Percentage |
| RTA with head injury | 34% |
| Suicidal hanging | 2% |
| Snake bite | 10% |
| Perforation peritonitis | 22% |
| Meningitis | 6% |
| Diabetes mellitus | 4% |
| Cerebral malaria | 2% |
| SAIO | 4% |
| # Shaft of femur | 2% |
| GB syndrome | 2% |
| RTA with BTA | 4% |
| Poisoning | 8% |
Source: authors.
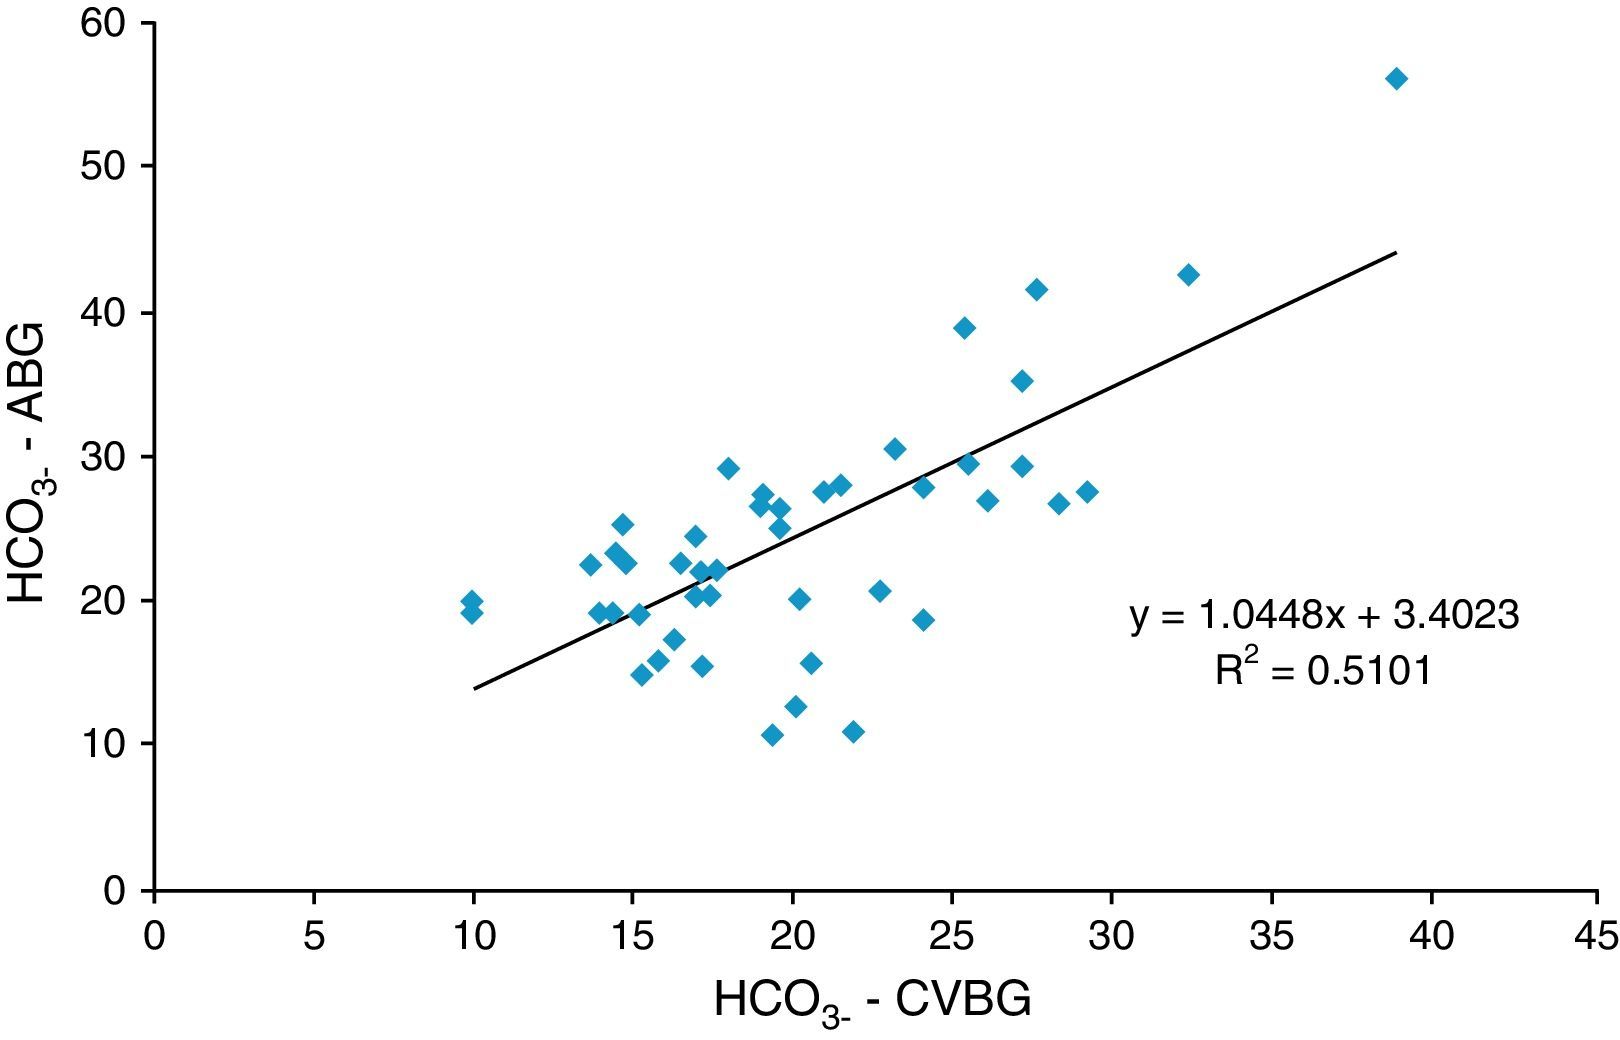
The pH, PO2, PCO2 and HCO3− of central venous (CVBG) correlated significantly with arterial values (rpH=0.88, p<0.001; rPO2=0.358, p<0.05; rPCO2=0.470, p<0.001 and rHCO3=0.714, p<0.001) (Tables 2–5 and Figs. 1–4). The correlation was quantified by calculating regression equation for each parameter as mentioned below:
Arterial pH=0.879×central venous pH+0.9422(constant), R2=0.78
Arterial PO2=0.421×central venous PO2+114.4 (constant), R2=0.128
Arterial PCO2=0.429×central venous PO2+24.627 (constant), R2=0.2205
Arterial HCO3=1.045×central venous HCO3+3.402 (constant), R2=0.5101
.")
.")
 and central venous (VBG) blood gas PCO2.")
.")
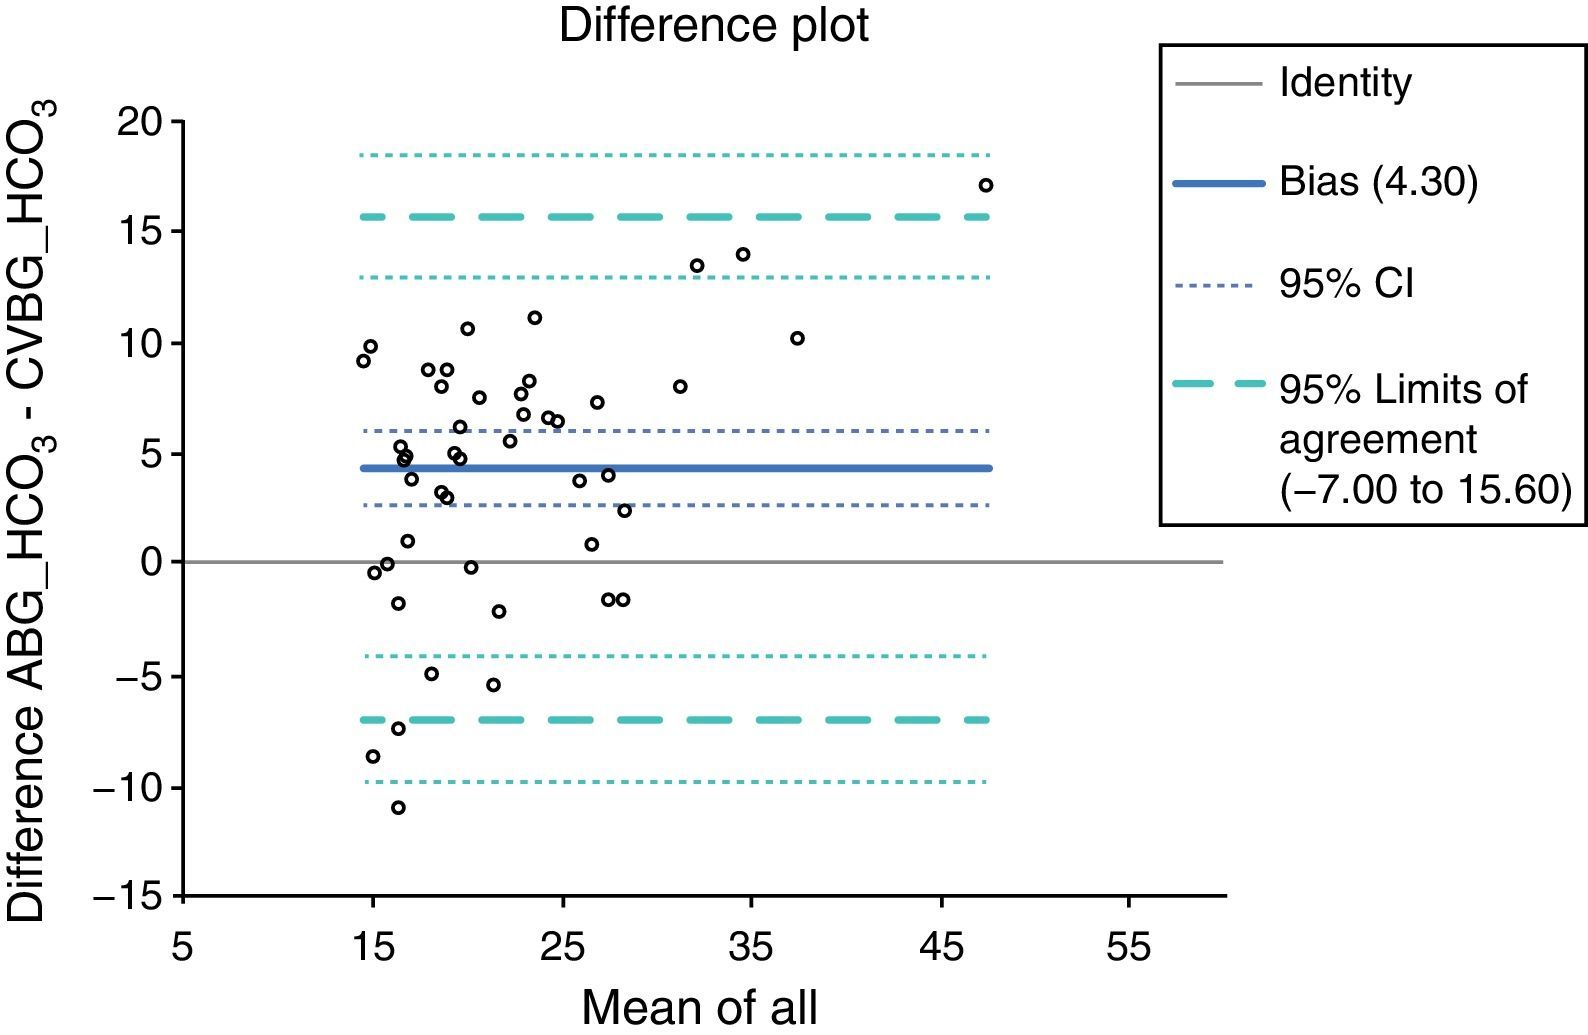
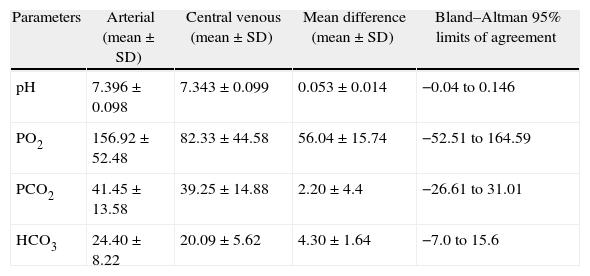
The mean difference and 95% limits of agreement were calculated using Bland–Altman analysis to assess the agreement between two variables. The value of mean difference was small (0.053±0.014) and value of 95% limits of agreement was narrow (−0.04 to 0.146) for pH in ABG and CVBG and showed good agreement. However, value of mean difference was large and value of 95% limits of agreement was too wide for PO2, PCO2 and HCO3− of ABG and CVBG, which indicated poor agreement (Table 6). The bias plotting using Bland–Altman analysis is shown in Figs. 5–8.
Mean values of simultaneously obtained arterial (ABG) and central venous (CVBG) blood gas pH, PCO2 and HCO3 along with the calculated standard deviation.
| Parameters | Arterial (mean±SD) | Central venous (mean±SD) | Mean difference (mean±SD) | Bland–Altman 95% limits of agreement |
| pH | 7.396±0.098 | 7.343±0.099 | 0.053±0.014 | −0.04 to 0.146 |
| PO2 | 156.92±52.48 | 82.33±44.58 | 56.04±15.74 | −52.51 to 164.59 |
| PCO2 | 41.45±13.58 | 39.25±14.88 | 2.20±4.4 | −26.61 to 31.01 |
| HCO3 | 24.40±8.22 | 20.09±5.62 | 4.30±1.64 | −7.0 to 15.6 |
PCO2, partial pressure of carbon dioxide (mm Hg); PO2, partial pressure of oxygen (mmHg); HCO3, bicarbonate (mmol/l).
Source: authors.


In the present study the correlation between pH of ABG and CVBG was significant, with narrow 95% limits of agreement (LOA). This probably indicated an acceptable agreement between pH of ABG and CVBG, which was in accordance to the previous authors.7–10 However, Malinoski et al. in 20056 evaluated a poor LOA between pH of CVBG and ABG although the correlation was statistically significant.
Similarly, the correlation between PCO2 of ABG and CVBG was statistically significant (p<0.001) but the 95% limits of agreement were poor. This was in accordance to the observation of Malinoski et al.6 and Adrogue et al.7 However, contrary to our findings, Treger et al.9 showed good agreement between PCO2 of ABG and CVBG samples. They demonstrated that the mean arterial minus venous (A−V) difference for PCO2 was small with narrow 95% limits of agreement. They concluded that the peripheral or central venous PCO2 could replace their arterial equivalents in many clinical contexts encountered because they were in agreement with each other.
Middleton et al.8 determined the extent of agreement between CVBG and ABG values for HCO3− and showed acceptably narrow 95% limits of agreement. Similarly, Treger et al.9 examined the agreement between ABG and CVBG samples for HCO3− and demonstrated narrow 95% limits of agreement and concluded that HCO3− of CVBG could replace HCO3− of ABG in many clinical contexts in ICU. However, in our study the HCO3− in ABG and CVBG correlated significantly with each other and had small mean difference but the 95% limits of agreement was not significant. This was contrary to the observations of the previous author. The reason for this difference in finding in the present study could be probably due to small sample size and diverse group of patients. Previous studies mainly included specific group of patients including trauma,10 acute exacerbation of COPD,11 Diabetic ketoacidosis,12 etc. as against the diverse group of diseases included in our study.
The PO2 of ABG and CVBG correlated significantly with each other and had large mean difference and hence a poor agreement. Our observation could not be compared with others since to the best of our knowledge there has been no published literature on this. The significant correlation between arterial and central venous PO2 in our study could not be explained. However, their agreement was poor which was similar to other variables in our study.
There were certain weaknesses in our study which probably could be the reason for the differences in observation in comparison to the previous studies. It was a single centre study and the sample size could be smaller than some of the previous studies. However, the strength of the study was that we evaluated major acid base parameters of sufficiently powered population with the diverse disease process.
No study is free from bias. We tried to avoid biasness by analysing both the samples from the same ABG machine thus avoiding biasness or errors due to machine. The samples were collected from mixed patient population (both surgical and medical patients). No patient was repeated for the study. This was done to avoid biasness of disease and patient specific.
Therefore, we conclude that although arterial pH, PO2, PCO2 and HCO3− values correlated well with central venous values only arterial pH value can be replaced by the central venous pH value. However, a further multicentre study with a large sample size may be conducted so as to avoid all the limitations of the present study.
FundingNone declared.
Conflicts of interestThe authors have no conflicts of interest to declare.
Please cite this article as: Islam MS, et al. Correlacion y concordancia entre los valores de pH, PO2, PCO2 y HCO3− en sangre arterial y venosa de pacientes con ventilacion mecanica en la unidad de cuidados intensivos. Rev Colomb Anestesiol. 2013. http://dx.doi.org/10.1016/j.rca.2013.05.011.
Research credited to: Intensive Care Unit, Department of Anaesthesiology, JN Medical College, AMU, Aligarh, India.