


To determine in the adult population the crude and the sex- and age-adjusted prevalence rates of hypertriglyceridaemia (HTG) and to assess its association with cardiovascular risk factors, chronic kidney disease, cardiovascular and cardiometabolic diseases.
MethodsCross-sectional observational study conducted in Primary Care, with 6,588 adult study subjects, randomly selected on base-population. Patients had HTG if the triglyceride level was ≥150 mg/dL (≥1.7 mmol/L), or were on lipid-lowering therapy to lower triglyceride. Associations were assessed by univariate and multivariate analysis, and crude and sex- and age-adjusted prevalence rates were determined.
ResultsThe arithmetic and geometric means of triglyceride levels were respectively 120.5 and 104.2 mg/dL in global population, 135.7 and 116.0 mg/dL in men, and 108.6 and 95.7 mg/dL in women. The crude HTG prevalence rates were 29.6% in global population, 36.9% in men and 23.8% in women. The sex- and age-adjusted HTG prevalence rates were 27.0% in global population, 34.6% in men and 21.4% in women. The independent variables that were most associated with HTG were hypercholesterolemia (OR: 4.6), low HDL-C (OR: 4.1), hepatic steatosis (OR: 2.8), diabetes (OR: 2.0), and obesity. (OR: 1.9).
ConclusionsThe means of triglyceride levels and HTG prevalence rates are intermediate between those of other national and international studies. A fifth of the female adult population and more than a third of the male population had HTG. The independent factors associated with HTG were hypercholesterolemia and low HDL-C, and the cardiometabolic variables diabetes, hepatic steatosis and obesity.
Determinar en la población adulta las tasas de prevalencia crudas y ajustadas por edad y sexo de hipertrigliceridemia (HTG) y valorar su asociación con factores de riesgo cardiovascular, enfermedad renal crónica, enfermedades cardiovasculares y cardiometabólicas.
MétodosEstudio observacional transversal realizado en Atención Primaria, con 6.588 sujetos de estudio adultos, seleccionados aleatoriamente con base poblacional. Los pacientes tenían HTG si la concentración de triglicéridos era ≥150 mg/dL (≥1,7 mmol/L), o estaban en tratamiento hipolipemiante para reducir los triglicéridos. Se valoraron las asociaciones mediante análisis univariado y multivariante, y se determinaron las prevalencias crudas y ajustadas por edad y sexo.
ResultadosLas medias aritméticas y geométricas de las concentraciones de triglicéridos fueron respectivamente 120,5 y 104,2 mg/dL en la población global, 135,7 y 116,0 mg/dL en hombres, y 108,6 y 95,7 mg/dL en mujeres. Las prevalencias crudas de HTG fueron 29,6% en población global, 36,9% en hombres y 23,8% en mujeres. Las prevalencias ajustadas por edad y sexo de HTG fueron 27,0% en población global, 34,6% en hombres y 21,4% en mujeres. Las variables independientes que más se asociaban con la HTG fueron hipercolesterolemia (OR: 4,6), cHDL bajo (OR: 4,1), esteatosis hepática (OR: 2,8), diabetes (OR: 2,0) y obesidad (OR: 1,9).
ConclusionesLas medias de triglicéridos y las prevalencias de HTG se encuentran intermedias entre las de otros estudios nacionales e internacionales. La quinta parte de la población adulta femenina y más de un tercio de la masculina presentaba HTG. Los factores independientes asociados con HTG fueron hipercolesterolemia y cHDL bajo, y las variables cardiometabólicas diabetes, esteatosis hepática y obesidad.
Hypertriglyceridaemia (HTG) is important due to its high prevalence and its clinical relevance when associated with an increased risk of atherosclerotic cardiovascular disease (ASCVD). The increase in the prevalence of HTG in recent decades is similar to that of type 2 diabetes mellitus (DM) and obesity.1
Most circulating triglycerides (TG) are transported by TG-rich lipoproteins, which include chylomicrons, very low-density lipoproteins, and their remnants. Lipids and lipoproteins are measured to estimate cardiovascular risk (CVR) and to assist in the therapeutic management of cardiovascular disease. TG concentrations above 150 mg/dL indicate a higher CVR and necessitate a search for other cardiovascular risk factors (CVRF).2–4
Ischaemic heart disease and cerebrovascular diseases remain the 2 primary causes of mortality in Spain, over recent decades.5 Epidemiological studies show a correlation between HTG and cardiovascular morbidity and mortality.2,6,7 Subjects with similar plasma low-density cholesterol (LDL-C) levels may have different risk of ASCVD depending on their TG concentrations, and therefore individuals with HTG are at higher CVR.8
HTG is frequently associated with low concentrations of high-density lipoprotein cholesterol (HDL-C)and with a higher concentration of LDL-C particles, characterised by being small and dense. This association, known as atherogenic dyslipidaemia, increases the risk of ASCVD.3 TG and HDL-C testing is necessary to estimate CVR more accurately, especially in patients with DM, metabolic syndrome (MS) or chronic kidney disease (CKD), where there is a higher concentration of atherogenic lipoproteins containing apolipoprotein B (ApoB).4 The higher concentration of small, dense LDL-C particles associated with HTG can be reversed by lowering TG levels with drug treatment.9
Although HTG is associated with an increased risk of ASCVD, adjustment for HDL-C attenuates this relationship.8,10Scientific evidence has confirmed that retention within the arterial endothelium of LDL-C and other plasma particles containing ApoB within the arterial endothelium is responsible for the formation of ASCVD, the concentration of which is associated with cholesterol not bound to high-density lipoproteins (non-HDL-C),11 and may even be more effective than LDL-C in predicting ASCVD when HTG is present.12 The set of TG-rich lipoproteins and their remnants is associated with a risk of ASCVD but is determined more by the concentration of ApoB-containing particles than by TG content.2,13,14
Prevalence studies of CVRFs are needed to improve ASCVD prevention, plan health resources, and monitor and evaluate the strategies set out in the Global Plan of Action for the Prevention and Control of Non-Communicable Diseases.15 Severe HTG (TG>885 mg/dL) is rare and is associated more with increased risk of pancreatitis.16–19 However, the prevalence of mild to moderate HTG (HTG between 150 and 885 mg/dL) exceeds 10% of the adult population, with great variability between countries.10,20,21
This study aims to determine the gross and age- and sex-adjusted prevalence rates of HTG in the adult population in the primary care setting, and to assess the association of HTG with CVRF, CKD and cardiovascular and metabolic diseases.
Material and methodsThe SIMETAP-HTG study is part of the SIMETAP project, approved by the Primary Care Management Research Commission of the Madrid Region Health System (SERMAS). This is a cross-sectional, observational study carried out by 121 general practitioners interested in participating in the SIMETAP research project, whose objective was to assess the prevalence of CVRFs, MS and related cardiovascular or metabolic diseases. The doctors worked in 64 SERMAS-dependent primary care centres (25% of the SERMAS health centres). The participating doctors were selected competitively until the necessary sample size was achieved. The material and methods (design, sampling, selection, inclusion and exclusion criteria of the study subjects, data collection and statistical analysis) of the SIMETAP study have been detailed previously in this journal.22 The study population was obtained through a simple random sample of the population over 18 years of age assigned to the SERMAS primary care physicians participating in the study. As per the study protocol, informed consent was obtained from all participants, and those for whom no information on biochemical variables was available were excluded, as were terminal, institutionalized patients, those with cognitive impairment and pregnant women. The final sample was 10,084 study subjects, whose response rate was 65.8%.
The statistical analysis was carried out using the Statistical Package for the Social Sciences (IBM® SPSS® Statistics). The means and standard deviation (SD) were determined for the analysis of continuous variables. The range, median and interquartile range (25th percentile; 75th percentile) of the age variable and the arithmetic mean (SD), median and geometric mean of the TG variable were determined. Qualitative variables were analysed using prevalence rates and percentages in each category, presented with lower and upper limits of the 95% confidence interval (95% CI). Prevalence rates were determined as gross rates and rates adjusted by age and sex, standardized with the Spanish population using the direct method.23 The distributions by age and sex of the Spanish population in January 2015 were obtained from the National Institute of Statistics database.24 It was decided to adjust the rates according to the Spanish population instead of the population of the Community of Madrid, because there were no significant differences in the results of the adjusted prevalence rates between both populations and to facilitate the comparison of results with other populations.
Comparisons of continuous variables were made using the Student t-test or analysis of variance. The chi-square test was used for analysis of categorical variables. Odds ratios (OR) were determined with 95% CI. All the tests were considered statistically significant if the 2-tailed p-value was less than .05. The multivariate logistic regression analysis with the introduce method was used to evaluate the effect on the dependent variable (HTG) of the independent variables (CVRF and comorbidities) whose previously performed univariate analysis would have shown a statistically significant association with the dependent variable, except for the age and sex variables, because they are strongly related to other cardiovascular or metabolic variables. The variables CUN-BAE,25,26 MS, atherogenic dyslipidaemia, ASCVD and CKD were not entered in the multivariate analysis as they are complex parameters containing variables already included in the analysis.
In the present study we considered the definitions and criteria of the variables previously indicated in this journal. 22 It was also considered that the study subjects suffered from the syndromes or diseases analysed if their respective diagnoses or related codes from the International Classification of Primary Care 2nd edition27 or the International Classification of Diseases, 9th revision, Clinical Modification,28 were recorded in their clinical records. For the purposes of this study, the following criteria were given specific consideration:
- none-
Abdominal or central obesity: waist circumference≥102 cm in men or≥88 cm in women.29
- none-
Body mass index (BMI)30: weight (kg)/height (m).2 Overweight: BMI 25.0–29.9 kg/m.2 Obesity: BMI≥30 kg/m.2
- none-
Increased waist-height index31: waist circumference (cm)/height (cm)≥0.6.
- none-
Adiposity or body fat index determined by the CUN-BAE formula (Clínica Universitaria de Navarra-Body Adiposity Estimator)25,26: male sex (%) = −44.988+(.503×age)+(3.172 × BMI)−(.026 × BMI2)−(.02×BMI × age)+(.00021 × BMI2 × age); female sex (%) = −44.988+(.503×age)+10.689+(3.353 × BMI)−(.031×BMI2)−(.02×BMI × age)+(.00021 × BMI2 × age). CUN-BAE-overweight: 20%-25% (men); 30%-35% (females); CUN-BAE-obesity:>25% (males);>35% (women).
- none-
Hypercholesterolaemia32 (International Classification of Primary Care 2nd edition: T93. International Classification of Diseases, 9th revision, Clinical Modification: 272.0; 272.2; 272.4): serum total cholesterol concentration (TC)>200 mg/dL, or if the patient was taking cholesterol-lowering drugs.
- none-
HTG32 (International Classification of Diseases, 9th revision, Clinical Modification: 272.1; 272.3): TG serum concentration≥150 mg/dL, or if the patient was taking TG-lowering drugs.
- none-
Low HDL-C:33 serum concentration<40 mg/dL (men) or <50 mg/dL (women).
- none-
Non-HDL-C: 4 difference between serum TC and HDL-C concentrations.
- none-
LDL-C:4 Friedewald’s formula LDL-C = TC–HDL-C − TG/5 (mg/dL). Not determined whether TG≥400 mg/dL.
- none-
Cholesterol bound to very low-density lipoproteins and TG-rich lipoprotein remnants: TC–HDL-C − LDL-C. Not determined whether TG≥400 mg/dL.
- none-
Atherogenic dyslipidaemia:33 HTG with low HDL-C.
- none-
Castelli-I index:34 TC/HDL-C.
- none-
Castelli-II index:34 LDL-C/HDL-C.
- none-
Atherogenic coefficient: Non-HDL-C / HDL-C.
- none-
TG index/HDL-C.
- none-
Atherogenic index of plasma:35 log (TG/HDL-C).
- none-
TG index and glucose:36 Ln [TG (mg/dL)×FPG (mg/dL)/2]
- none-
Albuminuria:37 albumin creatinine ratio≥30 mg/g.
- none-
Low glomerular filtration rate (GFR)37: <60 mL/min/1.73 m2 estimated according to Chronic Kidney Disease EPIdemiology collaboration.
- none-
CKD37: Low GFR and/or albuminuria.
- none-
MS: 2009 IDF/NHLBI/AHA/WHF/IAS/IASO consensus criteria.29
- none-
ASCVD: includes coronary disease, stroke, and peripheral arterial disease. Coronary disease includes ischaemic heart disease, previous acute myocardial infarction, acute coronary syndromes, coronary revascularisation, and other arterial revascularisation procedures. Stroke: includes cerebral vascular accident, cerebral ischaemia or intracranial haemorrhage and transient ischaemic attack. Peripheral arterial disease includes intermittent claudication or ankle brachial index ≤.9.
- none-
CVR: assessment according to recommendations of the European Guidelines,38 using the Systematic Coronary Risk Estimation38 and Systematic Coronary Risk Estimation O.P.39 Extreme CVR:40 patients with ASCVD and MD or CKD.
To compare the HTG prevalence rates determined in the present study, a literature search was performed of the main studies published between 2005 and 2015 on PubMed, Medline, Embase, Google Scholar and Web of Science.
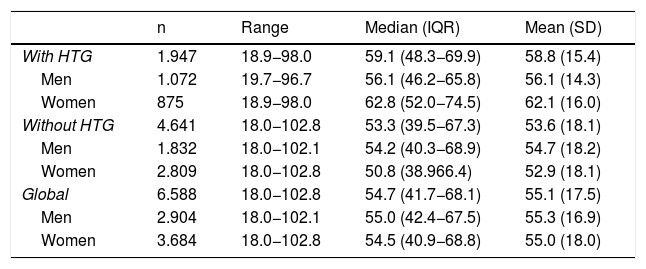
ResultsOf the study population, 55.9 % (95 % CI: 54.7–57.1) were female. The difference in average age between men and women (.3 years) was not significant. The difference in mean ages (5.2 years) between the populations with and without HTG was significant (p < .001). In the population with HTG, the proportion of females was 44.9 % (95 % CI 42.7–47.2), with a significant (p < .001) difference in mean age (6.0 years) between men and women. In the population without HTG, the proportion of females was 60.5 % (95 %CI: 59.1–61.9), the difference in average age (1.8 years) between men and women being significant (p < .001) (Table 1).
Description of age in the study populations.
| n | Range | Median (IQR) | Mean (SD) | |
|---|---|---|---|---|
| With HTG | 1.947 | 18.9−98.0 | 59.1 (48.3−69.9) | 58.8 (15.4) |
| Men | 1.072 | 19.7−96.7 | 56.1 (46.2−65.8) | 56.1 (14.3) |
| Women | 875 | 18.9−98.0 | 62.8 (52.0−74.5) | 62.1 (16.0) |
| Without HTG | 4.641 | 18.0−102.8 | 53.3 (39.5−67.3) | 53.6 (18.1) |
| Men | 1.832 | 18.0−102.1 | 54.2 (40.3−68.9) | 54.7 (18.2) |
| Women | 2.809 | 18.0−102.8 | 50.8 (38.966.4) | 52.9 (18.1) |
| Global | 6.588 | 18.0−102.8 | 54.7 (41.7−68.1) | 55.1 (17.5) |
| Men | 2.904 | 18.0−102.1 | 55.0 (42.4−67.5) | 55.3 (16.9) |
| Women | 3.684 | 18.0−102.8 | 54.5 (40.9−68.8) | 55.0 (18.0) |
SD: standard deviation; HTG: hypertriglyceridaemia; IQR: interquartile range.
The clinical characteristics and lipid profiles of the global study populations, with HTG and without HTG, are shown in Table 2. All parameters evaluated were significantly higher in the population with HTG, except HDL-G and GFR, which were significantly higher in the population without HTG. There was no significant difference in mean DM duration between the populations with and without HTG (Table 2).
Clinical characteristics of the study population.
| [0,2–3]Global | [0,4–5]With HTG | [0,6–7]Without HTG | Difference of means | p | ||||
|---|---|---|---|---|---|---|---|---|
| n | Mean (SD) | n | Mean (SD) | n | Mean (SD) | |||
| BMI (kg/m2) | 6.588 | 27.5 (5.1) | 1.947 | 29.3 (5.0) | 4.641 | 26.8 (5.0) | 2.5 | <.001 |
| Waist circumference (cm) | 6.588 | 93.4 (14.1) | 1.947 | 98.9 (13.2) | 4.641 | 91.0 (13.8) | 7.9 | <.001 |
| Waist-height ratio | 6.588 | 0.57 (0.09) | 1.947 | 0.60 (0.08) | 4.641 | 0.56 (0.09) | 0.04 | <.001 |
| CUN-BAE (%) | 6.588 | 34.7 (8.7) | 1.947 | 36.1 (8.6) | 4.641 | 34.2 (8.7) | 1.9 | <.001 |
| SBP (mmHg) | 6.588 | 121.9 (15.4) | 1.947 | 125.3 (14.6) | 4.641 | 120.5 (15.6) | 4.7 | <.001 |
| DBP (mmHg) | 6.588 | 73.3 (9.8) | 1.947 | 75.4 (9.6) | 4.641 | 72.5 (9.7) | 2.9 | <.001 |
| FPG (mg/dL)a | 6.588 | 96.0 (26.0) | 1.947 | 105.6 (33.5) | 4.641 | 92.0 (20.8) | 13.6 | <.001 |
| eAG (mg/dL)a | 5.233 | 115.1 (25.8) | 1.666 | 123.9 (31.5) | 3.567 | 110.9 (21.4) | 13.0 | <.001 |
| HbA1c (%)b | 5.233 | 5.6 (0.9) | 1.666 | 6.0 (1.0) | 3.567 | 5.5 (0.8) | 0.5 | <.001 |
| Duration of DM (years) | 1.035 | 9.2 (6.8) | 522 | 9.1 (6.3) | 513 | 9.4 (7.4) | −0.3 | .465 |
| ITyG | 6.588 | 8.5 (0.6) | 1.947 | 9.1 (0.5) | 4.641 | 8.2 (0.4) | 0.9 | <.001 |
| CT (mg/dL)c | 6.588 | 192.8 (39.3) | 1.947 | 203.8 (42.8) | 4.641 | 188.1 (36.8) | 15.7 | <.001 |
| TG (mg/dL)d | 6.588 | 120.5 (83.2) | 1.947 | 199.0 (112.8) | 4.641 | 87.6 (28.6) | 111.4 | <.001 |
| HDL-C (mg/dL)c | 6.588 | 54.8 (14.7) | 1.947 | 47.8 (12.7) | 4.641 | 57.8 (14.5) | −10.0 | <.001 |
| LDL-C (mg/dL)c | 6.526 | 114.2 (34.5) | 1.885 | 117.4 (38.1) | 4.641 | 112.8 (32.8) | 4.6 | <.001 |
| VLDLandR (mg/dL)c | 6.526 | 22.9 (12.3) | 1.885 | 35.8 (14.2) | 4.641 | 17.5 (5.7) | 18.3 | <.001 |
| Non-HDL-C (mg/dL)c | 6.588 | 137.9 (38.4) | 1.947 | 156.0 (41.0) | 4.641 | 130.3 (34.6) | 25.7 | <.001 |
| CT/ HDL-C | 6.588 | 3.7 (1.1) | 1.947 | 4.5 (1.3) | 4.641 | 3.4 (0.9) | 1.1 | <.001 |
| Non-HDL-C /HDL-C | 6.588 | 2.7 (1.1) | 1.947 | 3.5 (1.3) | 4.641 | 2.4 (0.9) | 1.1 | <.001 |
| LDL-C/HDL-C | 6.526 | 2.2 (0.9) | 1.885 | 2.6 (1.0) | 4.461 | 2.1 (0.8) | 0.5 | <.001 |
| TG/HDL-C | 6.588 | 2.6 (2.6) | 1.947 | 4.6 (3.8) | 4.641 | 1.6 (0.8) | 3.0 | <.001 |
| AIP | 6.588 | −0.07 (0.29) | 1.947 | 0.23 (0.24) | 4.641 | −0.19 (0.21) | 0.42 | <.001 |
| Uric acid (mg/dL) | 6.168 | 5.0 (1.5) | 1.849 | 5.5 (1.5) | 4.319 | 4.8 (1.4) | 0.7 | <.001 |
| AST (U/l) | 4.812 | 23.1 (43.2) | 1.448 | 24.8 (21.1) | 3.364 | 22.3 (49.7) | 2.5 | <.001 |
| ALT (U/l) | 6.413 | 24.9 (16.9) | 1.899 | 30.1 (20.3) | 4.514 | 22.7 (14.8) | 7.4 | <.001 |
| GGT (U/l) | 6.075 | 33.4 (50.8) | 1.788 | 47.8 (12.7) | 4.287 | 27.3 (36.1) | 20.5 | <.001 |
| Creatinine (mg/dL) | 6.588 | 0.84 (0.29) | 1.947 | 0.90 (0.34) | 4.641 | 0.82 (0.27) | 0.08 | <.001 |
| eGFR (mL/min/1.73 m2) | 6.588 | 90.6 (20.5) | 1.947 | 85.9 (20.1) | 4.641 | 92.5 (20.4) | −6.6 | <.001 |
| Albuminuria (mg/g) | 4.451 | 14.7 (55.5) | 1.447 | 20.3 (77.9) | 3.004 | 12.1 (40.3) | 8.2 | <.001 |
ALT: alanine aminotransferase; AST: aspartate aminotransferase; HDL-C: cholesterol bound to high density lipoproteins; LDL-C: cholesterol bound to low density lipoproteins; Non-HDL-C: cholesterol not bound to high density lipoproteins; TC: total cholesterol; CUN-BAE: body fat index (Clínica Universitaria of Navarra-Body Adiposity Estimator); SD: standard deviation; DM: diabetes mellitus; eGFR: estimated glomerular filtration rate according to CKD-EPI; GGT: Gamma-glutamyl transferase; eAG: estimated average glucose; FPG: fasting plasma glucose; HbA1c: A1c glycosylated haemoglobin; HTG: hypertriglyceridaemia; AIP: atherogenic index of plasma [log (TG/HDL-C)]; BMI: body mass index; TyGI: triglyceride glucose index; DBP: diastolic blood pressure; SBP: systolic blood pressure; TG: triglycerides; VLDLandR: cholesterol bound to very low density lipoproteins and triglyceride-rich lipoprotein remnants.
Of the HTG population, 47.1 % (95 % CI 44.9–49.3) were on hypolipidaemic drug treatment. Of the population with HTG, 63.9 % (95 % CI, 61.8–66.1) had TG concentrations<200 mg/dL, and 23.3 % (95 % CI, 21.4–25.1) had TG concentrations<150 mg/dL.
In the study population, the mean (SD) TG was significantly higher (p < .001) in the men (135.7 [100.6] mg/dL) than in the women (108.6 [63.8] mg/dL). The geometric means and medians of TG were respectively: 104.2 and 101 mg/dL in the global population; 116.0 and 111 mg/dL in the male population; and 95.7 and 93 mg/dL in the female population.
In the population with HTG, the mean (SD) TG was significantly higher (p < .001) in the men (210.0 [131.6] mg/dL) than in the women (185.6 [82.4] mg/dL). The geometric and median TG were respectively: 180.6 and 176 mg/dL in the global population; 187.8 and 182 mg/dL in the male population; and 172.2 and 169 mg/dL in the female population.
In the population without HTG, the mean (SD) TG was significantly higher (p < .001) in the men (92.2.0 [28.3] mg/dL) than in the women (84.6.6 [28.3] mg/dL). The geometric means and medians of TG were respectively: 82.7 and 85 mg/dL in the global population; 87.6 and 92 mg/dL in the male population; and 79.7 and 82 mg/dL in the female population.
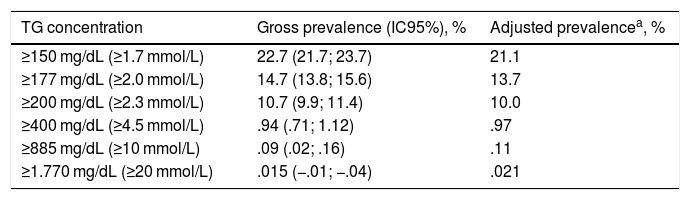
The gross and age- and sex-adjusted prevalence rates of the different types of GT are shown in Table 3. The crude prevalence of HTG was 29.6% (95%CI: 28.4–30.7), with a significant (p < .001) difference between the males (36.9% [95%CI: 35.2–38.7]) and the females (23.8 % [95%CI: 22.4–25.1]). The age- and sex-adjusted prevalence rates of HTG were slightly lower (Fig. 1).
Hypertriglyceridaemia prevalence rates in the study population.
| TG concentration | Gross prevalence (IC95%), % | Adjusted prevalencea, % |
|---|---|---|
| ≥150 mg/dL (≥1.7 mmol/L) | 22.7 (21.7; 23.7) | 21.1 |
| ≥177 mg/dL (≥2.0 mmol/L) | 14.7 (13.8; 15.6) | 13.7 |
| ≥200 mg/dL (≥2.3 mmol/L) | 10.7 (9.9; 11.4) | 10.0 |
| ≥400 mg/dL (≥4.5 mmol/L) | .94 (.71; 1.12) | .97 |
| ≥885 mg/dL (≥10 mmol/L) | .09 (.02; .16) | .11 |
| ≥1.770 mg/dL (≥20 mmol/L) | .015 (−.01; −.04) | .021 |
95%CI: lower and upper limits of 95% confidence interval; TG: triglycerides.
 prevalence by age and sex of adult hypertriglyceridaemia in the Spanish population of 2015. n: number of cases; N: sample size.")
Gross and adjusted (asterisk) prevalence by age and sex of adult hypertriglyceridaemia in the Spanish population of 2015. n: number of cases; N: sample size.
The distribution of HTG prevalence rates by ten-year age group was adjusted (determination coefficient R2 = .93) to the following polynomial function: y = −.0147x2 + .1521x − .0333 (Fig. 2). The prevalence of HTG increased continuously with age, from the third to the sixth decade in the men and from the third to the eighth decade in the women, and then decreased. The male population had significantly higher prevalence rates of HTG than the female population in all age groups, except in the 70–79 age group, where the difference was not significant, and in the age group ≥80, where the prevalence of HTG was slightly higher in the female population.

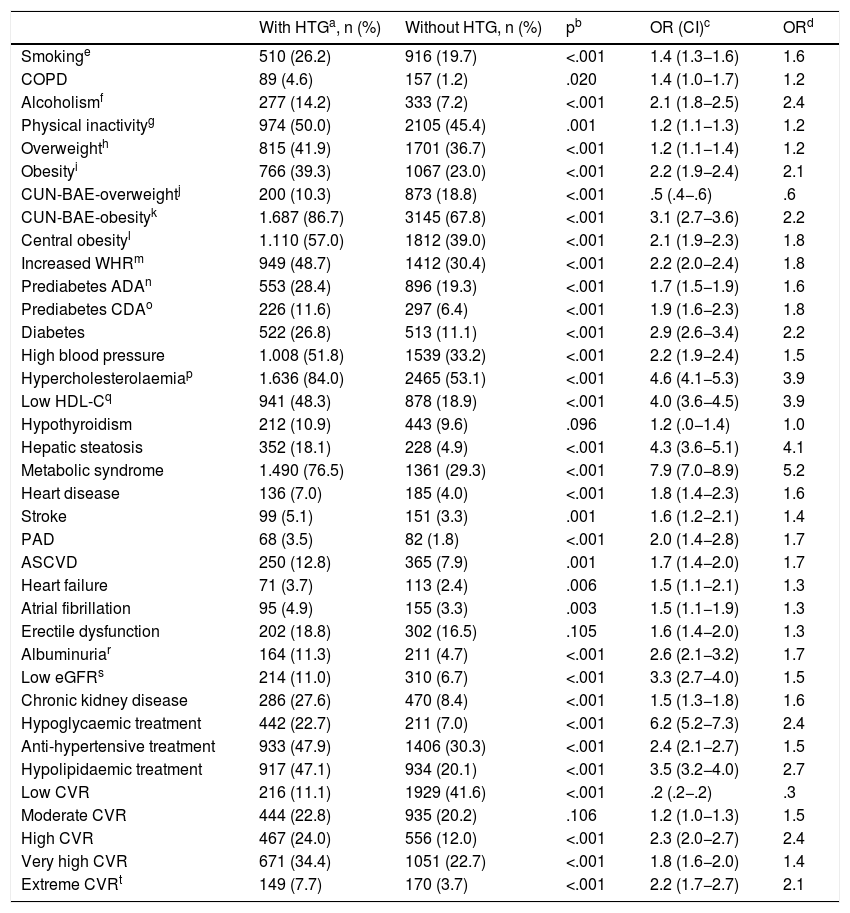
The ORs for the comorbidities assessed among the populations with and without HTG are shown in Table 4. All comorbidities were significantly associated with HTG, except hypothyroidism and erectile dysfunction. The variables that showed a greater association with HTG were CUN-BAE,25,26 DM, MS,29 hepatic steatosis, hypercholesterolaemia, low HDL-C, low GFR and albuminuria. Hypoglycaemic, hypolipidaemic and antihypertensive therapy, and high, very high and extreme CVR were associated more with the population with HTG. Low CVR was significantly more associated with the population without HTG. Of the patients with HGT, 42.1% (95% CI 39.9%–44.3%) had very high or extreme CVR (OR 2.0 [95% CI 1.8–2.3]). The result of the multivariate analysis of the independent factors significantly associated with HTG is shown in Table 5.
Associated comorbidity in the populations with and without hypertriglyceridaemia.
| With HTGa, n (%) | Without HTG, n (%) | pb | OR (CI)c | ORd | |
|---|---|---|---|---|---|
| Smokinge | 510 (26.2) | 916 (19.7) | <.001 | 1.4 (1.3−1.6) | 1.6 |
| COPD | 89 (4.6) | 157 (1.2) | .020 | 1.4 (1.0−1.7) | 1.2 |
| Alcoholismf | 277 (14.2) | 333 (7.2) | <.001 | 2.1 (1.8−2.5) | 2.4 |
| Physical inactivityg | 974 (50.0) | 2105 (45.4) | .001 | 1.2 (1.1−1.3) | 1.2 |
| Overweighth | 815 (41.9) | 1701 (36.7) | <.001 | 1.2 (1.1−1.4) | 1.2 |
| Obesityi | 766 (39.3) | 1067 (23.0) | <.001 | 2.2 (1.9−2.4) | 2.1 |
| CUN-BAE-overweightj | 200 (10.3) | 873 (18.8) | <.001 | .5 (.4−.6) | .6 |
| CUN-BAE-obesityk | 1.687 (86.7) | 3145 (67.8) | <.001 | 3.1 (2.7−3.6) | 2.2 |
| Central obesityl | 1.110 (57.0) | 1812 (39.0) | <.001 | 2.1 (1.9−2.3) | 1.8 |
| Increased WHRm | 949 (48.7) | 1412 (30.4) | <.001 | 2.2 (2.0−2.4) | 1.8 |
| Prediabetes ADAn | 553 (28.4) | 896 (19.3) | <.001 | 1.7 (1.5−1.9) | 1.6 |
| Prediabetes CDAo | 226 (11.6) | 297 (6.4) | <.001 | 1.9 (1.6−2.3) | 1.8 |
| Diabetes | 522 (26.8) | 513 (11.1) | <.001 | 2.9 (2.6−3.4) | 2.2 |
| High blood pressure | 1.008 (51.8) | 1539 (33.2) | <.001 | 2.2 (1.9−2.4) | 1.5 |
| Hypercholesterolaemiap | 1.636 (84.0) | 2465 (53.1) | <.001 | 4.6 (4.1−5.3) | 3.9 |
| Low HDL-Cq | 941 (48.3) | 878 (18.9) | <.001 | 4.0 (3.6−4.5) | 3.9 |
| Hypothyroidism | 212 (10.9) | 443 (9.6) | .096 | 1.2 (.0−1.4) | 1.0 |
| Hepatic steatosis | 352 (18.1) | 228 (4.9) | <.001 | 4.3 (3.6−5.1) | 4.1 |
| Metabolic syndrome | 1.490 (76.5) | 1361 (29.3) | <.001 | 7.9 (7.0−8.9) | 5.2 |
| Heart disease | 136 (7.0) | 185 (4.0) | <.001 | 1.8 (1.4−2.3) | 1.6 |
| Stroke | 99 (5.1) | 151 (3.3) | .001 | 1.6 (1.2−2.1) | 1.4 |
| PAD | 68 (3.5) | 82 (1.8) | <.001 | 2.0 (1.4−2.8) | 1.7 |
| ASCVD | 250 (12.8) | 365 (7.9) | .001 | 1.7 (1.4−2.0) | 1.7 |
| Heart failure | 71 (3.7) | 113 (2.4) | .006 | 1.5 (1.1−2.1) | 1.3 |
| Atrial fibrillation | 95 (4.9) | 155 (3.3) | .003 | 1.5 (1.1−1.9) | 1.3 |
| Erectile dysfunction | 202 (18.8) | 302 (16.5) | .105 | 1.6 (1.4−2.0) | 1.3 |
| Albuminuriar | 164 (11.3) | 211 (4.7) | <.001 | 2.6 (2.1−3.2) | 1.7 |
| Low eGFRs | 214 (11.0) | 310 (6.7) | <.001 | 3.3 (2.7−4.0) | 1.5 |
| Chronic kidney disease | 286 (27.6) | 470 (8.4) | <.001 | 1.5 (1.3−1.8) | 1.6 |
| Hypoglycaemic treatment | 442 (22.7) | 211 (7.0) | <.001 | 6.2 (5.2−7.3) | 2.4 |
| Anti-hypertensive treatment | 933 (47.9) | 1406 (30.3) | <.001 | 2.4 (2.1−2.7) | 1.5 |
| Hypolipidaemic treatment | 917 (47.1) | 934 (20.1) | <.001 | 3.5 (3.2−4.0) | 2.7 |
| Low CVR | 216 (11.1) | 1929 (41.6) | <.001 | .2 (.2−.2) | .3 |
| Moderate CVR | 444 (22.8) | 935 (20.2) | .106 | 1.2 (1.0−1.3) | 1.5 |
| High CVR | 467 (24.0) | 556 (12.0) | <.001 | 2.3 (2.0−2.7) | 2.4 |
| Very high CVR | 671 (34.4) | 1051 (22.7) | <.001 | 1.8 (1.6−2.0) | 1.4 |
| Extreme CVRt | 149 (7.7) | 170 (3.7) | <.001 | 2.2 (1.7−2.7) | 2.1 |
ADA: American Diabetes Association; HDL-C: Cholesterol bound to high density lipoproteins; CDA: Canadian Diabetes Association; CUN-BAE: Body fat index (Clínica Universitaria of Navarra-Body Adiposity Estimator); PAD: Peripheral artery disease; ASCVD: Atherosclerotic cardiovascular disease; COPD: Chronic obstructive pulmonary disease; eGFR: Estimated glomerular filtration rate according to CKD-EPI; HTG: hypertriglyceridaemia; WHR: Waist-height ratio; CVR: Cardiovascular risk.
Independent factors associated with hypertriglyceridaemia.
| βa | Waldb | pc | OR Exp(β)d | |
|---|---|---|---|---|
| Hypercholesterolaemiae | 1.52 (.08) | 399.0 | <.001 | 4.6 (3.9−5.3) |
| Low HDL-Cf | 1.40 (.07) | 429.0 | <.001 | 4.1 (3.6−4.6) |
| Hepatic steatosis | 1.01 (.10) | 97.5 | <.001 | 2.8 (2.3−3.4) |
| Diabetes | .67 (.08) | 63.4 | <.001 | 2.0 (1.7−2.3) |
| Obesityg | .64 (.09) | 56.5 | <.001 | 1.9 (1.6−2.2) |
| Alcoholismh | .53 (.10) | 25.6 | <.001 | 1.7 (1.4−2.1) |
| Overweighti | .49 (.08) | 37.1 | <.001 | 1.6 (1.4−1.9) |
| Prediabetes ADAj | .43 (.08) | 32.9 | <.001 | 1.5 (1.3−1.8) |
| Smokingk | .38 (.08) | 25.1 | <.001 | 1.5 (1.3−1.7) |
| Intersection | −10.9 (.42) | 677.7 | <.001 | NA |
ADA: American Diabetes Association; HDL-C: cholesterol bound to high density lipoproteins; NA: not applicable.
This study updates the information on the prevalence of HTG and average values of TG in the adult population, offering intermediate results between those published by other national and international studies. Some countries such as the United States, Germany or China preferred to use geometric means to show the central trend in TG values, as these are less sensitive to extreme values than arithmetic means. In the present study, the geometric mean of TG (104 mg/dL) was lower than the arithmetic mean of TG (121 mg/dL). The geometric means of TG of the adult population of the United States1,41 and Germany21 were 107 and 111 mg/dL, respectively, being slightly higher than those of the SIMETAP-HTG study. The average TG in France42 (121 mg/dL) was similar to that of the present study. The adjusted prevalence of HTG>200 mg/dL in Korea43,44 (9.8%) was similar to that of the present study. The adjusted prevalence rates of HTG of the SIMETAP-HTG study and its mean TG concentrations were lower than those determined in the following countries: Mexico,45 prevalence 31.5%; mean TG 140 mg/dL; China,46 geometric mean TG 139 mg/dL. India,47 prevalence 36.9%, mean TG 163 mg/dL (men) and 144 mg/dL (women).
The means of TG and adjusted prevalence rates of HTG in this study were slightly higher than those of other research studies in Spain,48–57 except for the CORSAIB58 study, which showed a mean of TG of 131 mg/dL in the population>35 of the Balearic Islands, and the CDC cohort in the Canary Islands,59 which showed mean of TG of 141 mg/dL (men) and 108 mg/dL (women). The GEVA48 group determined an average TG of 117 mg/dL in the population of Albacete, and a prevalence of HTG of 19.3%. The DINO49 project determined an average TG of 109 mg/dL in the population of Murcia. The HERMEX50 study determined a geometric mean TG of 96 mg/dL in the Badajoz population>25 years. In the Navarra population>35 years,51 the mean TG were 132 mg/dL (men) and 98 mg/dL (women), and the prevalence of HTG was 22.6% and 9.1%, respectively. In the population between 35 and 74 years old in Gerona, REGICOR52 researchers determined a prevalence of HTG>200 mg/dL of 13.6% (men) and 4.6% (women). In the population of the Community of Madrid between 30 and 74 years, the PREDIMERC53 study showed a prevalence of HTG of 8.8%, and the MADRIC54 study showed a prevalence of HTG of 21.0% in the population aged between 30 and 70 years. The ENRICA55 study determined a prevalence of HTG of 17.4% and an average TG of 108 mg/dL in the Spanish population, excluding patients with TG>400 mg/dL. The di@bet.es56 study showed a prevalence of HTG of 21.5% (men: 29.5%; women: 15.5%). The DARIOS57 study analysed 11 studies carried out in Spain with populations between 35 and 74 years old, showing a mean TG of 142 mg/dL (men) and 108 mg/dL (women), similar to those of the present study (136 and 109 mg/dL, respectively).
The socioeconomic or cultural differences, the different concept of HTG or the exclusion of populations <35 or >70 years, or with TG >400 mg/dL, can justify the variability of the results shown. The differences diminish when the study is extended to the entire adult population, prevalence rates are adjusted, or other measures of centralisation are offered as medians or geometric means. The prevalence of HTG is strongly influenced by age and sex. In the present study, one-fifth of the female population is affected by HTG, and more than one-third of the male population. The prevalence of HTG increases with age until the 50 s and then declines. There are significant differences in favour of the male population in all age groups until the 70 s, when it becomes equal, and higher in the female population thereafter. HTG prevalence is also significant in the populations<30 years (13%) and>80 years (30%), and therefore it would be advisable to include them in HTG prevalence studies.
The prevalence rates of severe and very severe HTG shown in the present study (Table 2) were similar to those published in other papers.16–19
The Castelli-I index34 (TC/HDL-C) has been considered a more sensitive and specific index of risk of coronary disease than TC in individuals with HTG. It has been associated with greater risk60 when it is ≥4. In the population with HTG, the TC/HDL-C index was 4.5, which shows that the risk was high. The atherogenic coefficient (non-HDL-C /HDL-C) reflects the atherogenic potential of ApoB12-containing lipoproteins. This coefficient was significantly higher in the population with HTG, which points to a higher atherogenic load. According to Dobiasova,35 plasma atherogenic index values between −.3 and .11 are associated with low risk of atherosclerosis; between .1 and .21, with moderate risk; and >.21, with high risk.61 The plasma atherogenic index of the population with HTG was .23, which also shows that the risk was high. The TyG insulin resistance index36 was significantly higher in the population with HTG, as they had higher concentrations of glucose and TG (Table 2).
Lipid metabolism could explain why hypercholesterolaemia and low HDL-C are strongly associated with HTG. MS was the comorbidity with the highest association with HTG, as HTG and low HDL-C were included in its definition. Liver steatosis, DM, pre-diabetes and alcoholism were also significantly associated with HTG, both in the univariate and the multivariate analysis (Tables 4 and 5), probably because liver fat content and plasma glucose correlate with the production of very low density lipoproteins, TG and ApoB.62 The increased association with hepatic steatosis could explain the significantly higher concentrations of transaminases in the HTG population (Table 2).
Hypercholesterolaemia, high blood pressure and DM were associated with the HTG population, which may explain anti-diabetic, hypolipidaemic and antihypertensive therapies being associated more in the HTG population. Increased waist-height index, abdominal obesity, overweight, obesity and adiposity (as measured by the body fat index CUN-BAE-obesity25,26) were significantly associated with HTG, although only obesity and overweight were independent factors associated with HTG (Tables 4 and 5).
The variables involving renal function (reduced eGFR, albuminuria) were significantly associated with HTG, although they were not significant in the multivariate analysis (Tables 4 and 5).
The Hypertriglyceridaemia Registry of the Spanish Society of Arteriosclerosis63 included 1182 patients selected in the Lipid Units of this society, with HTG ≥200 mg/dL. The means of TG in the Register of the Spanish Society of Arteriosclerosis63 were higher than those of the present study, although the prevalence of comorbidities associated with HTG (high blood pressure, DM, MS, coronary disease) was quite similar in both studies.
Of the HTG population in the SIMETAP-HTG study, 66% had high or very high/extreme CVR. The greater association with HTG of high blood pressure, smoking, DM, obesity, MS, hypercholesterolaemia and ASCVD could explain their close association with high CVR (OR: 2.3) and very high/extreme CVR (OR: 2.0).
The main limitations of the present study were the inability of a cross-sectional study to determine causality and possible under-diagnosis by excluding pregnant women and terminal, institutionalised or cognitively impaired patients as per protocol. The age and sex variables were not used in the multivariate analysis because they were strongly associated with CVRFs, cardiovascular or metabolic diseases, to highlight the independent cardiometabolic variables that could be associated with HTG. Furthermore, the researchers had to collect information on the most recent biochemical parameters determined in the analyses carried out over the last year, so that the cross-sectional observation carried out could have been influenced by the diseases that the participants were suffering from at that time, and by their treatments. When comparing the hypolipidaemic treatment variable, there is a significant difference between the populations with and without HTG, and therefore it is plausible that the prevalence of HTG could be somewhat higher if the population with HTG was not under the influence of hypolipidaemic therapy, a circumstance that cannot be avoided ethically in this observational study.
One of the strengths of the present study was the random selection of the study subjects on a population basis, a large sample that included people aged between 18 and 102 years, while other studies in the same field exclude the population <35 years and >70 years. Also noteworthy are the presentation of TG values with various measures of centralisation, small differences between gross and adjusted prevalence rates of HTG (2.3% in the male population and 2.4% in the female population), and the evaluation of the possible association between HTG and numerous CVRFs, CKD, metabolic diseases and ASCVD. Given that HTG is influenced by sex and age variables, another strength of this study is the global and sex-based description of HTG prevalence rates in all adult ten-year age groups, and the presentation with age- and sex-adjusted rates to be able to compare with other populations.
The high prevalence of HTG has serious socioeconomic and health consequences by increasing cardiovascular morbidity and mortality. Assessing the prevalence of HGT is especially important to better plan cardiovascular prevention intervention policies, optimizing available health resources and improving the medical care and quality of life of patients with HGT. Given the progression in the prevalence of obesity, DM and, simultaneously, HTG in recent years, the need for further epidemiological studies aimed at the entire population is clear, and in this regard, we hope this study will contribute towards improving epidemiological knowledge of HTG and assessing the importance of the association between HTG and ASCVD.
ConclusionsStudies on testing for mean TG concentrations and prevalence rates of HTG in the adult population show highly variable results. The SIMETAP-HTG study confirms intermediate results with respect to previous studies. The mean TG concentrations in the adult population in this study were lower than those in Mexico, China, and India, and similar to those in the United States, Korea, Germany, and France. The adjusted prevalence rates of TG were lower than those obtained in the Balearic Islands and the Canary Islands, and slightly higher than those of other studies conducted in Spain.
The present study also reinforces the idea that the prevalence of HTG in the adult population is highly influenced by the variables of sex and age, and therefore it is necessary to adjust the results by these variables. It shows that one-fifth of the adult female population and more than one-third of the adult male population had HTG, and that prevalence increases through life up to the fifth decade. The prevalence of HTG is higher in the male population up to the 6th decade, is equal in the 7th, and is higher in the female population thereafter.
The SIMETAP-HTG study shows that the cardiometabolic factors related to HTG were DM, pre-diabetes, hepatic steatosis, overweight and obesity. It also shows that the elevation of atherogenic indices in the lipid profile demonstrates that HTG is associated with higher atherogenic potential and higher risk of ASCVD. The present study highlights that the lipid parameters most strongly associated with HTG were hypercholesterolaemia and low HDL-C concentration.
FundingFunding of the SIMETAP study (Grant Code: 05/2010RS) was approved in accordance with Order 472/2010, of 16 September, of the Regional Ministry of Health, approving the regulatory bases and the call for grants for 2010 of the Pedro Laín Entralgo Agency for Training, Research and Health Studies of the Community of Madrid, for the implementation of research projects in the field of health outcomes in primary care.
Conflict of interestsThe authors have no conflict of interests to declare.
We would like to thank the following doctors who participated in the SIMETAP Study Research Group: C. Abad Schilling, M. Adrián Sanz, P. Aguilera Reija, A. Alcaraz Bethencourt, R. Alonso Roca, R. Álvarez Benedicto, E. Arranz Martínez, P. Arribas Álvaro, M.C. Baltuille Aller, E. Barrios Rueda, E. Benito Alonso, M.L. Berbil Bautista, J.M. Blanco Canseco, N. Caballero Ramírez, P. Cabello Igual, R. Cabrera Vélez, M.P. Calderín Morales, M. Capitán Caldas, T.F. Casaseca Calvo, J.A. Cique Herráinz, C. Ciria de Pablo, P. Chao Escuer, G. Dávila Blázquez, N. de la Peña Antón, L. de Prado Prieto, M.J. del Villar Redondo, S. Delgado Rodríguez, M.C. Díez Pérez, M.R. Durán Tejada, N. Escamilla Guijarro, R.A. Escrivá Ferrairó, T. Fernández Vicente, D. Fernández-Pacheco Vila, M.J. Frías Vargas, J.C. García Álvarez, M.E. García Fernández, M.P. García Alcañiz, M.D. García Granado, R.A. García Pliego, M.R. García Redondo, M.P. García Villasur, E. Gómez Díaz, O. Gómez Fernández, P. González Escobar, J.A. González-Posada Delgado, I. Gutiérrez Sánchez, M.I. Hernández Beltrán, M.C. Hernández de Luna, R.M. Hernández López, Y. Hidalgo Calleja, M.S. Holgado Catalán, M.P. Hombrados Gonzalo, R. Hueso Quesada, A.M. Ibarra Sánchez, J.R. Iglesias Quintana, I. Íscar Valenzuela, N. Iturmendi Martínez, A.P. Javierre Miranda, B. López Uriarte, M.S. Lorenzo Borda, S. Luna Ramírez, A.I. Macho del Barrio, P. Magán Tapia, N. Marañón Henrich, J.E. Mariño Suárez, M.C. Martín Calle, A.I. Martín Fernández, E. Martínez Cid de Rivera, J. Martínez Irazusta, A. Migueláñez Valero, M.E. Minguela Puras, A. Montero Costa, C. Mora Casado, L.E. Morales Cobos, M.R. Morales Chico, J.C. Moreno Fernández, M.S. Moreno Muñoz, D. Palacios Martínez, T. Pascual Val, M. Pérez Fernández, R. Pérez Muñoz, M.T. Plata Barajas, R. Pleite Raposo, M. Prieto Marcos, J.L. Quintana Gómez, S. Redondo de Pedro, M. Redondo Sánchez, J. Reguillo Díaz, B. Remón Pérez, E. Revilla Pascual, A.M. Rey López, C. Ribot Catalá, M.R. Rico Pérez, M. Rivera Teijido, R. Rodríguez Cabanillas, A. Rodríguez de Cossío, E. Rodríguez de Mingo, A.O. Rodríguez, A. Rosillo González, M. Rubio Villar, L. Ruiz Díaz, A. Ruiz García, A. Sánchez Calso, M. Sánchez Herráiz, M.C. Sánchez Ramos, P.L. Sanchidrián Fernández, E. Sandín de Vega, B. Sanz Pozo, C. Sanz Velasco, M.T. Sarriá Sánchez, P. Simonaggio Stancampiano, I. Tello Meco, C. Vargas-Machuca Cabañero, J.L. Velazco Zumarrán, M.C. Vieira Pascual, C. Zafra Urango, M.M. Zamora Gómez, N. Zarzuelo Martín.
Please cite this article as: Ruiz-García A, Arranz-Martínez E, López-Uriarte B, Rivera-Teijido M, Palacios-Martínez D, Dávila-Blázquez GM et al. Prevalencia de hipertrigliceridemia en adultos y factores cardiometabólicos asociados. Estudio SIMETAP-HTG. Clin Investig Arterioscler. 2020. https://doi.org/10.1016/j.arteri.2020.04.001