


Congenital malformations (CM), also known as birth defects or congenital anomalies, are structural and functional alterations that occur during the intrauterine life and can be identified in the prenatal period, at birth or later in life. These alterations affect significantly infant morbidity and mortality. The World Health Organization estimates that around 210,358 deaths occur during the first 28 days of life because of CM worldwide.1
In Mexico, from 1990 to 2014, the percentage of CM mortality in infants (under one year of age) was 10.9% in 1990 (7,127 deaths), 18.7% in 2000 (7,212 deaths), 22.4% in 2010 (6,477 deaths), and 25.5% in 2014 (6,719 deaths).2 In 2010, CMs ranked second among the main causes of infant mortality.3 In relation to the infant mortality rate, CMs have a continuous decrease with rates of 27 in 1990, 16 in 2000,15 in 2010,4 and 12.1 in 2014,2 for every 1,000 children born alive. During 2014, 4,015 neonatal (59.8%)4 and 2,704 post neonatal (40.2%) deaths due to CM were registered.
The Center for Disease Control and Prevention defines Public Health as the science that protects and improves the health of families and communities through education, policies, services, and research, oriented to protect the health of individuals in their community and country. To achieve these objectives, it is based on epidemiology; particularly, in epidemiological surveillance.1
Through the observation of the behavior of frequencies, the epidemiological surveillance of the different CMs allows health professionals to be alert in case of a change in the trends, and thus take action if necessary.1
CM and genetic diseases prevention are essential to reduce infant morbidity and mortality.
An international consensus exists with the purpose of reducing the occurrence of CM through the development of epidemiologic surveillance programs, which seek to estimate prevalences, generate actions and allocate adequate resources for their attention.1 Among these programs, collaborative projects in which several countries participate exist: The International Clearinghouse for Birth Defects Surveillance and Research (ICBDSR)5 and the European Surveillance of Congenital Anomalies (EUROCAT).6
The ICBDSR project has international coverage. It started in 1974, on Helsinki, Finland, and currently has 43 countries as members of the program. Its main objective is to monitor and prevent CM.1
In 1979, EUROCAT started with a record of more than 1.7 million births per year. Currently, it includes 21 countries and covers 29% of the European population. One of its main objectives is to evaluate the effectiveness of primary prevention in the health systems.6
Data collection methodology used by the participating countries is different in both projects. Sources of information are from national births databases to hospital records sample or reports from isolated studies.5
In Mexico, since 1988, the Ministry of Health (SSA, for its Spanish acronym), through the General Directorate of Epidemiology, reported that neural tube defects are under epidemiological surveillance.7 Similarly, in 1978, the register and monitoring of external birth defects (RYVEMCE, for its Spanish acronym) started, which is an ICBDSR member since 1980. The information is obtained from 21 hospitals in 11 Mexican cities and covers approximately 3.5% of the annual number of births in the country, including stillbirths of 20 or more weeks of gestation or at least 500g at birth.8
Currently, two sources of official information with national coverage are available: birth certificates (BC) and fetal death certificates (FDC), through the National Health Information System (SINAIS, for its Spanish acronym), General Directorate of Health Information (DGIS, for its Spanish acronym), SSA. These free access certificates allow the CM periodically monitoring and at different levels of political-administrative disaggregation. With the purpose of conducting this monitoring with an annual periodicity, the prevalence of the primary CMs at a national level are presented based on the data from both certificates, with the main objectives of observing the trends and evaluating the effectiveness of primary prevention in the health system over time.
In Mexico, from September 2007—after more than a decade of interinstitutional work coordinated by the DGIS—the SSA established the BC as the unique national format, free, mandatory, individual, and non-transferable, which notes a live birth and its circumstances. Also, it is a requisite for the registration of birth on the Mexican registry office.9
Simultaneously to the BC, the Birth Information System (SINAC, for its Spanish acronym) was instituted as part of SINAIS, with the purpose of integrating and disseminating the statistics obtained from the information in the format, and to regulate and monitor the respective operative processes.
The information from this system has been endorsed by the National Institute of Statistics and Geography (INEGI, for its Spanish acronym) in the publication of the Mexican official journal (DOF, for its Spanish acronym) on May 23, 2013. Furthermore, this implied that health indicators included information about live births (maternal mortality ratio, infant mortality rate and vaccination coverage of children under one year of age), by obligatory nature, must be estimated with information from the SINAC.9
About the FDC, in the DOF of March 2, 1956, the agreement postulating that death certificates and FDC must be submitted and take effect to the judicial and administrative authorities of the Republic was published and must be subjected to the text of the corresponding models (registration formats).10 The databases of these registries are currently elaborated by the INEGI.
The usefulness of the information coming from the databases of BC and FDC has been validated by different studies. Among their primary results, it has been shown that the highest overall prevalence rates for CM by the municipality or by federative entity are concentrated in the central and southwestern part of the country.11 A very similar trend is displayed by malformations due to multifactorial inheritance12 and malformations of the cardiovascular system.13
2MethodsThe coverage of birth certificates is estimated at approximately 96% of all live births in Mexico between 2011-2013.
The databases of the two aforementioned information systems (BC and FDC) were used in this paper. Regarding the BC, the following variables were used: first registered diagnosis, gestational age in weeks (WGA), weight of the newborn, maternal age, and federal entity of the maternal habitual residence. As for the FDC, the same variables were used, except the first registered diagnosis, in which case the basic cause of death was used.
The universe of study involved live newborns and fetal deaths from 22 to 45 WGA, with a weight ≥ 500g, and the habitual residence of the mother in Mexico. Percentages and prevalence rates were calculated.
A database for the period 2008-2013 of 12,407,288 births was obtained, in which 99.2% corresponded to live newborns and 0.8% to fetal deaths. For the presentation of the data, the structure of the ICBDSR 5 and the International Statistical Classification of Diseases and Related Health Problems were taken as reference.14
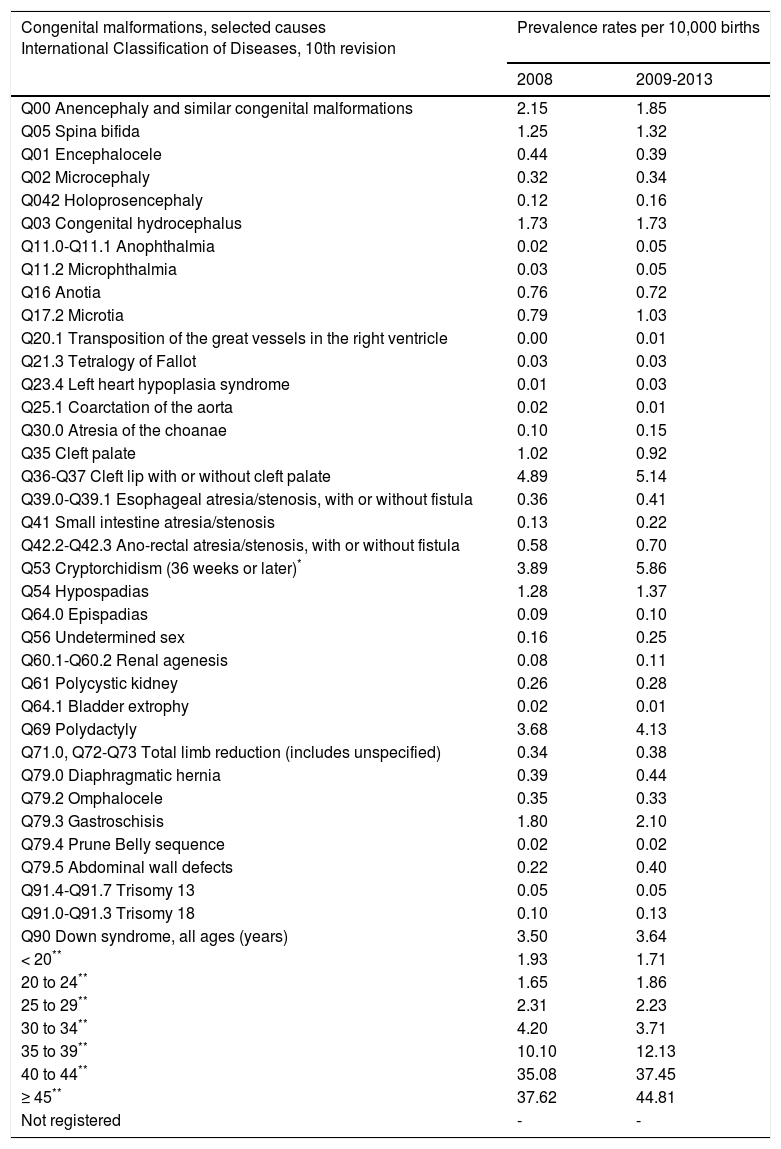
3ResultsThe trend of live births and fetal deaths at the national level remained stable in the period of analysis (2008-2013), with an average of around 2,000,000 births per year (Figure 1). The percentage distribution of births by the mother groups by age showed very important epidemiological changes in adolescents under 20 years old, participating with 20% in 2008 and 20.7% for 2013. The group of 20 to 24 years also presented an ascending trend of 29.6% in 2008 to 30.3% in 2013. In turn, the age groups that decreased were those that are in better conditions of reproduction, such as those from 25 to 29 and from 30 to 34 years (Figure 2). The previous percentage changes were motivated by the Mexican adolescent fecundity increase in recent years.15–18 According to the ICBDSR5 reporting criteria, the main causes of congenital malformation prevalence in Mexico for 2013, in descending order, were the following: cryptorchidism (≥ 36 WGA) with 6.97 per 10,000 births; cleft lip with or without cleft palate, 5.22 per 10,000 births; polydactyly, 4.31 per 10,000 births; Down syndrome, 3.55 per 10,000 births; gastroschisis, 1.91 per 10,000 births (Table 1).18 This trend is identical for the five-year period between 2009-2013 (Table 2).18 Similarly, in descending order: cryptorchidism (≥ 36 WGA) with 5.86 per 10,000 births; cleft lip with or without cleft palate, 5.14 per 10,000 births; polydactyly, 4.13 per 10,000 births; Down syndrome, 3.64 per 10,000 births; and gastroschisis, 2.10 per 10,000 births (Figure 3).18
. Mexico, 2008-2013.")

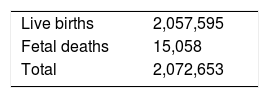
Congenital malformations prevalence rates. Mexico, 2013.
| Live births | 2,057,595 |
| Fetal deaths | 15,058 |
| Total | 2,072,653 |
| Congenital malformations, selected causes International Classification of Diseases 10th review | Number of cases | Rate per 10,000 births | ||
|---|---|---|---|---|
| Live births | Fetal deaths | Total | ||
| Q00 Anencephaly and similar congenital malformations | 97 | 219 | 316 | 1.52 |
| Q05 Spina bifida | 270 | 19 | 289 | 1.39 |
| Q01 Encephalocele | 51 | 8 | 59 | 0.28 |
| Q02 Microcephaly | 53 | 3 | 56 | 0.27 |
| Q042 Holoprosencephaly | 18 | 20 | 38 | 0.18 |
| Q03 Congenital hydrocephalus | 282 | 55 | 337 | 1.63 |
| Q11.0-Q11.1 Anophthalmia | 10 | 0 | 10 | 0.05 |
| Q11.2 Microphthalmia | 6 | 0 | 6 | 0.03 |
| Q16 Anotia | 159 | 0 | 159 | 0.77 |
| Q17.2 Microtia | 264 | 0 | 264 | 1.27 |
| Q20.1 Transposition of the great vessels in the right ventricle | 1 | 0 | 1 | 0.00 |
| Q21.3 Tetralogy of Fallot | 4 | 3 | 7 | 0.03 |
| Q23.4 Left heart hypoplasia syndrome | 3 | 0 | 3 | 0.01 |
| Q25.1 Coarctation of the aorta | 2 | 1 | 3 | 0.01 |
| Q30.0 Atresia of the choanae | 38 | 0 | 38 | 0.18 |
| Q35 Cleft palate | 195 | 2 | 197 | 0.95 |
| Q36-Q37 Cleft lip with or without cleft palate | 1075 | 7 | 1082 | 5.22 |
| Q39.0-Q39.1 Esophageal atresia/stenosis, with or without fistula | 78 | 1 | 79 | 0.38 |
| Q41 Small intestine atresia/stenosis | 41 | 5 | 46 | 0.22 |
| Q42.2-Q42.3 Ano-rectal atresia/stenosis, with or without fistula | 147 | 0 | 147 | 0.71 |
| Q53 Cryptorchidism (36 weeks or later)* | 1392 | 0 | 1392 | 6.97 |
| Q54 Hypospadias | 307 | 0 | 307 | 1.48 |
| Q64.0 Epispadias | 2. 3 | 0 | 2. 3 | 0.11 |
| Q56 Undetermined sex | 65 | 0 | 65 | 0.31 |
| Q60.1-Q60.2 Renal agenesis | 11 | 9 | 20 | 0.10 |
| Q61 Polycystic kidney | 40 | 2. 3 | 63 | 0.30 |
| Q64.1 Bladder extrophy | 3 | 0 | 3 | 0.01 |
| Q69 Polydactyly | 893 | 0 | 893 | 4.31 |
| Q71.0, Q72-Q73 Total limb reduction (includes unspecified) | 76 | 0 | 76 | 0.37 |
| Q79.0 Diaphragmatic hernia | 103 | 3 | 106 | 0.51 |
| Q79.2 Omphalocele | 55 | 9 | 64 | 0.31 |
| Q79.3 Gastroschisis | 353 | 43 | 396 | 1.91 |
| Q79.4 Prune Belly sequence | 3 | 0 | 3 | 0.01 |
| Q79.5 Abdominal wall defects | 86 | 8 | 94 | 0.45 |
| Q91.4-Q91.7 Trisomy 13 | 6 | 7 | 13 | 0.06 |
| Q91.0-Q91.3 Trisomy 18 | 11 | 18 | 29 | 0.14 |
| Q90 Down Syndrome, all ages (years) | 710 | 25 | 735 | 3.55 |
| < 20** | 71 | 2 | 73 | 1.71 |
| 20 to 24** | 94 | 2 | 96 | 1.53 |
| 25 to 29** | 104 | 2 | 106 | 2.15 |
| 30 to 34** | 117 | 4 | 121 | 3.68 |
| 35 to 39** | 173 | 7 | 180 | 11.75 |
| 40 to 44** | 138 | 6 | 144 | 40.12 |
| ≥ 45** | 13 | 1 | 14 | 53.07 |
| Not registered | 0 | 1 | 1 | - |
Congenital malformations prevalence rates. Mexico, 2008-2013.
| Congenital malformations, selected causes International Classification of Diseases, 10th revision | Prevalence rates per 10,000 births | |
|---|---|---|
| 2008 | 2009-2013 | |
| Q00 Anencephaly and similar congenital malformations | 2.15 | 1.85 |
| Q05 Spina bifida | 1.25 | 1.32 |
| Q01 Encephalocele | 0.44 | 0.39 |
| Q02 Microcephaly | 0.32 | 0.34 |
| Q042 Holoprosencephaly | 0.12 | 0.16 |
| Q03 Congenital hydrocephalus | 1.73 | 1.73 |
| Q11.0-Q11.1 Anophthalmia | 0.02 | 0.05 |
| Q11.2 Microphthalmia | 0.03 | 0.05 |
| Q16 Anotia | 0.76 | 0.72 |
| Q17.2 Microtia | 0.79 | 1.03 |
| Q20.1 Transposition of the great vessels in the right ventricle | 0.00 | 0.01 |
| Q21.3 Tetralogy of Fallot | 0.03 | 0.03 |
| Q23.4 Left heart hypoplasia syndrome | 0.01 | 0.03 |
| Q25.1 Coarctation of the aorta | 0.02 | 0.01 |
| Q30.0 Atresia of the choanae | 0.10 | 0.15 |
| Q35 Cleft palate | 1.02 | 0.92 |
| Q36-Q37 Cleft lip with or without cleft palate | 4.89 | 5.14 |
| Q39.0-Q39.1 Esophageal atresia/stenosis, with or without fistula | 0.36 | 0.41 |
| Q41 Small intestine atresia/stenosis | 0.13 | 0.22 |
| Q42.2-Q42.3 Ano-rectal atresia/stenosis, with or without fistula | 0.58 | 0.70 |
| Q53 Cryptorchidism (36 weeks or later)* | 3.89 | 5.86 |
| Q54 Hypospadias | 1.28 | 1.37 |
| Q64.0 Epispadias | 0.09 | 0.10 |
| Q56 Undetermined sex | 0.16 | 0.25 |
| Q60.1-Q60.2 Renal agenesis | 0.08 | 0.11 |
| Q61 Polycystic kidney | 0.26 | 0.28 |
| Q64.1 Bladder extrophy | 0.02 | 0.01 |
| Q69 Polydactyly | 3.68 | 4.13 |
| Q71.0, Q72-Q73 Total limb reduction (includes unspecified) | 0.34 | 0.38 |
| Q79.0 Diaphragmatic hernia | 0.39 | 0.44 |
| Q79.2 Omphalocele | 0.35 | 0.33 |
| Q79.3 Gastroschisis | 1.80 | 2.10 |
| Q79.4 Prune Belly sequence | 0.02 | 0.02 |
| Q79.5 Abdominal wall defects | 0.22 | 0.40 |
| Q91.4-Q91.7 Trisomy 13 | 0.05 | 0.05 |
| Q91.0-Q91.3 Trisomy 18 | 0.10 | 0.13 |
| Q90 Down syndrome, all ages (years) | 3.50 | 3.64 |
| < 20** | 1.93 | 1.71 |
| 20 to 24** | 1.65 | 1.86 |
| 25 to 29** | 2.31 | 2.23 |
| 30 to 34** | 4.20 | 3.71 |
| 35 to 39** | 10.10 | 12.13 |
| 40 to 44** | 35.08 | 37.45 |
| ≥ 45** | 37.62 | 44.81 |
| Not registered | - | - |


The authors declare no conflicts of interest of any nature.
Please cite this article as: Navarrete-Hernández E, Canún-Serrano S, Valdés-Hernández J, Reyes-Pablo AE. Malformaciones congénitas al nacimiento: México, 2008-2013. Bol Med Hosp Infant Mex. 2017;74:301–308.