


An accurate assessment of physical activity in schoolchildren is necessary to implement strategies that promote active lifestyles. The objective of this study was to validate a self-administered questionnaire to assess physical activity and sedentary behaviors and to analyze differences in the validity according to nutritional status in Mexican schoolchildren.
MethodsSchoolchildren of 8-12 years of age answered a self-report physical activity and sedentary behaviors questionnaire to evaluate sedentary and light physical activity (SLPA) and moderate to vigorous physical activity (MVPA). The data of children who wore a triaxial accelerometer days were analyzed. Concordance between both methods to determine the time schoolchildren spend watching television was assessed using intraclass correlation coefficients and Bland-Altman method.
ResultsThe estimation of MVPA by questionnaires was higher than that of accelerometers by 117.6minutes per week, and the estimation of SLPA was lower by 1,924.7minutes per week. No correlation between the time assessed by accelerometers and the time reported in the questionnaires for SLPA and MVPA was detected. In normal-weighted children, a low correlation was observed between the time dedicated to playing video games with sedentary activities (ric=0.29, p=0.031) assessed by accelerometers.
ConclusionsSchoolchildren over-estimate MVPA and under-estimate SLPA. Body weight can be a factor influencing such bias.
La evaluación precisa de la actividad física (AF) en escolares es necesaria para implementar estrategias que favorezcan estilos de vida activos. El objetivo del presente estudio fue evaluar la validez de un cuestionario autoadministrado de AF y actividades sedentarias y ligeras (SLA) desarrollado para escolares mexicanos, analizando las diferencias en la validez de acuerdo con el estado de nutrición.
MétodosEscolares de 8-12 años de edad contestaron un cuestionario autoaplicable en el cual se evaluaron las SLA y AF moderada y vigorosa (AFMV). Se determinaron los minutos a la semana dedicados a SLA y AFMV en niños que portaron un acelerómetro triaxial. La concordancia entre los dos métodos para detectar el tiempo que los niños invierten en ver televisión se evaluó mediante coeficientes de correlación intraclase y el método de Bland-Altman.
ResultadosLa estimación de AFMV por cuestionarios fue mayor que la de acelerometría por 117.6min/semana, mientras que la estimación de SLA fue menor por 1,924.7min/semana. No se detectó correlación entre el tiempo evaluado con acelerómetros y el reportado en el cuestionario para las SLA y AFMV. En niños con índice de masa corporal normal, se detectó una correlación baja entre el tiempo reportado y el medido por acelerometría para jugar videojuegos con las actividades sedentarias (ric = 0.29, p = 0.031).
ConclusionesLos escolares sobreestiman las AFMV y subestiman las SLA. El peso corporal puede ser un factor que influya en dichos sesgos.
In Mexico, higher inactivity rates and less rates of physical activity (PA) have been observed in the pediatric population.1 The influence of physical inactivity in the development of obesity and metabolic alterations is known,2,3 affecting bone health and producing symptoms of depression.4 The benefits of PA at early stages have been described5–7 and its importance to prevent sedentary behavior in adulthood.8
It is necessary to evaluate PA in schoolchildren in order to monitor their pattern of activities, and to determine recommendations that favor active and healthy lifestyles. There are different methods for evaluating PA: direct and indirect calorimetry, doubly labelled water, accelerometer, pedometers, heart rate monitoring, observation and questionnaires.9,10 Calorimetry, doubly labelled water and accelerometers, although accurate, are difficult to apply, expensive and their use is not feasible in population studies. These methods are used as contrast criteria to validate other PA assessment methods.9 PA questionnaires are used in population studies because they are less expensive and non-invasive when compared with other methods, they allow recovering details of the activity and, if properly designed, they can correctly measure the level of PA or energy expenditure.9
There are different questionnaires to assess the PA of children and adolescents, such as the International Physical Activity Questionnaire (IPAQ)11 and the Activity and Inactivity Questionnaire for Mexican Students (CAINM, for its Spanish acronym);12 both have been used to evaluate patterns of PA and sedentary lifestyle in the pediatric population of Mexico.1 The IPAQ has been used and validated with school children;13 the application of its short vision in young populations is recommended.14 However, it can be used only to monitor moderate and vigorous PA (MVPA) in the population > 14 years old.14 The CAINM12 was developed from a PA questionnaire previously validated in adults.15,16 It has been applied to Mexican schoolchildren from 10 to 14 years old, evaluating the time spent in front of screens, reading, or doing school homework.1 One limitation is that CAINM was not validated with a gold standard: its reproducibility was evaluated by applying it twice in 6 months, and it was validated against the 24-hour reminder. The correlations obtained were moderate for watching television (r = 0.58) and low for vigorous PA (r = 0.23).
Regarding the evaluation of sedentary life in schoolchildren, it is usually done by recording the total time that children spend in front of monitors (television, computer, playing video games), but few studies have evaluated the validity of questionnaires on sedentary life in the pediatric population.3,17
Therefore, the objective of the present study was to evaluate the validity of self-administered questionnaire of PA and sedentary behaviors developed for Mexican schoolchildren, considering as a standard the measurement obtained with accelerometers. It was also analyzed if there were differences in validity through two different ways of detecting the time spent watching television (TV). Finally, it was evaluated whether this validity differed from the nutritional status of the students.
2MethodsThe study was conducted randomly in four public primary schools in urban areas of the State of Mexico and Mexico City that allowed the application of the questionnaire to children, between February and June 2013. The initial population was 107 primary school students, from third to sixth grade (8-12 years of age). Before the study, written informed consent was obtained from the students and their parents or guardians. The Research Committee of the Divisional Council of Biological and Health Sciences of the Autonomous Metropolitan University, Campus Xochimilco, approved the project.
The PA and sedentary behaviors questionnaire were developed from the IPAQ11 and the CAINM12 to analyze the moderate to vigorous physical activity (MVPA) and the sedentary and light physical activities (SLPA), respectively. It is a self-applicable instrument focused on the activities that participants frequently did during the month before the survey. The format used can be requested from the authors. The students answered the questionnaire in schools, individually, separated from each other to avoid communication, with the supervision of the observers to clarify doubts and verify that the participants answered all the questions.
To evaluate the MVPA, four questions were asked, with the objective of knowing the type, frequency and time dedicated to each activity: a) “Please, tell me if you have done or not done activities or things that made you sweat or that would make your heart beat or your breathing faster.”
To explore this activity, as well as its frequency and duration, the following questions were added: b) “What activities did you do that made you sweat or made you breathe faster, and heart speed up?” For this question there were different response options and could answer more than one option: soccer, running, gymnastics, basketball, dance, martial arts, other activities; c) “Usually, in the last month, how many days a week did you do that or those activities?” and d) “Usually, how much time a day did you dedicate to that or those activities? Think of a normal day and calculate how much time you do this activity.” The resulting variables contained the activity(s), the days of the week (i.e. frequency) and the time per day (i.e. duration) dedicated to those activities. Then, to count time per week spent doing MVPA, the reported frequency was multiplied by the duration for each of the activities reported (soccer, running, gymnastics). Finally, to count the total of minutes per week destined to perform MVPA, the time per week of all the activities reported was added.
The questionnaire also studied three sedentary behaviors: 1) time watching TV, 2) time using the computer or playing video games and 3) time spent doing homework, listening to music or radio while sitting or lying down. For these activities, we inquired about the time in hours dedicated to these activities during the week and on weekends (separately), and then add them and obtain the time per week dedicated to each of the previous activities. The time spent watching TV was evaluated employing two different ways of asking the time allocated to this activity: 1) Traditional question (TQTV): “Per day, how much time did you watch TV? Tell me estimated hours in a day” and 2) Question proposal (QPTV): “In the last month, from Monday to Friday, what time did you start watching TV and what time did you stop watching it? If you saw several programs, please tell me what time each one starts and ends.” For the latter, the minutes of all the TV programs that were reported were added. The objective of this question proposal about watching TV time was that the students, having to write down the programs and schedules of the same ones, could answer in detail the time destined to watch TV.
To assess the SLPA reported in the questionnaire, minutes were added to the week (previously calculated) dedicated to watching TV, sitting or lying down and playing video games, obtaining the time per week that the participants intended to perform SLPA. Because there were two different ways of asking time watching TV, two variables were generated to evaluate the SLPA: 1) TQSLA = TQTV plus the time spent listening to music or radio while sitting or lying down and time using the computer or playing video games; 2) QPSLA = QPTV plus the time spent listening to music or radio while sitting or lying down and using computer time or playing video games.
PA and sedentary behaviors in conditions of freedom were evaluated objectively through triaxial accelerometers (ActiGraph model GT3X, 49 East Chase Street Pensacola, FL 32502). Each participant was asked to use the device for a week, at waist height, recording the time they started using it if it was removed during the day and when it was removed before sleep; it was mentioned that the monitor should be removed when performing water activities.
We considered as valid values when the accelerometer was used up at least 10hours a day during the week and 8hours a day in the weekend, equivalent to 41.1% and 33.1% of the day, respectively.18 Data recording was considered adequate if the child had valid values at least four days a week and a day in the weekend.18 The programmed duration of the epoch was 60 s. Periods greater than 20min without movement were considered as if the accelerometer was not carried, and it was considered as an invalid day when more than 600min passed without porting. To evaluate the level of PA, the cut points proposed by Ekelund were used.19
The nutritional status was evaluated based on the weight and height of the children. SECA® model 813 scales and portable SECA® model 213I scales were used. The students were asked to remove footwear and any object that added extra weight (i.e. keys, coins, cell phones, necklaces) and to “go to the bathroom” to empty the bladder and bowels. Lohman et al.20 standard procedures were followed for taking measurements. The nutritional state was classified using the body mass index (BMI) for age according to the cut-off points proposed by the World Health Organization.21
The statistical analysis was carried out with the statistical program SPSS version 21. For the descriptive analysis, we used Student's t-test to determine if there were differences between the reported time of SLPA and MVPA according to nutritional status, intraclass correlation coefficients (ric) to evaluate consistency between methods. The Kolmogorov-Smirnov (KS) normality tests were performed for the SLPA and MVPA time of the questionnaire and the accelerometers. Because the time reported in the questionnaires to play video games (KS=2.17, p =0.000) and for the MVPA (KS=1.73, p =0.005) presented asymmetric distribution, all the variables were transformed by calculating the square root of the times reported in the questionnaire and of those evaluated with accelerometry. Subsequently, the distribution of the modified variables was analyzed, and all showed normal distribution; these transformed variables were used to estimate ric. The analysis was performed by Bland-Altman graph to represent the differences between two measurements (i.e. accelerometry and questionnaires) concerning their mean, and in this way evaluate the consistency between both methods; unbelievable values of five children were ignored.
By observing the time reported individually, it was found that children recorded unbelievable times for sedentary activities during the week or weekend (data not shown in tables): 34.8% of participants reported ≥ 17h/day during the week watching TV through TQTV and 1.5% ≥ 20h on weekends; 38.4% of children reported ≥17h/day during the week to watch TV through QPTV; 5.8% of the students indicated that they designed ≥ 25h/day to play video games during the week and 4.6% ≥ 16h in the weekend; and 15.1% of the participants reported that they were ≥20h/day sitting or lying down during the week and 1.5% ≥16h during the weekend. To obtain the time reported per week, the summation of the time reported between weekdays and weekend was made. It was observed that not all cases resulted in extreme values since most of the participants reported a high time during the week, but low during the weekend or vice versa. In this way, these cases had caused that the variables did not show normal distribution.
3ResultsThe final sample was reduced to 86 students due to the time of recording the data considered to be valid (i.e. four days a week and a day weekend).
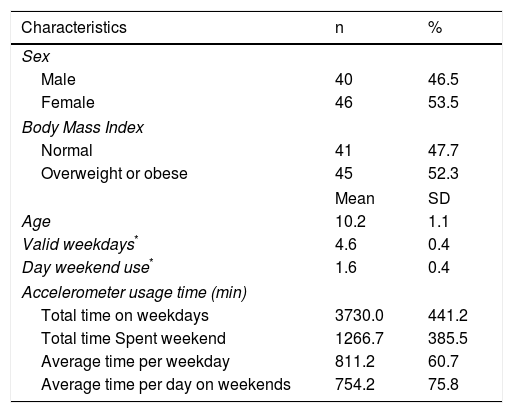
The study involved more female students (53.5% vs 46.5%), and the mean age was 10.2 ± 1.1 years (Table 1). The nutritional state evaluated through the BMI for age showed that the prevalence of overweight or obesity (OW/OB) was 52.3% (OW = 27.9%, OB = 24.4%); only one child presented underweight. Accelerometers were ported on average 4.6 ± 0.4 days on weekdays and 1.6 ± 0.4 days on weekends. The average time the participants used the accelerometers was 811.2 ± 60.7min/day during the week and 754.2 ± 75.8min/day on weekends.
Population characteristics and adherence to the use of accelerometers.
| Characteristics | n | % |
|---|---|---|
| Sex | ||
| Male | 40 | 46.5 |
| Female | 46 | 53.5 |
| Body Mass Index | ||
| Normal | 41 | 47.7 |
| Overweight or obese | 45 | 52.3 |
| Mean | SD | |
| Age | 10.2 | 1.1 |
| Valid weekdays* | 4.6 | 0.4 |
| Day weekend use* | 1.6 | 0.4 |
| Accelerometer usage time (min) | ||
| Total time on weekdays | 3730.0 | 441.2 |
| Total time Spent weekend | 1266.7 | 385.5 |
| Average time per weekday | 811.2 | 60.7 |
| Average time per day on weekends | 754.2 | 75.8 |
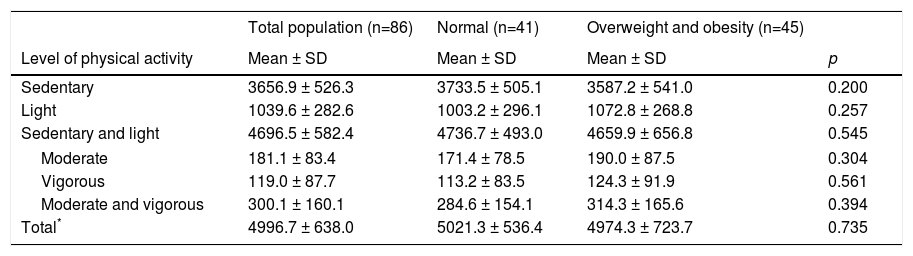
Table 2 shows the average time obtained by the accelerometers in the total population and according to nutritional status. It was observed that the students spent more minutes doing SLPA than MVPA (94.0% vs 6.0%). When analyzing data according to the BMI, it was noted that there were no statistically significant differences between evaluated of SLPA and MVPA time among children with normal BMI and overweight or obese (SLPA: t = 0.61, p= 0.545; MVPA: t = -0.86, p = 0.394).
Time spent doing physical activity, sedentary behavior (min/week) evaluated by accelerometry and body mass index in the total population.
| Total population (n=86) | Normal (n=41) | Overweight and obesity (n=45) | ||
|---|---|---|---|---|
| Level of physical activity | Mean ± SD | Mean ± SD | Mean ± SD | p |
| Sedentary | 3656.9 ± 526.3 | 3733.5 ± 505.1 | 3587.2 ± 541.0 | 0.200 |
| Light | 1039.6 ± 282.6 | 1003.2 ± 296.1 | 1072.8 ± 268.8 | 0.257 |
| Sedentary and light | 4696.5 ± 582.4 | 4736.7 ± 493.0 | 4659.9 ± 656.8 | 0.545 |
| Moderate | 181.1 ± 83.4 | 171.4 ± 78.5 | 190.0 ± 87.5 | 0.304 |
| Vigorous | 119.0 ± 87.7 | 113.2 ± 83.5 | 124.3 ± 91.9 | 0.561 |
| Moderate and vigorous | 300.1 ± 160.1 | 284.6 ± 154.1 | 314.3 ± 165.6 | 0.394 |
| Total* | 4996.7 ± 638.0 | 5021.3 ± 536.4 | 4974.3 ± 723.7 | 0.735 |
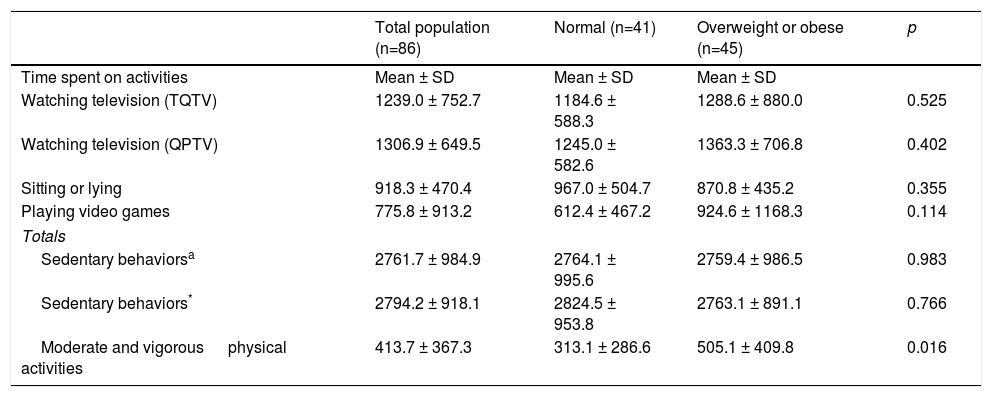
Table 3 shows the average time that the participants reported in the questionnaires in the total population and according to the nutritional status. They reported more time watching TV with the QPTV against that of the TQTV, being the difference of the time reported of 67.9minutes per week. The time a week spent listening to music or radio while sitting or lying down was 918.3minutes and the time a week using the computer or playing video games was 775.8minutes. Regarding the MVPA, on average, children spent 413.7min a week doing MVPA. Children with normal BMI reported watching TV fewer minutes (with both ways of asking the time watching TV), spending less time sitting or lying down and playing video games compared to children with OW/OB. There were no differences in the time reported for SLPA between the groups of normal BMI and overweight or obesity (TQSLPA: t = 0.02, p = 0.983; QPSLPA: t=0.30, p=0.766). Children with OW/OB reported spending more time performing MVPA compared to those with normal BMI, differences that were statistically significant (t = -2.46, p = 0.016).
Time in minutes a week of sedentary light activities and moderate and vigorous physical activity reported in the questionnaire in total population and BMI.
| Total population (n=86) | Normal (n=41) | Overweight or obese (n=45) | p | |
|---|---|---|---|---|
| Time spent on activities | Mean ± SD | Mean ± SD | Mean ± SD | |
| Watching television (TQTV) | 1239.0 ± 752.7 | 1184.6 ± 588.3 | 1288.6 ± 880.0 | 0.525 |
| Watching television (QPTV) | 1306.9 ± 649.5 | 1245.0 ± 582.6 | 1363.3 ± 706.8 | 0.402 |
| Sitting or lying | 918.3 ± 470.4 | 967.0 ± 504.7 | 870.8 ± 435.2 | 0.355 |
| Playing video games | 775.8 ± 913.2 | 612.4 ± 467.2 | 924.6 ± 1168.3 | 0.114 |
| Totals | ||||
| Sedentary behaviorsa | 2761.7 ± 984.9 | 2764.1 ± 995.6 | 2759.4 ± 986.5 | 0.983 |
| Sedentary behaviors* | 2794.2 ± 918.1 | 2824.5 ± 953.8 | 2763.1 ± 891.1 | 0.766 |
| Moderate and vigorous physical activities | 413.7 ± 367.3 | 313.1 ± 286.6 | 505.1 ± 409.8 | 0.016 |
SD, standard deviation; TQ, traditional question; QP, question proposed.
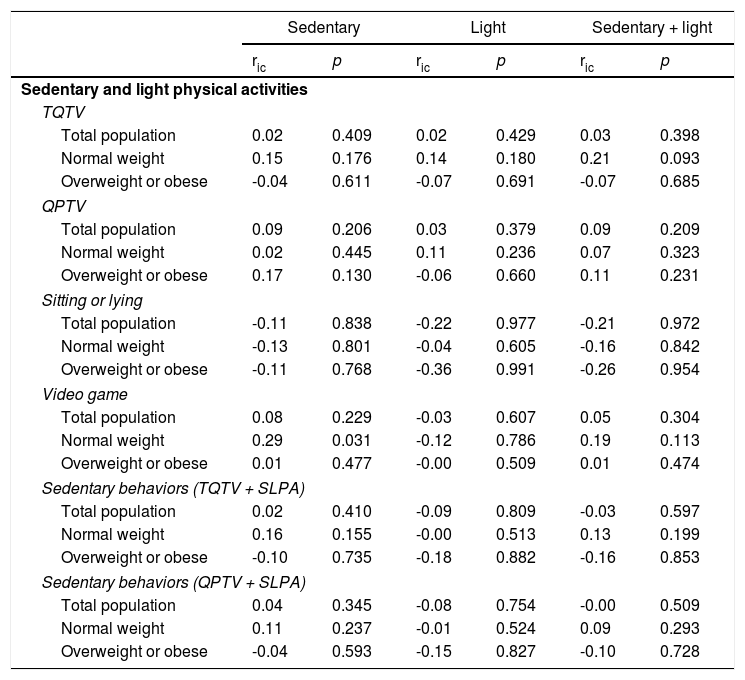
In children with normal BMI, there was a low correlation between the time reported playing video games with sedentary activities (ric = 0.29, p = 0.031) evaluated through accelerometry (Table 4). However, in the total population and according to the state of nutrition, there was no correlation between the sedentary time spent (for both ways of asking about time watching TV) and the time evaluated through accelerometers (p > 0.05). In the same way, for the MVPA there was no relationship between the time reported in the questionnaire and the time evaluated with accelerometers (p > 0.05).
Intraclass correlation between the time reported on the questionnaire and the time measured by the accelerometer for sedentary and light activity and moderate to vigorous week and BMI activities total population.
| Sedentary | Light | Sedentary + light | ||||
|---|---|---|---|---|---|---|
| ric | p | ric | p | ric | p | |
| Sedentary and light physical activities | ||||||
| TQTV | ||||||
| Total population | 0.02 | 0.409 | 0.02 | 0.429 | 0.03 | 0.398 |
| Normal weight | 0.15 | 0.176 | 0.14 | 0.180 | 0.21 | 0.093 |
| Overweight or obese | -0.04 | 0.611 | -0.07 | 0.691 | -0.07 | 0.685 |
| QPTV | ||||||
| Total population | 0.09 | 0.206 | 0.03 | 0.379 | 0.09 | 0.209 |
| Normal weight | 0.02 | 0.445 | 0.11 | 0.236 | 0.07 | 0.323 |
| Overweight or obese | 0.17 | 0.130 | -0.06 | 0.660 | 0.11 | 0.231 |
| Sitting or lying | ||||||
| Total population | -0.11 | 0.838 | -0.22 | 0.977 | -0.21 | 0.972 |
| Normal weight | -0.13 | 0.801 | -0.04 | 0.605 | -0.16 | 0.842 |
| Overweight or obese | -0.11 | 0.768 | -0.36 | 0.991 | -0.26 | 0.954 |
| Video game | ||||||
| Total population | 0.08 | 0.229 | -0.03 | 0.607 | 0.05 | 0.304 |
| Normal weight | 0.29 | 0.031 | -0.12 | 0.786 | 0.19 | 0.113 |
| Overweight or obese | 0.01 | 0.477 | -0.00 | 0.509 | 0.01 | 0.474 |
| Sedentary behaviors (TQTV + SLPA) | ||||||
| Total population | 0.02 | 0.410 | -0.09 | 0.809 | -0.03 | 0.597 |
| Normal weight | 0.16 | 0.155 | -0.00 | 0.513 | 0.13 | 0.199 |
| Overweight or obese | -0.10 | 0.735 | -0.18 | 0.882 | -0.16 | 0.853 |
| Sedentary behaviors (QPTV + SLPA) | ||||||
| Total population | 0.04 | 0.345 | -0.08 | 0.754 | -0.00 | 0.509 |
| Normal weight | 0.11 | 0.237 | -0.01 | 0.524 | 0.09 | 0.293 |
| Overweight or obese | -0.04 | 0.593 | -0.15 | 0.827 | -0.10 | 0.728 |
| Moderate | Vigorous | Moderate + vigorous | ||||
|---|---|---|---|---|---|---|
| ric | p | ric | p | ric | p | |
| Moderate and vigorous physical activity | ||||||
| MVPA | ||||||
| Total population | 0.05 | 0.330 | 0.05 | 0.312 | 0.06 | 0.282 |
| Normal weight | -0.09 | 0.718 | -0.09 | 0.711 | -0.12 | 0.774 |
| Overweight or obese | 0.12 | 0.210 | 0.13 | 0.190 | 0.16 | 0.146 |
r ic, Intraclass correlation coefficient; TQTV, traditional question about the time watching television; QPTV, questions proposed about the time watching television; SLPA, sedentary and light physical activity; MVPA, moderate and vigorous physical activity.
Considering the TQTV, children underestimated by 1943.8min the time spent performing SLPA (Figure 1) while, through QPTV, children minimized the time spent on SLPA 1905.6min (Figure 1b). In both cases, it is possible to say that there is no correlation between the methods. In both figures, it is observed that the less sedentary children underestimated to a greater extent the time destined to perform SLPA; as the participants were more sedentary, they underestimated, to a lesser extent, the time devoted to carrying out these activities.
. B. Sedentary and light activities (question proposed). C. Moderate and vigorous physical activity. Figures A (n = 83), B (n = 81) and C (n = 84) include the total population. D. Time playing video games with sedentary activities. Includes school children with normal body mass index (n = 47). Limits of consistency to ± 1.96 SD (thin solid lines) of the mean differences (thick solid line) between the times reported (minutes per week) in the questionnaire and the evaluated with accelerometry. The dotted line represents zero or equal differences.")
Bland-Altman graphs evaluate the correlation between accelerometry and questionnaires. A. Sedentary and light activities (traditional question). B. Sedentary and light activities (question proposed). C. Moderate and vigorous physical activity. Figures A (n = 83), B (n = 81) and C (n = 84) include the total population. D. Time playing video games with sedentary activities. Includes school children with normal body mass index (n = 47). Limits of consistency to ± 1.96 SD (thin solid lines) of the mean differences (thick solid line) between the times reported (minutes per week) in the questionnaire and the evaluated with accelerometry. The dotted line represents zero or equal differences.
On the other hand, school children overestimated 117.6minutes the time devoted to performing MVPA (Figure 1c). It is possible to say that there is no agreement between the methods. In this case, school children were more likely to overestimate the time spent performing MVPA than to underestimate it.
Although in children with healthy BMI a slight relationship was shown between the time reported in the questionnaire to play video games and the sedentary activities evaluated with the accelerometer, when comparing both times, an underestimation of 3121.0min was found for sedentary activities (Figure 1d). Therefore, it is possible to say that both methods are not congruent.
4DiscussionIn the present study it was observed that among children with normal BMI, the questionnaire in evaluation produced estimates of the time spent playing video games that are weakly related to the time evaluated by accelerometry. However, in the Bland-Altman chart, there was no correlation between the methods. Also, in general, there was an underestimation of the SLPA and overestimation of the MVPA. The magnitude of underestimation of the SLA was less with question proposed to record time watching TV.
Most studies show that children spend more time on SLPA than on MVPA.17 In the present study we found that, when evaluated with accelerometers, schoolchildren are more inactive despite the fact that they reported being active. Another finding was that a significant proportion of children recorded unbelievable times for sedentary activities. Probably, schoolchildren stated such high values when they thought that they should record the time a week devoted to these activities. These results are the first evidence of the limitations of the questionnaires to evaluate the activity and physical inactivity.
For the SLPA, there was a weak concordance of sedentary activities evaluated by accelerometry with the time spent playing video games reported in questionnaires. It is difficult to compare the results of this study with previous publications due to the type of SLPA that was evaluated, the required reminder period, the different methods of administration, the time lapse between evaluations and the methods of analysis (i.e. Bland-Altman graphics are not presented).22 Also, most of the available studies have only evaluated the reliability or reproducibility, but not the validity of the questionnaires to assess SLPA of children and adolescents from 11 to 19 years old.23–28 The validity of the tools that have evaluated the sedentary behavior of children and adolescents has been carried out by comparing accelerometers with direct observation,29 with metabolic equivalents30 and with calorimetry,31 but not with self-applicable questionnaires. In addition, these studies have reported the sensitivity and specificity of both methods but not their correlation.
In both with accelerometry and with questionnaires, it was observed that the students did not comply with the recommendation of SLPA.32 The students reported in the questionnaire watching TV on average 3.0h/day (TQTV: 2.9h/day, QPTV: 3.1h/day) and playing video games 1.8h/day. These times are similar to those estimated in other samples of Mexican schoolchildren and adolescents using questionnaires: between 2.4-3.1h/day watching TV,12,33,34 and 0.9-1.7h/day playing video games.12,33,34 It is important to note that the results of the present study indicate that these statistics should be considered as an underestimation of the time spent doing SLPA; namely, it is very likely that children are spending more time than they report because school children underestimated, on average, 1.69 times the SLPA, with the under estimation being less with the QPTV (1.68 times) than with the TQTV (1.70 times). The under estimation in schoolchildren with normal BMI is similar to that of those with OW/OB (1.69 and 1.68 times, respectively). The difference in the under estimation of the average time of SLA between both questions about the time watching TV was 32.5min.
Regarding the MVPA, in previous validation studies with samples where participants with normal and low weight predominated, the correlation between self-administered questionnaires and accelerometers has been low in girls aged 8 to 9 years (ric = 0.24)35 and moderate in those from 9 to 13 years (ric =0.58).36,37 In contrast, in Mexican schoolchildren there was no correlation between the time evaluated by accelerometry and that reported in questionnaires concerning the evaluation of the MVPA. This lack of correlation may be because, in the present study, slightly more than half of the schoolchildren and adolescents were overweight and young.
As regards the recommendation of MVPA,38 when evaluated with accelerometers, it was observed that children did not comply them (average of 47.1min/day). However, the average difference between the time evaluated by accelerometry and that reported in the questionnaire was 113.6min; that is, children tended to overestimate the time spent on these activities by 1.38 times. This overestimation was lower in schoolchildren with normal weight than in those with weight excess (1.10 vs 1.60).
In a review of 83 studies where PA was evaluated in pediatric populations with objective and subjective methods, it was found that about 72% of MVPAs evaluated subjectively may be overestimated by children and adolescents when compared to PA evaluated with accelerometers.39 In the Mexican population, this overestimation has also been observed.22
The inconsistencies in the responses that the pediatric population can report in the questionnaires increase the probability of generating sub or overestimation of the data. This can be attributed to factors such as the social stigmatization of inactivity, which refers to the fact that children who have a sedentary lifestyle may feel pressure to overestimate their PA, since being physically active is perceived as a socially expected behavior.17.39 It can be difficult for children to measure the time they spend on activities and not having a clear idea about the logical time that is used to carry out PA can produce unbelievable values.17 The cognitive development and the ability to recall their daily activities influence how clearly they answer the self-applied questionnaires.3 Therefore, the answers can be more reliable in the older participants17 since they have greater reasoning and memory skills, reducing the confusion that the complexity of the questions can generate;40 the effect of the perception of the effort: the people who are not physically active could perceive the effort inappropriately when performing PA, since when having low physical fitness, they would qualify a light activity as moderate or vigorous, and with this overestimate the MVPA.
Some of the biases described above could also be related to the effect of body weight on the quality of the report of the time allocated to the activity and physical inactivity. People with OW/OB are inactive and with low physical fitness. This could influence them to answer the questionnaires incorrectly and therefore overestimate the MVPA39 as was observed in this sample of schoolchildren in the Mexico City. At the same time, students with OW/OB seem to have greater clarity of the time they spend on sedentary behavior since in this paper, they underestimated these activities to a lesser extent. However, this same group overestimated to a greater extent the time of MVPA.
Despite the extensive use of tools to assess sedentary behavior in the pediatric population, few studies report the validity of the tools used. Also, the methods to validate the tools for assessing sedentary behaviors vary between studies, so the comparison between these is complicated. However, for the evaluation of sedentary behavior under free conditions, accelerometers have reported greater sensitivity and specificity (> 80%) compared to other methods such as direct observation, metabolic rate (MET) and calorimetry,22 so it is the recommended validity method.
The studies consulted on the validation of MVPA questionnaires or sedentary behaviors have used correlation coefficients as a validation method. However, a correlation quantifies the degree of linear association between two variables, but not their differences; that is, a strong correlation does not necessarily mean that there is consistency between two methods. Therefore, the correlation coefficients and the regression models in some cases may be inadequate or misleading when assessing correlation. As far as is known, this is one of the few studies that report, use of the Bland-Altman method to determine the correspondence between accelerometry and a questionnaire that evaluate SLPA and MVPA in the pediatric population. This method is recommended to represent the differences between two measurements concerning their mean graphically, and in this way assess the correlation between them. On the Bland-Altman charts of the present study, it was shown that school children underestimated SLPA (TQTV = 1,943.8min, QPTV = 1,905.6min) and overestimated the MVPA (117.6min). In a study of Canadian children and adolescents with obesity,35 it was exposed, through the Bland-Altman method, that participants overestimated the time reported for very active and active activities 162min (very active = 48 ± 64min, p <0.001, active = 114 ± 129min, p < 0.001), but not for the inactive (38 ± 158min, p = 0.170), while in another study, where parents reported the MVPA of Canadian children (using the Bland-Altman method), it was demonstrated overestimation of 100min/s destined to these activities.41 Due to the above, the questionnaires that have been validated using correlation coefficients or linear regression models should be used with caution, since, although there may be a linear association between the variables, the differences between both measurements can be high.
The limitation of the questionnaire evaluated is that it requires schoolchildren to report the PA carried out daily in a month, making it difficult for children to remember their activities accurately. Also, the instrument is focused on evaluating activities more related to the urban context than to the rural regions. However, more and more people living in rural areas have acquired the activity patterns of those living in urban areas. In future research, it would be advisable to evaluate the validity of this questionnaire in the same population, but with other application modalities (i.e. face-to-face interview by trained observers). In this way, it may be possible to reduce the biases that occur when the questionnaire is self-administered. It would also be useful to evaluate validity in adolescents, in whom memory and courtesy biases (i.e. when the person tries to please the interviewer by giving him the answer he thinks will be approved)42 may have less effect.
When subjective evaluation methods are used, children tend to overestimate MVPA and underestimate SLPA, being body weight a factor that may influence such biases. Therefore, it is not recommended to evaluate the PA and sedentary behavior of Mexican schoolchildren through questionnaires. Consequently, when possible, objective methods such as accelerometers should be used. It is necessary to develop other tools and evaluate their validity in other pediatric populations and apply questionnaires using interview techniques to reduce bias.
Ethical disclosuresProtection of human and animal subjectsThe authors declare that no experiments were performed on humans or animals for this study.
Confidentiality of dataThe authors declare that they have followed the protocols of their work center on the publication of patient data.
Right to privacy and informed consentThe authors declare that no patient data appear in this article.
Conflict of interestsThe authors declare no conflict of interest.
To the children who agreed to participate in the study and to the Bachelor in Nutrition Magdalena Rodríguez Magallanes (responsible for the Unit of Nutrition, Body Composition and Energy Expenditure of the B.A. in Human Nutrition, Autonomous Metropolitan University Xochimilco) for their training support, standardization of observers, and for the management of accelerometers.
Please cite this article as: Ayala-Guzmán CI, Ramos-Ibáñez N, Ortiz-Hernández L. El auto-reporte de actividad física y comportamientos sedentarios no concuerda con acelerometría en escolares mexicanos. Bol Med Hosp Infant Mex. 2017;74:272–281.