

Introducción: En México existen pocos datos referentes a la prevalencia de dislipidemia o de un perfil lipídico anormal en niños con obesidad, y su relación con el índice de masa corporal (IMC). El objetivo del estudio fue explorar esta asociación y los perfiles lipídicos más frecuentes en niños y adolescentes con obesidad.
Métodos: Se realizaron mediciones antropométricas y bioquímicas en 289 niños entre 6 y 17 años de edad, y se estableció el grado de correlación de las variables lipídicas y el puntaje Z del IMC. Los pacientes se clasificaron de acuerdo con los perfiles lipídicos anormales; además, se determinó el más frecuente, y la diferencia en su frecuencia de acuerdo con el puntaje Z.
Resultados: El puntaje Z del IMC demostró una correlación positiva con los niveles de colesterol total (CT) y colesterol de baja densidad (C-LDL) (r = 0.214, p <0.001 y r = 0.228, p <0.001, respectivamente). El perfil lipídico más frecuente fue el de colesterol de alta densidad bajo más hipertrigliceridemia (n= 128, 44.29%). Solamente el 16.26% de los niños fueron normolipémicos.
Conclusiones: En niños con obesidad existe una correlación positiva entre el IMC y los niveles de CT y C-LDL. En estos niños, los perfiles lipídicos proaterogénicos comienzan en edades tempranas.
Background: In Mexico, data related to the prevalence of dyslipidemia or an abnormal lipid profile in obese children and its relation to body mass index (BMI) are scarce. The objective of this study is to explore this association and the most common lipid profiles in obese children and adolescents.
Methods: Anthropometric and biochemical measurements were done on 289 children between the ages of 6 and 17 years, and the degree of correlation between lipid variables and BMI Z-score was established. Patients were classified according to abnormal lipid profiles. The most frequent profile was determined and the difference of their frequency according to Z-scores quartile.
Results: Z-score showed a positive correlation with total cholesterol (TC) and low-density lipoprotein cholesterol (LDL-C) levels (r = 0.214, p <0.001 and 0.228, p <0.001, respectively). The most frequent lipid profile was low high-density lipoprotein cholesterol plus hyper-triglyceridemia (n = 128, 44.29%).
Conclusions: In obese children there is a positive correlation between BMI and TC and LDL-C levels. In these children, proatherogenic lipid profiles begin early in life.
1. Introduction
Cardiovascular diseases (CVD) are the first cause of death in the Mexican population. Ischemic coronary disease is, among the heart diseases, the main cause of mortality. Its incidence has increased >10 times throughout the last 50 years, independently of population growth.1 In Latin America, cardiovascular risk factors have a similar prevalence to developed countries but with less resources for treatment and prevention.2
The prevalence of cardiovascular risk factors in the Mexican population, such as diabetes, obesity and metabolic syndrome (MetS), has also increased in recent years. With regard to obesity, this has happened in children as well as adults.3 In school-age children and adolescents, this fact is worrisome because the obese child has a greater risk of continuing with obesity in adulthood4 and, as is known, atherosclerosis begins from infancy.5 This could translate into an increase of CVD and premature death in adulthood in the years to come. According to the National Survey on Health and Nutrition 2012, the combined prevalence of overweight and obesity in school-age children (boys and girls) is 32% and 36.9%, respectively. Something similar occurs in adolescents because 35% are overweight or obese in Mexico.3
Atherosclerosis is closely linked to lipid abnormalities in children as well as adults.5 In turn, the lipid profile depended, to a certain measure, to the adiposity of an individual.
In a population-based study, Shirasawa et al. demonstrated a direct related proportion between body mass index (BMI) and the low-density lipoprotein cholesterol (LDL-C) level. This relationship also resulted in being greater in those individuals who did not exercise.6 Other studies have also demonstrated a direct relationship between BMI and triglyceride (TG) levels.7 It should be mentioned that these studies have been carried out in children and adolescents with a weight that goes from normal parameters to morbid obesity.
However, studies that have focused on a group of children with overweight and obesity are few. Rizzo et al. found an increase in the prevalence of the components of the metabolic syndrome in adolescents as the BMI increased, including greater frequency of hypertriglyceridemia and HDL-C according to the criteria of the International Federation of Diabetes.8 Gong et al. found differences in the levels of TG, HDL-C and LDL-C among individuals who are overweight and those who are obese in a sample of Chinese adolescents.9 Nielsen et al. carried out a study in which they evaluated the changes in lipid levels with treatment of obesity and showed an improvement in all components of the lipid profile when there was weight loss.10
Data with regard to the prevalence of dyslipidemia or abnormal lipid profile in overweight or obese children and adolescents and its relationship with BMI are scarce in Mexico. In this study it was attempted to establish the correlation between components of the lipid profile and BMI in children and adolescents with obesity, to evaluate differences in the components of the lipid profile according to the BMI and to describe the frequency of abnormal lipid profiles according to the Z-score quartiles of the BMI. To establish the correlation of these components, the variables that have been correlated with an abnormal lipid profile such as age, gender, blood glucose level and self-reported physical activity were taken into account.
2. Methods
2.1. Study population
A descriptive, cross-sectional and retrospective study was carried out that included 293 individuals whose ages were between 6 and 17 years at the time of the study. Subjects came voluntarily to the Cardiometabolic Department of the Faculty of Medicine of the Autonomous University of Yucatan (FMUADY) after having been screened in their schools.
The analysis was done only with those individuals who had a BMI >95% percentile for age and gender, had not been previously diagnosed with any metabolic disease (diabetes, dyslipidemia, hypertension), and had completed nutritional and sports medicine care. Those individuals who did not have complete biochemical measurements were excluded (n = 4).
These patients were from the Institutional Program of Obesity of the State of Yucatan (PIOY), which is a State program for detection of obesity in children and adolescents. Briefly, the program was carried out in primary schools of the municipality of Merida and included screening of ∼14,000 children. Initially, physical education teachers calculated the children's BMI using a scale and portable stadiometer. They were instructed so that in this first approach they would detect children with a percentile ≥97 for age and gender and would invite them to come to our department for medical and nutritional care. Those children classified as being overweight or obese in their schools, but with lower percentiles, received only counseling about healthy lifestyles.
Patients presented to the Cardiometabolic Department of the FMUADY from March 2011 to July 2012. The children who came to the Department were from different parts of the municipality of Merida (Merida, Chochola, Itzincab, Kanasin and Uman). When they arrived at the Department they were measured and weighed wearing light clothing by one licensed nutritionist (C.M.S.U.). A nonprobabilistic, convenience type sample was used. BMI was calculated by dividing the weight (kg) by height (m2). Z-score was calculated using the reference BMI specific for age and gender recommended by the U.S. Centers for Disease Control and Prevention.10 Subsequently, the Z-score was divided in quartiles according to the gender. In the case of males, the quartiles were quartile 1, 1.32-1.887; quartile 2, 1.888-2.12; quartile 3, 2.121-2.342; quartile 4, 2.343-3.03. For girls they were quartile 1, 1.32-1.85; quartile 2, 1.851-2.08, quartile 3, 2.081-2.30; quartile 4, 2.301-2.79. Weight was determined with an electric scale that used a charge cell with effort indicator for the measurement (Tanita TBF-300A). Height was determined with an electronic stadiometer (ADE MZ10020).
2.2. Biochemical measurements
Blood samples were taken early in the morning with the participants fasting (minimum 12 h). Glucose and lipid profile were determined by the enzymatic colorimetric method (Eli Tech Clinical Systems). TC and TG were determined using the Trinder method (intra-assay coefficient of variation of 1.35% and 2.58%, respectively) and HDL-C intra-assay coefficient of variation of 2.32%) using the method of selective accelerating detergent (Mindray BS120). LDL-C was calculated from the previously mentioned lipids by means of the Friedewald formula unless plasma triglyceride levels were >400 mg/dl, which occurred in three individuals. In these cases the selective accelerating detergent method was used (Mindray BS120). All these measurements were done in the clinical laboratory of the FMUADY by trained personnel with calibrated equipment and with internal and external controls (Bio-Rad Quality Systems Division). The laboratory is certified by the ISO 9001-2008 regulations. With these measurements the TG/HDL-C ratio was calculated.
For classifying individuals according to lipid profiles, the percentiles of the different lipid parameters for age and gender reported by The Lipid Research Clinic Pediatric Prevalence Study were used. Percentile values that can be taken as a cut-off point for the diagnosis of dyslipidemia and that are uniformly accepted for Mexican children have not been determined.11 Lipid profiles were classified into five groups in the following manner: patients with low HDL-C (<10 percentile) plus hypertriglyceridemia (≥90 percentile); patients with only high HDL-C (≥90 percentile) or plus hypertriglyceridemia; patients with only low HDL-C; patients with only hypertriglycermida. The last three were according to the previously mentioned ranges. Finally, those patients without any lipid disorders were classified as having normal lipids. For the medical and nutritional evaluation and sample taking, consent was requested from parents or guardians of the children. However, given that it is a retrospective study that analyzes the data of a local assistance program, it was not submitted as a protocol to the ethics committee of the FMUADY.
2.3. Statistical analysis
Descriptive statistics of the general population and divided by gender was carried out. Differences were sought between the means and medians of the different variables with Student t test and Mann-Whitney U test as was the case. The population was then divided by quartiles of the Z-score and a descriptive analysis of the variables according to the different quartiles was done.
For the difference between the dimensional variables according to the quartiles of the Z-score, one-way ANOVA or Kruskall-Wallis test was used, as the case may be. Post hoc analysis was done with the Bonferroni test. For gender, χ2 was used. To evaluate the correlation between the Z-score and the lipid parameters, including the TG/HDL-C ratio, Z-score was taken as a continuous dimensional variable and the Pearson correlation was used. Normality of the variables was evaluated with the Kolmogorov-Smirnov test.
Triglycerides and TC/HDL-C ratio variables that were not normally distributed were transformed into a natural logarithm. Subsequently, normality of the natural logarithm of these variables was demonstrated using the Kolmogorov-Smirnov test before applying the Pearson correlation.
Multiple linear regression stepwise forward test was then done to evaluate the independent relationship between the Z-score with the lipids adjusted for age, gender, glycemia and self-reported physical activity and recorded as hours of physical exercise a day, taking as an independent variable the Z-score and as a dependent variable the components of the lipid profile, each one separately so that there would be no interference between components.
After the measurements, patients were separated in accordance with the previously described lipid profiles, and these groups were analyzed with the χ2 test to determine the ratio with the quartiles of the Z-score. The percentage of each lipid profile was obtained and the confidence interval was calculated at 95%; p <0.05 was considered as statistically significant. Statistical analysis was done using SPSS for Windows, v.17.0 (SPSS).
3. Results
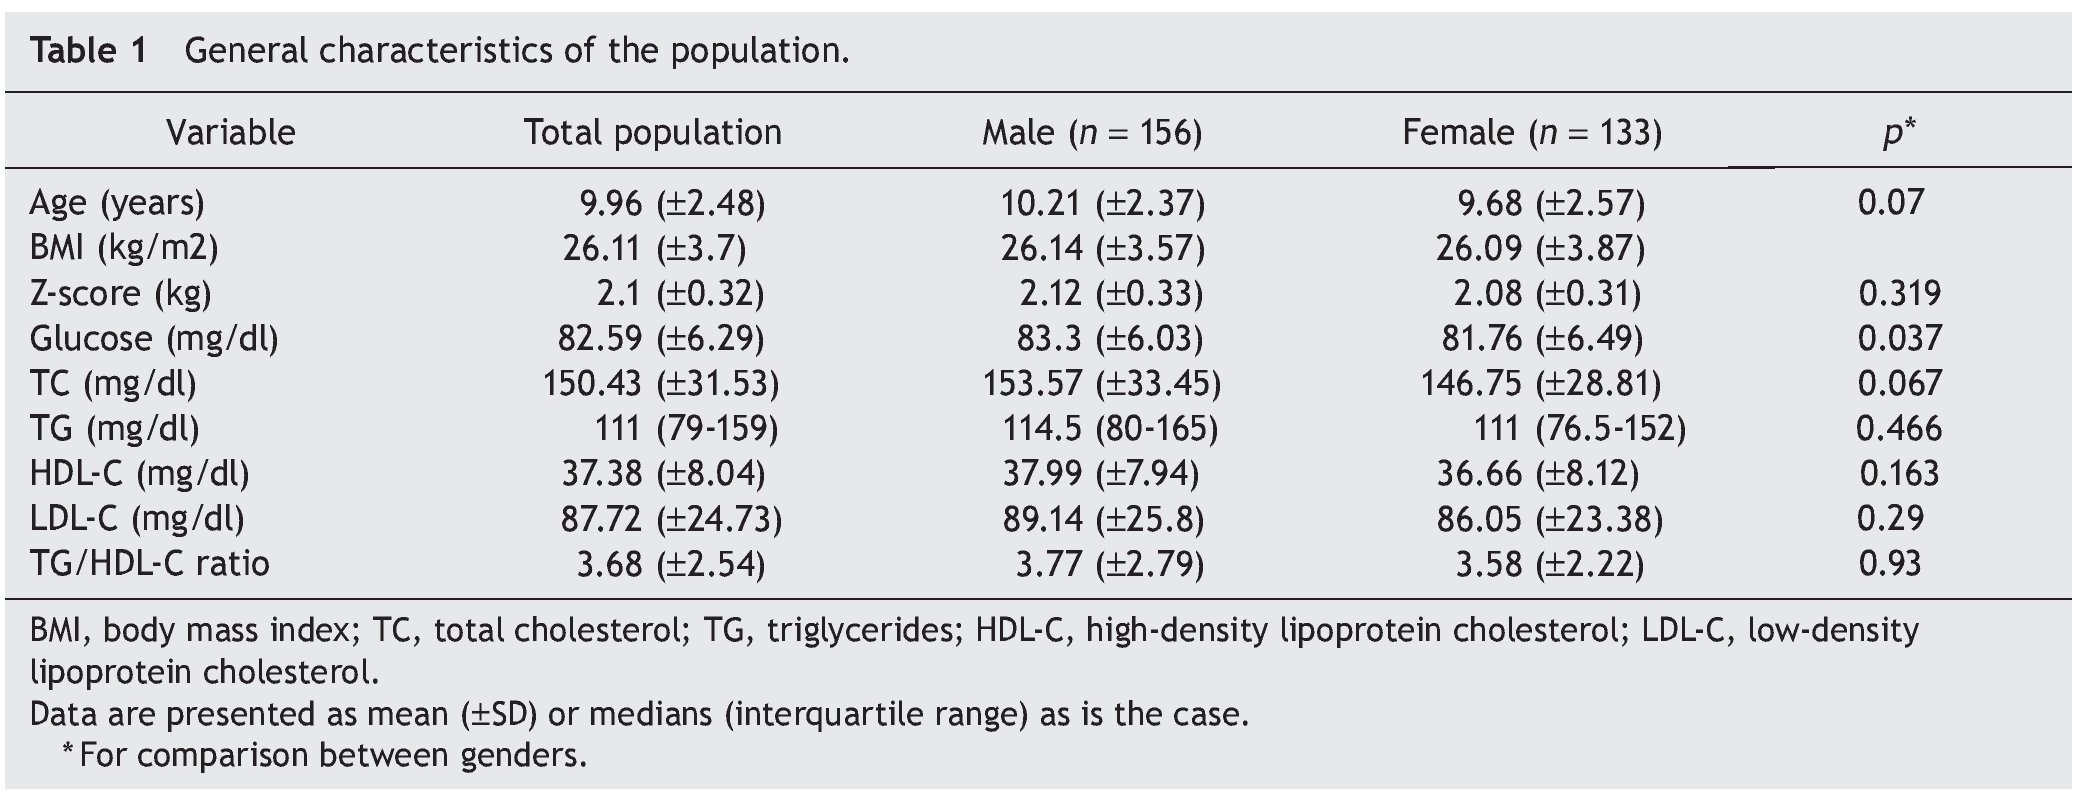
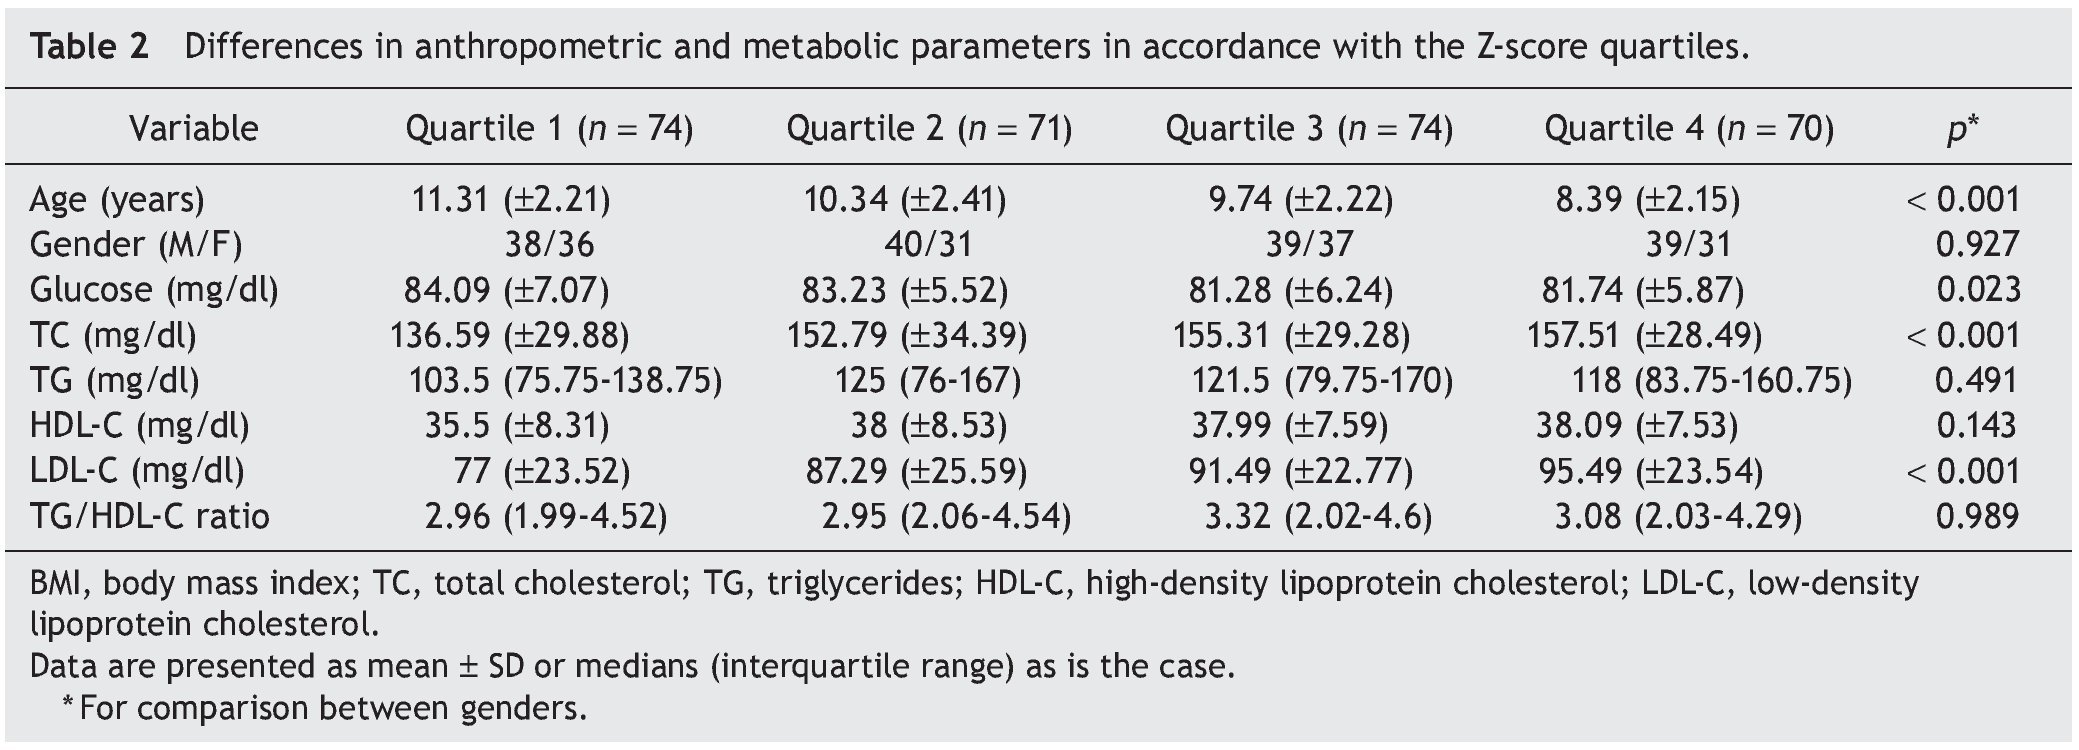
We included 289 children and adolescents between 6 and 17 years of age (9.96 ± 2.48 years) with an average BMI of 26.11 ± 3.7, average Z-score of 2.1 ± 0.32, and average percentile of 97.75 ± 1.68; 156 were males and 133 females (Table 1). The difference of the different variables according to the Z-score quartiles is shown in Table 2. A difference was found with regard to age, glucose, TC and LDL-C. In the post hoc analysis, the last quartile of the TC and LDL-C was different from the rest of the population. The upper quartiles were made up mainly by younger children.


Z-score demonstrated a positive correlation with TC and LDL-C (r = 0.214, p <0.001 and 0.228, p <0.001, respectively). There was no significant correlation between the Z-score and HDL-C (r = 0.106, p = 0.072), TG (r = 0.091, p = 0.124) or TG/HDL-C ratio (r = 0.028, p = 0.138), the last two transformed to the natural logarithm as was established in the statistical analysis section. Multiple regression analysis demonstrated that TC kept its association with the Z-score (β = 21.21, 95% CI 9.96-32.47, p <0.001, R2 = 0.046), whereas for LDL-C the associations with the Z-score remained significant (β = 12.69, 95% CI 3.06-22.31, p = 0.01) and age (β = -1.55, 95% CI -2.79 to -0.31, p <0.014). This last model had an R2 = 0.072.
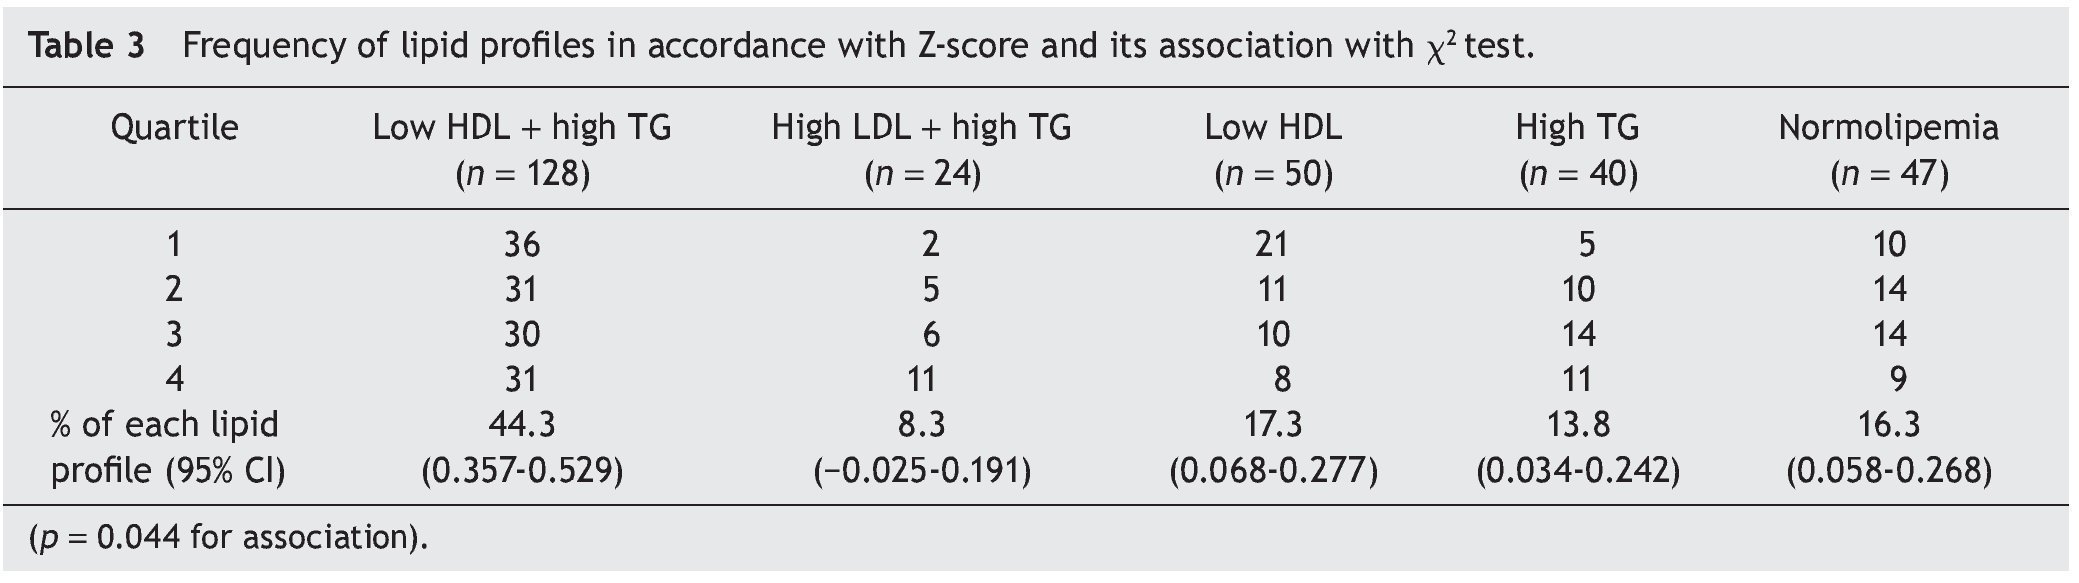
Subsequently the population was divided according to the metabolic profiles mentioned previously (Table 3). The most frequent profile was the low HDL-C plus hypertriglyceridemia (n = 128, 44.29% of the population). Taking the different parameters of the lipid profile separately, whether or not forming part of the profiles previously described, a total of 178 patients had low HDL-C (61.59%), 190 had hypertriglyceridemia (65.74%) and 24 elevated LDL-C (8.3%). Only 47 individuals were normolipemic (16.26%). χ2 analysis demonstrated an association that, above all, is seen towards a greater frequency of the high LDL-C profile plus hypertriglyceridemia, and a lower frequency of the profile of only low HDL-C in those with a higher Z-score (p = 0.044).

4. Discussion
Adiposity has been related with an unfavorable metabolic profile throughout the spectrum of the BMI including normal and obese patients. In obese children, although the prevalence of dyslipidemia is elevated,10 the correlations between the degree of obesity and lipid levels are of little help in predicting dyslipidemia according to the BMI.9
This study demonstrates that, in obese children, a positive correlation exists between BMI (as Z-score) with TC and LDL-C. This fact translates to a greater frequency of elevated TC and LDL-C in the upper quartiles of the Z-score, a relationship that remains after the other variables are adjusted such as age, gender and physical activity. A similar study carried out in obese and overweight children in China demonstrated similar correlations with the LDL-C to that described in our analysis, although in that study a positive correlation was also found with triglyceride levels and negative with HDL-C levels.9 We believe that the difference between the results of Gong et al. and those obtained in our study is because here we did not include patients with BMI values <95 percentile. Although an increase in the plasma TG concentrations associated with an increase in BMI has been demonstrated in children,10 it is probable that the differences between patients with percentiles so close be so small that they would have required a greater sample size for it to be able to be demonstrated.
Whereas we found no studies that demonstrated an association between degrees of obesity and higher levels of TC and LDL-C, Kolsgaard et al. reported that in obese children who lost weight, the TC and LDL-C levels were reduced even when the weight loss was minimal. An increase in BMI was related to a deterioration in the levels of these lipids.12 Another study showed that moderate weight loss caused the same pattern in the variation of TC and LDL-C levels without change in HDL-C and TG levels.13 The concomitant elevation of both lipid parameters (TC and LDL-C) is plausible, given that a significant fraction of the TC is determined by the LDL-C. From the biological point of view, this positive correlation between BMI and the TC/ LDL-C levels may be due to an increase in central adiposity. In the Bogalusa Heart study, children aged 5-17 years who had had an increased abdominal girth, also had higher concentrations of LDL-C, compared with their peers in weight and height.14
On the other hand, the high prevalence of some type of dyslipidemia in the population here reported is notable, given that only a small part had completely normal lipid levels. It is known that in Mexico there is a high prevalence of dyslipidemias (especially hypoalphalipoproteinemia), which is found within the highest rates of prevalence reported worldwide; in addition, this prevalence is increased in subjects who are overweight or obese.15
In another study, Salvatore et al. recently showed a prevalence of low HDL-C >80% in a population of obese American children. It should be noted that this study did not report data of ethnicity.16
Another important aspect in this study is that cut off points for diagnosing dyslipidemia have been adjusted by percentiles according with age, in contrast to some studies that take fixed cut-off points for all ages, which can contribute to some individuals with dyslipidemia being reported with normal lipid levels.10 Thus, it is considered that the approximation to the prevalence of dyslipidemias in Mexican obese children in this work provides reliable data.
In our population the most common lipid profile was hypertriglyceridemia with low HDL-C; also both anomalies separately constituted the most frequent lipid abnormalities. In the obese population, this phenotype of lipoproteins can be explained by central adiposity and resistance to insulin associated with this condition. This resistance, in turn, causes excessive lipolysis and overproduction of free fatty acids, which are captured by the liver to produce lipoproteins rich in TG and are exchanged with particles of HDL-C, which results in high levels of TG and low levels of HDL-C-, characteristic phenotype of metabolic syndrome17 and very common in the Mexican population.18 In Mexico, generally, the low HDL-C levels are the most common type of dyslipidemia and is found in >38.5% of the national population.19
On the other hand, there are genetic factors that can help to explain the lipid phenotypes in this study, such as the association between the low HDL-C levels and a non-synonymous polymorphism of the ATP A1 (ABCA1) binding cassette transporter, variant Arg230Cis, in the Mexican population15 and that, up to now, had only been described in the Amerindian population.20 In the Mayan population to which some of our patients belong, the allelic variant has been found in a frequency of 28.8%, which is significantly higher than the 10.9% frequency described in the Mexican mestizo population.21 Also in the Mayan population, the Q192R polymorphism of the human paraoxonase/ arylesterase enzyme that confers antioxidant properties to the HDL-C has been associated with a greater proportion of males with low levels of HDL-C.22 It is important to mention that the frequency of these alleles is much less than the frequency with which we found low levels of HDL-C in our study population.23 Therefore, it is probable that other factors different from the genetic factors (such as the previously mentioned central obesity) contribute to this higher prevalence of low HDL-C. Importantly, the R230C polymorphism of ABCA1 is associated with smaller particles of HDL-C, and these particles have been positively related with coronary artery disease.24 In Yucatan, ischemic heart disease was the main cause of death in 2008, causing a mortality rate of 78.7 deaths//100,000 inhabitants that year.25
Because many of the anomalies described in this study can be attributed to hyperinsulinemia, it would have been useful to determine the insulin levels to explore the association between the lipid profile and sensitivity to insulin. For this reason, the analysis of the TG/HDL-C ratio was included, which has been markedly associated with the sensitivity to insulin as measured by whole body insulin sensitivity index (WBISI)26 and with the concentration of fasting serum insulin (ISA).27 Although an association between the TG/HDL-C ratio and the different quartiles of the Z-score was not found, it is important to mention that all quartiles were close to a ratio of 3.0, a cut-off point that has been related with insulin resistance by ISA in the Hispanic population.27 This suggests that there is a resistance to insulin in almost the entire population. To determine if those individuals with less resistance to insulin are frequently normolipemic, it is recommended to include the measurement of insulin in future studies.
Another limitation of the study was that normal weight individuals were not included so as to be able to discern which of the lipid phenotypes are more subjected to weight and which to genetic aspects inherent to our population. However, one must remember that this analysis was done in the framework of an assistance program for children with infantile obesity, so those children without metabolic risk were not sent for analysis or care.
In conclusion, this study suggests that there are changes in the lipid profile at an early age that are unfavorable and related with cardiovascular risk factors in obese children. Also, a positive correlation between BMI and levels of TC and LDL-C are shown, even in the highest percentiles of BMI in children. The most common abnormal lipid profile in this population was low HDL-C plus hypertriglyceridemia. However, this lipid profile among the group of obese children is not related to the BMI. Studies with a larger sample size are required to confirm these results.
Conflict of interest
The authors declare no conflict of interest of any nature.
Acknowledgments
The authors thank the Secretaries of Health and Public Education of the state of Yucatan and the Independent University of Yucatan for the facilities provided for this study and for the interest in the problem of childhood obesity. We are grateful for the major contributions to the study provided by Dr. Ignacio Urreola Chi, for technical support, and Dr. Rita Esther Zapata Vázquez, for statistics advice. Fernando Herrera and Alberto Alcocer compiled the information for the study and obtained the funds required for the biochemistry analyses. Ruy Arjona and Carolina Sumárraga performed the statistical analyses and wrote the manuscript.
The article is supported by funds from the Secretary of Public Education of the state of Yucatan, through the PIOY Program.
Received 30 April 2013;
accepted 12 December 2013
* Corresponding author.
E-mail:ruy.arjona@uady.mx (R.D. Arjona-Villicaña).