


Our study extends prior research on the investment decision-making process focusing on investors’ perception. On the basis of the Starbuck and Milliken (1988) model that divides perception into two stages, noticing and sense making, we investigate the driving factors of perception and provide empirical evidence on the interaction between environmental factors and individual traits. We test the empirical predictions of our model with an experiment on a takeover bid. Our results show that: (a) the distinction between noticing and sense making is significant to examine investors’ information processing, since the driving factors and interactions of the two stages are different, (b) a high ambiguity context negatively influences the two phases of investors’ perception; while the individual cognitive profile affects this negative influence on noticing, it does not affect it on sense making, (c) information clarity, without considering other contexts or personality factors, improves noticing but it does not produce significant effects on sense making, (d) the reliability of the source of information only has an effect on noticing and sense making when it interacts with other context variables and the cognitive profile affects this influence, and (e) the most relevant cognitive variable in noticing is ambiguity–tolerance, whereas in sense making it is intuition.
New information causes fluctuations in stock market prices (Mahmood et al., 2011). Warneryd (2001) suggests that investors make their decisions on the basis of their expectations regarding new information. The literature considers that the black box of the market is the investors’ information processing, since it contains the key factors of the decisions they make. Behavioral finance emphasizes that opening that black box allows an explanation of the inefficiencies observed in financial markets not predicted by the Theory of Efficient Markets (EMH). Oberlechner and Hocking (2004) find that financial markets may be less about the actuality of economic facts than about how information is noticed and interpreted by market participants and emphasize the relevance of market participants’ attitudes on information processing. This knowledge can facilitate defining strategies or behaviors for reducing the gap between actual markets and efficient markets. The study of the decision-making process is considered relevant not only to explain the dynamics of financial markets but also to help financial advisors develop their prescriptive activity of advising in a more effective way (Kahneman and Riepe, 1998).
Our study extends prior research on investment decision-making when new information enters to the market. The way investors perceive new information turns out to be pivotal for the decisions they make. We investigate the driving factors of investors’ perception and provide empirical evidence on the interaction between environmental factors and individual traits on this process. To our knowledge, the interaction of the particular variables we consider has not been previously studied in the financial literature as a determinant of investors’ decisions. Our environmental variables are ambiguity, clarity of the informative stimulus, and reliability of the source of information. The individual cognitive profile consists of the investor's cognitive style, ambiguity–tolerance, and proactivity.
Financial decisions are compelled and constrained by non-financial factors. These include context factors as well as personality characteristics of individuals which moderate the way in which the environment affects decisions (Holden, 2010). Among the environmental factors that influence investors’ decisions, information plays an essential role. Investors make up their minds regarding the uncertainties involved in any investment based on the information they receive from different sources (Mahmood et al., 2011). Moreover, De Bondt and Thaler (1994) argue in their ground-breaking paper that it is indispensable to consider psychological variables and processes when approaching the market. In the same vein, Statman (1999) denies that behavioral finance introduced psychology into finance, since psychology was never out of finance. Finally, Oberlechner and Hocking (2004) state that psychologically informed empirical research may contribute to a better understanding of actual information processing in markets by considering attitudes of market participants and examining the role of the sources of information and their influence on investors.
Previous literature demonstrates the activation of differential information processing among individuals. This evidence reveals that it is difficult to identify the individual characteristics driving this process. Perhaps this is the reason that the individual characteristics have often been represented by demographic variables such as age, sex, qualifications, and experience.1 Nevertheless, the impact of these demographic variables is usually explained by appealing to cognitive aspects and different attitudes. Therefore, we consider it more appropriate to introduce the cognitive variables and the individual attitudes into the model directly and not by means of demographic variables (Santos et al., 2011).
Our research uses the Starbuck and Milliken (1988) perception model that divides perception into noticing and sense making. We identify variables that explain how investors notice some news but ignore other news and how they interpret what they do notice. We then analyze how the characteristics of the information interact in each of the phases of investors’ perception. To do so in a controlled way, we develop an experiment involving news of a takeover bid.
This paper is organized as follows: in the following section, we introduce the investor cognitive model; section three presents the interacting factors in the cognitive model and the hypotheses to test; section four describes the details of our experiment; section five summarizes our main empirical results; and section six discusses the main implications of our study.
2Investor cognitive modelGarcía-Ayuso and Jiménez (1996) argue that research on financial decision-making can be conducted by means of cognitive models. Lovric et al. (2008) show that processes such as perception and action are commonly included in cognitive models (e.g., Sloman, 2001; Warren, 2006).
Perception is the cognitive process by which individuals gather information and create an image of their surrounding reality. However this perception generates an imperfect awareness of reality; from the same informative stimulus, one can find that two individuals perceive different realities (Fahey and Narayanan, 1989). The literature has stressed the diversity of factors that influence and intervene in the perception process. The perception process can be divided into two stages (Starbuck and Milliken, 1988): the first one is “noticing” where the individual distinguishes signals (relevant information) from noises (irrelevant information); the second is “sense making” where the individual interprets those signals.
Our investor model integrates these proposals to define a cognitive model of investors’ decision-making into three stages: noticing, sense making, and action. In this paper, we focus on the first two stages of this model; we study how the interaction of context variables and individual traits affects the investors’ noticing and sense making.
Noticing is a key element in a decision-making model because, as Starbuck (1988) argues, those individuals unable to notice relevant changes will find it difficult to meet their goals. Such difficulties will arise either because the individual will not properly modify the way they use their knowledge or because they have not recognized the need to further enhance their knowledge. Karlsson et al. (2009) study investors’ selective attention – the individuals’ capacity to consider the stimuli as signals or noises.
Once the stimuli have been noticed and the investor has differentiated between noises and signals, the individual makes sense of the signals noticed. As was the case in noticing, not all investors interpret relevant information in the same way due to individual traits (Starbuck and Milliken, 1988; Braunstein and Welch, 2002; Santos and Barros, 2011).
Finally, action occurs as a consequence of the information-processing carried out by the investor.
3Interacting factors: environmental variables and individual traitsThere are many papers that focus on the main factors influencing the investment decision-making process. Some papers concentrate on the effect that environmental characteristics have on decision-making, whereas others add to the analysis by recognizing that the attitudes and cognitive profile of investors are moderating factors in the way environment affects decision-making. Our goal is to extend prior research by identifying the driving factors of investors’ information-processing and providing empirical evidence on the interaction between environmental factors and individual traits on this process.
In this section we introduce the interacting factors: the investor's cognitive profile – cognitive style, ambiguity tolerance and proactivity (considered as moderating factors); and the environmental factors – ambiguity, information clarity, and source reliability. We then empirically test the interactions between environment and cognitive profile on the noticing and sense making stages. Thus, our first task is to divide the perception process into noticing and sense making to test whether there are different driving factors in each of these two stages.
The evidence shows that an individual's cognitive profile has a role in the different phases of the investor's perception. Thus, it has been argued that emotions, education, genetics (Barnea et al., 2010) and the social environment have an influence in shaping not just what, but how information is interpreted (Braunstein and Welch, 2002).
The first characteristic considered in the investor cognitive profile is cognitive style. Cognitive style is the way an individual processes and evaluates information. This affects the way individuals explore their environment to collect information, how they integrate their interpretations using mental models and subjective theories (Hayes and Allinson, 1998) and how they use such information to guide their behavior. We use the bipolar scale proposed by Allinson and Hayes (1996) which classifies individuals into two groups: analytic and intuitive. Analytic individuals study the problems in detail and make decisions based on mental reasoning, whereas intuitive individuals base their decisions on sentiments. To identify investors’ behavior, Shiller and Pound (1989) consider whether the individuals analyze the financial information on stocks on their own before buying them. Analytic individuals are more prone to analyze information before making a decision than intuitive ones.
The second characteristic of our cognitive profile is ambiguity tolerance. This characteristic measures the way an individual perceives and processes information about ambiguous stimuli or situations, or the way an individual faces complex, incongruent or unfamiliar data. Ambiguity–tolerance is measured with an uni-dimensional scale. Those individuals with low ambiguity tolerance consider ambiguous situations as threats (Sully de Luque and Sommer, 2000; Ling et al., 2005). On the other hand, those individuals with high ambiguity-tolerance accept that uncertain situations can change quickly and unexpectedly and that available information can be confusing, complex and/or inadequate (McNally et al., 2009).
Ghosh and Ray (1997) find that the role of risk-tolerance and ambiguity–tolerance in decision-making depends on the risk and ambiguity levels. They also find that these two cognitive traits determine the individuals’ behavior in the decision-making process. In the same vein, we consider ambiguity–tolerance as a key variable of individual behavior. Therefore, our analysis goes deeper into this issue by identifying its influence on the two first stages of the cognitive model, before the action stage.
The last cognitive profile characteristic considered is proactivity. A proactive personality is considered a stable disposition which takes personal initiative in a broad range of activities and situations (Seibert et al., 2001). Proactive individuals look for opportunities, show initiative, are entrepreneurs and persevere until they achieve their goals. Proactive behavior is anticipatory and looks for future benefits; hence, proactive individuals are motivated to process information (Grant and Ashford, 2008). Proactive individuals are also less affected by the stimuli from the environment than reactive individuals (Kickul and Gundry, 2002; Zaleznik, 1977). Therefore, proactivity is a key variable in information processing for investment decisions.
Once we have described the cognitive profile factors to be considered in our paper we proceed to introduce the environment factors. Ambiguity is a key factor in financial markets. An ambiguous scenario takes place when the decision-maker doubts what is going to happen and does not have enough information to estimate the probability distribution of the different outcomes of future events (Frisch and Baron, 1988; Ghosh and Ray, 1997). Ambiguity influences decision-making differently than it does risk, because risk, according to classic finance theory, can be measured using the probability distribution which is known (Ellsberg, 1961; Ghosh and Ray, 1997). Arnold et al. (2010) distinguish soft information from hard information. Soft or ambiguous information, unlike hard or less ambiguous information, is not numerical, can be interpreted in several ways, and can influence investors’ portfolio choices.
Epstein and Schneider (2007), Garlappi et al. (2007), and Epstein and Schneider (2008) analyze how ambiguity embedded in information on investment returns affects portfolio composition. News which reduces ambiguity may be good and raise portfolio weights, or bad and decrease portfolio weights. Hence, a decrease in ambiguity has a positive impact in trading. Some authors analyze the impact of ambiguity only on sense making. Ahmed et al. (2009) show empirically that the quality of the information issued by the market moderates the discrepancies among agents to interpret such information.
However, such analyses do not take into account the individuals’ cognitive profile. In contrast, Ellsberg (1961), Einhorn and Hogarth (1985) or Ghosh and Ray (1997) have studied how ambiguity and risk influence investment decision-making as a function of some investors’ traits, e.g. conservatism, preferences, ambiguity–tolerance, level of confidence.
In order to analyze the impact of ambiguity on the two first phases of our decision-making model, our paper considers each stimulus in two scenarios: one of low ambiguity and the other of high ambiguity.
Mischel (1973) finds empirical evidence of the impact of clarity on decision-making. He distinguishes strong from weak situations2, the latter having diffuse meanings. Specifically, Allport and Postman (1947) consider that rumors are characterized by doubt as they are unaccompanied by the “secure standards of evidence”. By means of noticing, people recognize the novelties in the information which they consider relevant for their decision-making process (Louis and Sutton, 1991). We consider that these novelties will be more recognizable if the information is clearer.
DiFonzo and Bordia (1997) study the link between rumors and behavior in the stock market. They argue that in such highly uncertain environments as financial markets, rumors play an important sense making role.
Bruner (1957) argues that as the stimulus becomes more complex and ambiguous the individual's perception will depend more on the individual and less on the stimulus. Thus, the interaction among individual cognitive profile, ambiguity and information clarity will influence the two phases of perception: noticing and sense making.
Our third context factor is the reliability of the source of the information. The relevance of this factor in investment decision-making has been widely studied.3 The most common and cheapest source of information for an investor is newspapers, either specialized in financial news or not. But there are other sources of information that the investor can rely on such as conversations with other investors or agents participating in the financial markets (Lovric et al., 2008). All of these sources play an essential role by disseminating information in the financial markets (Oberlechner and Hocking, 2004).
Thayer (2011) shows that, despite of the fact that investors generally choose sources of information based on reliability, they forgo this reliability to confirm the adequacy of their investment positions. Oberlechner and Hocking (2004) find that market participants consider the reliability of the source of information to be less important than its speed. Therefore, the reliability of the source of information is relevant in investors’ perception when it interacts with other variables. Finally, Shiller and Pound (1989) studied the relevance of the conversations among agents in the market on investment decision-making, and found that the individual investors who bought an asset did so because such asset got their attention after conversations with other investors. Attention is an issue in noticing. Thus in our paper we classify the sources of information as reliable or non-reliable.
The hypotheses of our paper are summarized as follows:H1 There are differences among the driving factors of noticing and the ones of sense making. Ambiguity negatively affects noticing and sense making. The individual's cognitive profile moderates the influence of ambiguity on noticing and sense making. Information clarity has a positive impact on noticing. The interaction among the individual cognitive profile, ambiguity and clarity has an impact on noticing and sense making. The reliability of the source of information only has an effect on noticing and sense making when it interacts with other context variables and the cognitive profile affects this influence.
We developed an experiment to investigate the driving factors of investors’ noticing and sense making to provide empirical evidence on the interaction between environmental factors and individual traits in each of these two stages of the decision-making process. The experiment was administered through the use of three documents: the first document described the experimental design, the task and the payments; the second document was a questionnaire to measure participants’ cognitive profile; and the third document was the decision-making task.
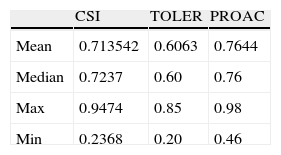
The cognitive profile questionnaire measured their analytic/intuitive style, ambiguity-tolerance, and proactivity. The analytic/intuitive style was measured using Allinson and Hayes (1996) Cognitive Style Index (CSI). This instrument consists of 38 statements,4 each rated using a 3-point scale (true; uncertain; false). The range of scores runs from 0 to 76. Individuals with an analytical style obtain high scores on the CSI, while intuitive individuals get low scores. The Cronbach alpha for this scale is 0.857, so its internal consistency can be considered satisfactory. Four statements initially proposed by Lorsch and Morse (1974) and adapted by Westerberg et al. (1997) were used to test tolerance for ambiguity. Acedo and Jones (2007) report a 0.76 composite reliability for the measure. Finally, proactivity was assessed with a 10-item scale developed by Seibert et al. (1999) with alpha reliability 0.88. All items of the ambiguity-tolerance and proactivity scales were measured on a 5-point Likert scale ranging from 1 “strongly disagree” to 5 “strongly agree”.
After completing the questionnaire, participants were given the third document with the task setting. In 12 different situations the participants were given information on a possible takeover bid (TOB) announcement (the stimulus). Participants then answered the same question about the effect on share price for the target firm and for the bidder for each scenario. Hence, for each company involved in the TOB, the participants had to indicate whether they thought that in the short term the information would have an impact on the share price of the company (noticing) and if so, whether the price would rise or fall (sense making). Participants were told that they were going to be rewarded on the basis of the rationality of their answers.
In the noticing stage, if the participant indicated that the share price would remain unchanged, we classified their perception of the stimulus as noise; if the participant indicated that the share price would change (rise or fall), we classified the stimulus as a signal. The results of the sense making step were classified by the signal interpretation: positive when answering that the share price would rise and negative otherwise.
Bruner (1957) argues that the more complex and ambiguous a stimulus is, the more relevant individual traits are in the decision-making process. Thus, to reproduce different levels of complexity, in our 12 scenarios participants were provided with information about the possibility of the forthcoming TOB announcement, but not the TOB announcement itself.
We choose a TOB to analyze individual investment decision-making because this strategic information is easily recognizable and identifiable, and the participant's perception and behavioral bias impact the final outcome. Rosen (2006) posited that investor sentiment is a key factor in the reaction to an announced merger or takeover.
Widespread consensus is found in financial literature that target firms’ shareholders made large gains from takeovers (Firth, 1980). In contrast, some studies have found that the share prices of the acquiring companies fell on the announcement of the TOB (Meeks, 1977; Utton, 1974), while others found either positive gains or zero gains for the shareholders of acquiring companies (Kummer and Hoffmeister, 1978; Langetieg, 1978). This wider range of possible change in the share price of the bidding firms allows us to operationalize the variable ambiguity in each of the scenarios of our experiment. Thus, for the same informative stimulus, participants face a less ambiguous situation when responding to the questions on the target firm's shares than when responding on the bidding firm's shares.
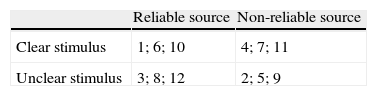
The 12 scenarios were divided into four classes depending on the two levels of clarity of the stimulus (clear or diffuse) and the two levels of reliability of the source of information (reliable or non-reliable), as shown in Table 1: (a) scenarios with a clear stimulus and a reliable source (situations 1, 6, and 10), (b) scenarios with a diffuse stimulus and a non-reliable source (situations 2, 5, and 9), (c) scenarios with a diffuse stimulus and a reliable source (situations 3, 8, and 12), and (d) scenarios with a clear stimulus and a non-reliable source (situations 4, 7, and 11).5
Scenarios classification.
| Reliable source | Non-reliable source | |
| Clear stimulus | 1; 6; 10 | 4; 7; 11 |
| Unclear stimulus | 3; 8; 12 | 2; 5; 9 |
In the decision task of the experiment, individuals faced 12 scenarios classified into four types depending on the two levels of information clarity and the two levels of reliability of the source of information.
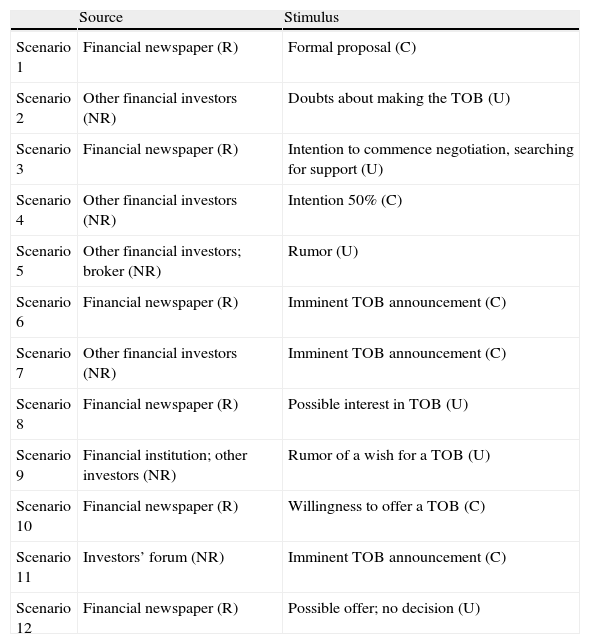
Table 2 shows how the variable clarity of the stimulus was operationalized. We distinguish between news and rumors. Using the characterization of rumors given by Allport and Postman (1947), DiFonzo et al. (1994) and Oberlechner and Hocking (2004), we consider them as unclear stimulus in our experiment. Therefore, we only consider a clear stimulus as those situations describing an imminent TOB announcement or where the bidder has already decided to announce the TOB (see Table 2).
Sources and informative stimulus corresponding to each proposed scenario in the experiment.
| Source | Stimulus | |
| Scenario 1 | Financial newspaper (R) | Formal proposal (C) |
| Scenario 2 | Other financial investors (NR) | Doubts about making the TOB (U) |
| Scenario 3 | Financial newspaper (R) | Intention to commence negotiation, searching for support (U) |
| Scenario 4 | Other financial investors (NR) | Intention 50% (C) |
| Scenario 5 | Other financial investors; broker (NR) | Rumor (U) |
| Scenario 6 | Financial newspaper (R) | Imminent TOB announcement (C) |
| Scenario 7 | Other financial investors (NR) | Imminent TOB announcement (C) |
| Scenario 8 | Financial newspaper (R) | Possible interest in TOB (U) |
| Scenario 9 | Financial institution; other investors (NR) | Rumor of a wish for a TOB (U) |
| Scenario 10 | Financial newspaper (R) | Willingness to offer a TOB (C) |
| Scenario 11 | Investors’ forum (NR) | Imminent TOB announcement (C) |
| Scenario 12 | Financial newspaper (R) | Possible offer; no decision (U) |
Notes: R=reliable source, NR=non-reliable source, C=clear stimulus, U=unclear stimulus.
As can be seen in Table 2, the variable reliability of the source was operationalized by characterizing financial newspapers as more reliable sources than the opinions of other investors. We assume, a priori, that comments by the press are more reliable than comments by other investors because published information commonly undergoes a fact-checking process and must comply with newspapers’ standards for information quality.
Participants were 96 undergraduate students in the Business Administration degree program. The sample size was determined by the number of students possessing the knowledge required to participate and the available funding for the experiment. All the participants were knowledgeable in financial markets and, particularly takeovers, which make up the content of the informative stimulus offered to participants in the task. The experiment was pretested in a pilot study.
The minimum and maximum payout to a participant was 10€ and 200€, respectively, with an average payment of 17,19€. Participants were rewarded on the basis of the rationality of their answers. We penalized individuals for 3 kinds of non-rational answers: (a) the individual indicates that the share price of the target is going to fall; (b) the individual buys (sells)6 shares when judging the shares prices are going to fall (rise) and (c) in those scenarios with reliable source and clear information, individual believes that the target's shares are going to remain unchanged.
We construct the indexes to measure the behavior of each individual at each step of the cognitive model studied in this paper: noticing and sense making.
In the first stage of the perception process, investors notice the stimulus; therefore, we build relevance indexes for both the target firm (TRI) and the bidder (BRI) to estimate the degree to which participants consider the information as relevant. We construct these indexes as the number of times an individual deems the stimulus to be relevant in the situations corresponding to each type of scenario divided by three, (the number of situations posited in each one of the four types of scenarios):
where NTRI is the number of times the participant answers that the share price of the target firm will rise or fall in scenarios with a clear stimulus and a reliable source.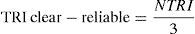
The second stage of perception is sense making. Our focus is to assess if individuals interpret the information noticed in a manner consistent with the financial literature. We define a coherent relevance index for each of the two firms involved in the TOB. The index for the target firm, TCRI is the number of times the participant estimates that the share price for the target firm will rise in the situations corresponding to each type of scenario, divided by the number of times the stimulus is deemed relevant for that firm in those scenarios:
where NTCRI is the number of times a participant believes that the share price of the target firm will rise in scenarios with a clear stimulus and a reliable source of information.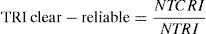
The coherent relevance index for the bidder measures whether the participant believes that the information will have a positive impact on the share price of the bidder (BCRI).7 Therefore, BCRI is the number of times a participant believes that the share price of the bidder will rise in the situations corresponding to each type of scenario, divided by the number of times the stimulus is deemed relevant for that firm in those situations:
where NBCRIR is the number of times a participant believes that the share price of the bidding firm will rise in scenarios with a clear stimulus and a reliable source of information, and NBRI is the number of times the participant answers that the share price of the bidding firm will rise or fall in scenarios with a clear stimulus and a reliable source.5Results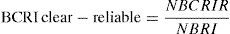
Table 3 shows the main descriptive statistics of the cognitive variables: CSI, TOLER (ambiguity-tolerance) and PROAC (proactivity). On average, participants are slightly more analytic than intuitive, more tolerant to ambiguity, and more proactive than reactive. In the statistical analyses performed to identify the influence of individuals’ cognitive profile on perception, personality variables were categorized into two levels (lower and higher than the mean value, respectively). The independent sample's t-tests conducted between the two categories of each of the three personality variables reflect significant differences in all the cases.
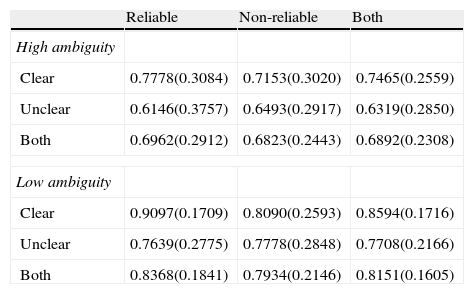
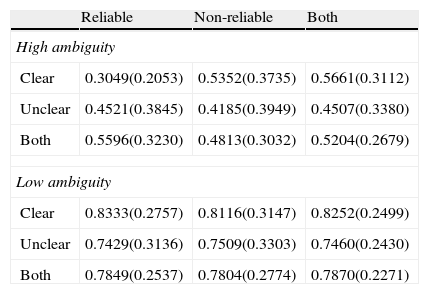
The mean and standard deviation of the relevance indexes in the different types of scenarios are shown in Table 4. These results highlight the strong influence of ambiguity on noticing. Table 5 illustrates the descriptive statistics of the financial coherence indexes when subjects consider the stimulus relevant for the share prices. The impact of ambiguity in the sense making step is still stronger than in the noticing step.
Noticing. Relevance indexes.
| Reliable | Non-reliable | Both | |
| High ambiguity | |||
| Clear | 0.7778(0.3084) | 0.7153(0.3020) | 0.7465(0.2559) |
| Unclear | 0.6146(0.3757) | 0.6493(0.2917) | 0.6319(0.2850) |
| Both | 0.6962(0.2912) | 0.6823(0.2443) | 0.6892(0.2308) |
| Low ambiguity | |||
| Clear | 0.9097(0.1709) | 0.8090(0.2593) | 0.8594(0.1716) |
| Unclear | 0.7639(0.2775) | 0.7778(0.2848) | 0.7708(0.2166) |
| Both | 0.8368(0.1841) | 0.7934(0.2146) | 0.8151(0.1605) |
Relevance index measures noticing. Mean values (standard deviation) in terms of ambiguity, reliability of source and information clarity.
Sense making. Coherent relevance indexes.
| Reliable | Non-reliable | Both | |
| High ambiguity | |||
| Clear | 0.3049(0.2053) | 0.5352(0.3735) | 0.5661(0.3112) |
| Unclear | 0.4521(0.3845) | 0.4185(0.3949) | 0.4507(0.3380) |
| Both | 0.5596(0.3230) | 0.4813(0.3032) | 0.5204(0.2679) |
| Low ambiguity | |||
| Clear | 0.8333(0.2757) | 0.8116(0.3147) | 0.8252(0.2499) |
| Unclear | 0.7429(0.3136) | 0.7509(0.3303) | 0.7460(0.2430) |
| Both | 0.7849(0.2537) | 0.7804(0.2774) | 0.7870(0.2271) |
The coherent relevance index measures sense making. The mean values (standard deviations) in terms of ambiguity, reliability of source and information clarity.
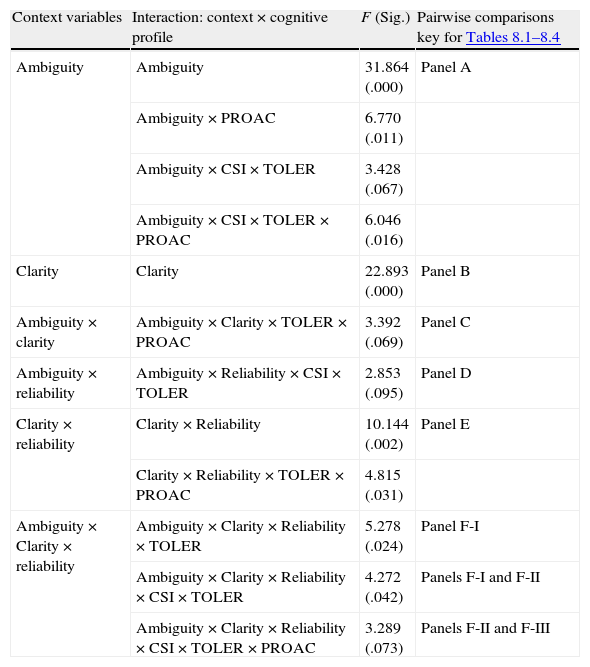
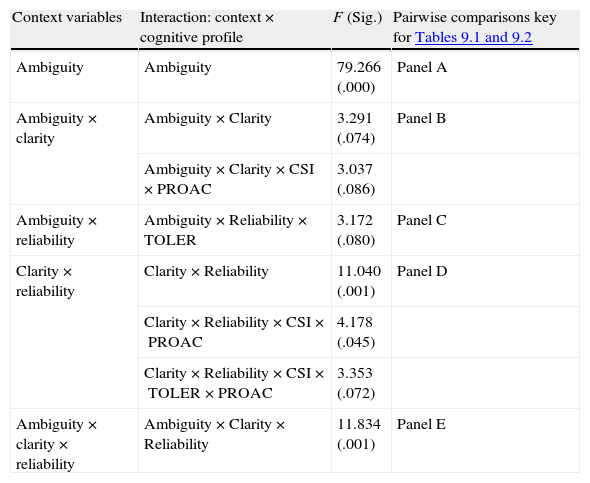
To identify the driving factors in noticing and sense making and the main interactions between the context variables and individual traits considered in these two stages, we carried out repeated measures ANOVA. The significant interactions obtained for the noticing stage can be seen in Table 6 and those for sense making in Table 7. In sense making, financial coherence indexes measure the frequency with which the individual thinks that share prices will rise. The repeated measures ANOVA cannot be done on missing data; hence, it only considers the indexes of those individuals for whom the indexes for the two firms exist in the four types of scenarios proposed. Out of 96 individuals, 22 judged that the share price of at least one of the two firms would not rise in at least one of the four types of scenarios, thus the analysis was run with 74 individuals. Mean differences obtained for noticing and sense making with pairwise comparisons and using the Bonferroni adjustment can be seen in Tables 8.1–8.4 and 9.1–9.2, respectively.
Noticing. Context and cognitive profile interactions.
| Context variables | Interaction: context×cognitive profile | F (Sig.) | Pairwise comparisons key for Tables 8.1–8.4 |
| Ambiguity | Ambiguity | 31.864 (.000) | Panel A |
| Ambiguity×PROAC | 6.770 (.011) | ||
| Ambiguity×CSI×TOLER | 3.428 (.067) | ||
| Ambiguity×CSI×TOLER×PROAC | 6.046 (.016) | ||
| Clarity | Clarity | 22.893 (.000) | Panel B |
| Ambiguity×clarity | Ambiguity×Clarity×TOLER×PROAC | 3.392 (.069) | Panel C |
| Ambiguity×reliability | Ambiguity×Reliability×CSI×TOLER | 2.853 (.095) | Panel D |
| Clarity×reliability | Clarity×Reliability | 10.144 (.002) | Panel E |
| Clarity×Reliability×TOLER×PROAC | 4.815 (.031) | ||
| Ambiguity×Clarity×reliability | Ambiguity×Clarity×Reliability×TOLER | 5.278 (.024) | Panel F-I |
| Ambiguity×Clarity×Reliability×CSI×TOLER | 4.272 (.042) | Panels F-I and F-II | |
| Ambiguity×Clarity×Reliability×CSI×TOLER×PROAC | 3.289 (.073) | Panels F-II and F-III |
Relevance indexes measure noticing. Table displays significant interactions obtained from the repeated measures ANOVA with ambiguity, clarity and reliability as intra-subjects factors and CSI, ambiguity-tolerance (TOLER), and proactivity (PROAC) as inter-subjects factors. For each interaction F statistic (p value) are shown.
Sense making. Context and cognitive profile interactions.
| Context variables | Interaction: context×cognitive profile | F (Sig.) | Pairwise comparisons key for Tables 9.1 and 9.2 |
| Ambiguity | Ambiguity | 79.266 (.000) | Panel A |
| Ambiguity×clarity | Ambiguity×Clarity | 3.291 (.074) | Panel B |
| Ambiguity×Clarity×CSI×PROAC | 3.037 (.086) | ||
| Ambiguity×reliability | Ambiguity×Reliability×TOLER | 3.172 (.080) | Panel C |
| Clarity×reliability | Clarity×Reliability | 11.040 (.001) | Panel D |
| Clarity×Reliability×CSI×PROAC | 4.178 (.045) | ||
| Clarity×Reliability×CSI×TOLER×PROAC | 3.353 (.072) | ||
| Ambiguity×clarity×reliability | Ambiguity×Clarity×Reliability | 11.834 (.001) | Panel E |
The coherent relevance index measures sense making. Table displays F statistic (p value) for each significant interaction obtained from the repeated measures ANOVA with ambiguity, clarity and reliability as intra-subjects factors and CSI, ambiguity-tolerance (TOLER) and proactivity (PROAC) as inter-subjects factors.
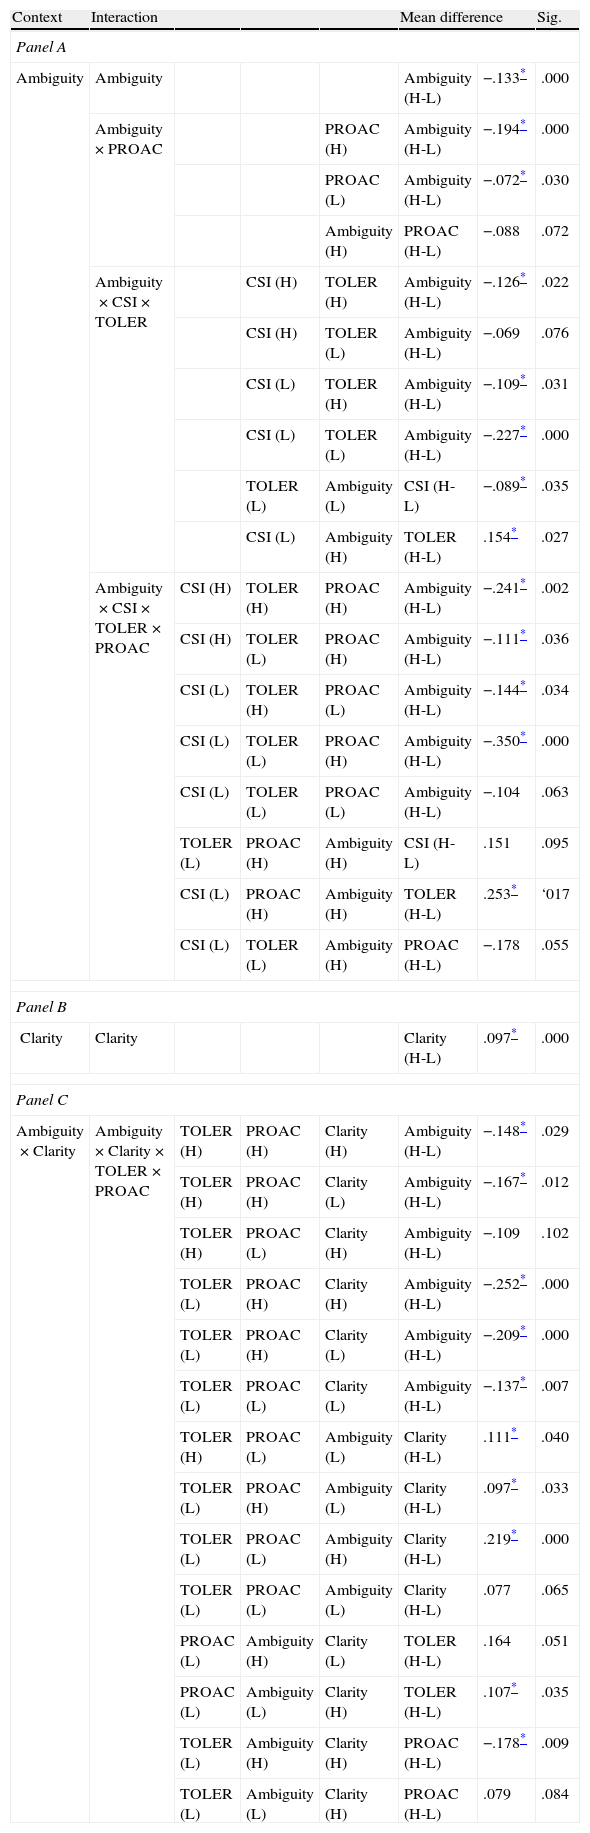
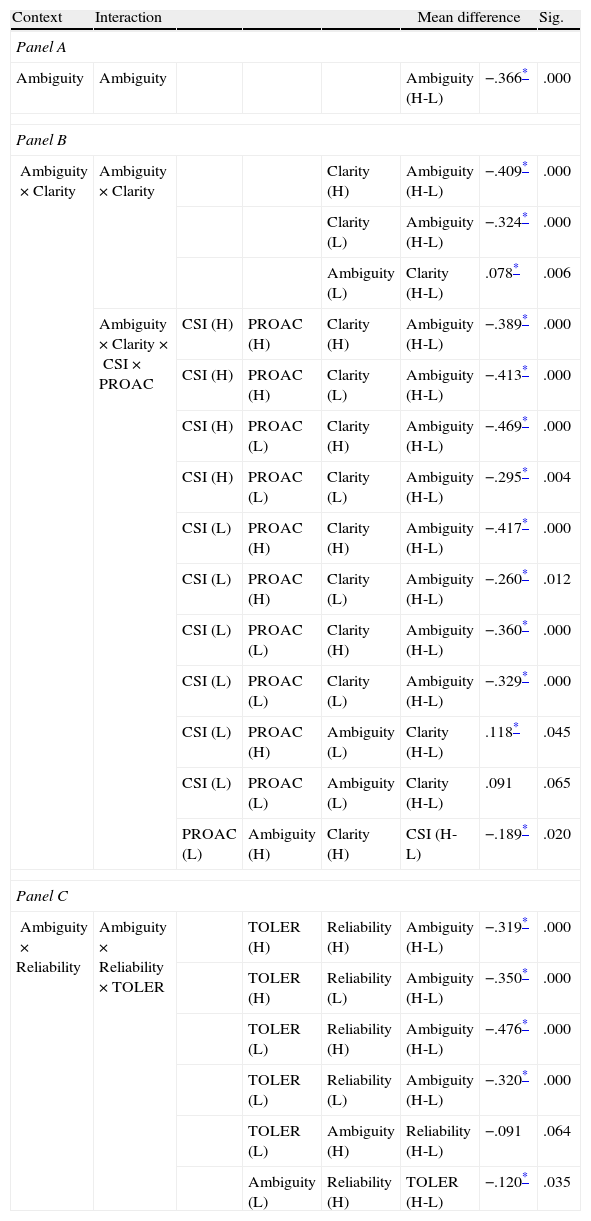
Noticing. Mean differences. Panel A (Ambiguity), Panel B (Clarity), Panel C (Ambiguity×Clarity).
| Context | Interaction | Mean difference | Sig. | ||||
| Panel A | |||||||
| Ambiguity | Ambiguity | Ambiguity (H-L) | −.133* | .000 | |||
| Ambiguity×PROAC | PROAC (H) | Ambiguity (H-L) | −.194* | .000 | |||
| PROAC (L) | Ambiguity (H-L) | −.072* | .030 | ||||
| Ambiguity (H) | PROAC (H-L) | −.088 | .072 | ||||
| Ambiguity ×CSI×TOLER | CSI (H) | TOLER (H) | Ambiguity (H-L) | −.126* | .022 | ||
| CSI (H) | TOLER (L) | Ambiguity (H-L) | −.069 | .076 | |||
| CSI (L) | TOLER (H) | Ambiguity (H-L) | −.109* | .031 | |||
| CSI (L) | TOLER (L) | Ambiguity (H-L) | −.227* | .000 | |||
| TOLER (L) | Ambiguity (L) | CSI (H-L) | −.089* | .035 | |||
| CSI (L) | Ambiguity (H) | TOLER (H-L) | .154* | .027 | |||
| Ambiguity ×CSI×TOLER×PROAC | CSI (H) | TOLER (H) | PROAC (H) | Ambiguity (H-L) | −.241* | .002 | |
| CSI (H) | TOLER (L) | PROAC (H) | Ambiguity (H-L) | −.111* | .036 | ||
| CSI (L) | TOLER (H) | PROAC (L) | Ambiguity (H-L) | −.144* | .034 | ||
| CSI (L) | TOLER (L) | PROAC (H) | Ambiguity (H-L) | −.350* | .000 | ||
| CSI (L) | TOLER (L) | PROAC (L) | Ambiguity (H-L) | −.104 | .063 | ||
| TOLER (L) | PROAC (H) | Ambiguity (H) | CSI (H-L) | .151 | .095 | ||
| CSI (L) | PROAC (H) | Ambiguity (H) | TOLER (H-L) | .253* | ‘017 | ||
| CSI (L) | TOLER (L) | Ambiguity (H) | PROAC (H-L) | −.178 | .055 | ||
| Panel B | |||||||
| Clarity | Clarity | Clarity (H-L) | .097* | .000 | |||
| Panel C | |||||||
| Ambiguity×Clarity | Ambiguity×Clarity×TOLER×PROAC | TOLER (H) | PROAC (H) | Clarity (H) | Ambiguity (H-L) | −.148* | .029 |
| TOLER (H) | PROAC (H) | Clarity (L) | Ambiguity (H-L) | −.167* | .012 | ||
| TOLER (H) | PROAC (L) | Clarity (H) | Ambiguity (H-L) | −.109 | .102 | ||
| TOLER (L) | PROAC (H) | Clarity (H) | Ambiguity (H-L) | −.252* | .000 | ||
| TOLER (L) | PROAC (H) | Clarity (L) | Ambiguity (H-L) | −.209* | .000 | ||
| TOLER (L) | PROAC (L) | Clarity (L) | Ambiguity (H-L) | −.137* | .007 | ||
| TOLER (H) | PROAC (L) | Ambiguity (L) | Clarity (H-L) | .111* | .040 | ||
| TOLER (L) | PROAC (H) | Ambiguity (L) | Clarity (H-L) | .097* | .033 | ||
| TOLER (L) | PROAC (L) | Ambiguity (H) | Clarity (H-L) | .219* | .000 | ||
| TOLER (L) | PROAC (L) | Ambiguity (L) | Clarity (H-L) | .077 | .065 | ||
| PROAC (L) | Ambiguity (H) | Clarity (L) | TOLER (H-L) | .164 | .051 | ||
| PROAC (L) | Ambiguity (L) | Clarity (H) | TOLER (H-L) | .107* | .035 | ||
| TOLER (L) | Ambiguity (H) | Clarity (H) | PROAC (H-L) | −.178* | .009 | ||
| TOLER (L) | Ambiguity (L) | Clarity (H) | PROAC (H-L) | .079 | .084 | ||
Relevance indexes measure noticing. Table displays mean differences from repeated measures ANOVA and the p-value obtained from pairwise comparisons with the Bonferroni test. Intra-subjects factors are ambiguity, clarity and reliability. Inter-subjects factors are CSI, ambiguity-tolerance (TOLER) and proactivity (PROAC).
95% confidence level.
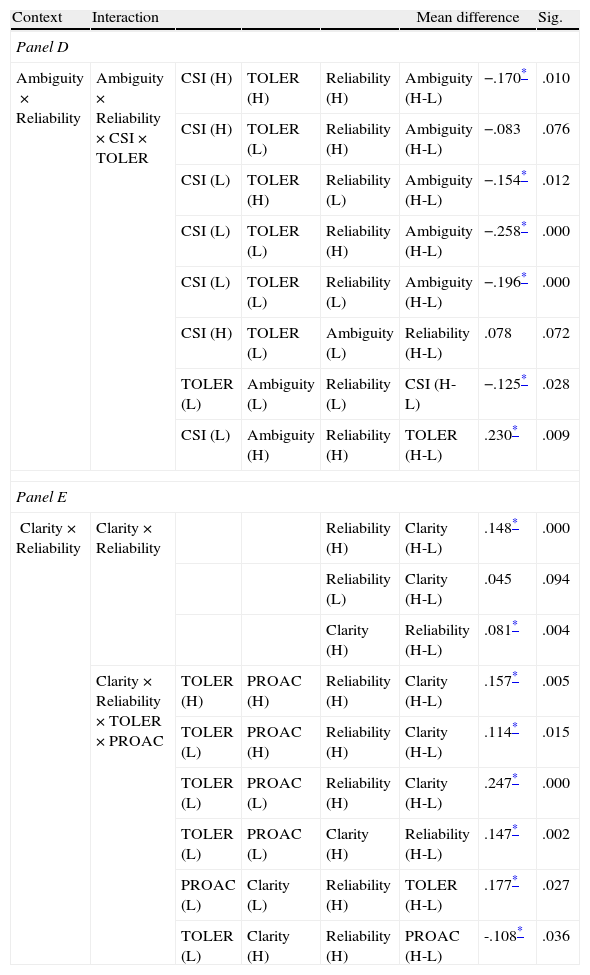
Noticing. Mean differences. Panel D (Ambiguity×Reliability), Panel E (Clarity×Reliability).
| Context | Interaction | Mean difference | Sig. | ||||
| Panel D | |||||||
| Ambiguity×Reliability | Ambiguity×Reliability×CSI×TOLER | CSI (H) | TOLER (H) | Reliability (H) | Ambiguity (H-L) | −.170* | .010 |
| CSI (H) | TOLER (L) | Reliability (H) | Ambiguity (H-L) | −.083 | .076 | ||
| CSI (L) | TOLER (H) | Reliability (L) | Ambiguity (H-L) | −.154* | .012 | ||
| CSI (L) | TOLER (L) | Reliability (H) | Ambiguity (H-L) | −.258* | .000 | ||
| CSI (L) | TOLER (L) | Reliability (L) | Ambiguity (H-L) | −.196* | .000 | ||
| CSI (H) | TOLER (L) | Ambiguity (L) | Reliability (H-L) | .078 | .072 | ||
| TOLER (L) | Ambiguity (L) | Reliability (L) | CSI (H-L) | −.125* | .028 | ||
| CSI (L) | Ambiguity (H) | Reliability (H) | TOLER (H-L) | .230* | .009 | ||
| Panel E | |||||||
| Clarity×Reliability | Clarity×Reliability | Reliability (H) | Clarity (H-L) | .148* | .000 | ||
| Reliability (L) | Clarity (H-L) | .045 | .094 | ||||
| Clarity (H) | Reliability (H-L) | .081* | .004 | ||||
| Clarity×Reliability×TOLER×PROAC | TOLER (H) | PROAC (H) | Reliability (H) | Clarity (H-L) | .157* | .005 | |
| TOLER (L) | PROAC (H) | Reliability (H) | Clarity (H-L) | .114* | .015 | ||
| TOLER (L) | PROAC (L) | Reliability (H) | Clarity (H-L) | .247* | .000 | ||
| TOLER (L) | PROAC (L) | Clarity (H) | Reliability (H-L) | .147* | .002 | ||
| PROAC (L) | Clarity (L) | Reliability (H) | TOLER (H-L) | .177* | .027 | ||
| TOLER (L) | Clarity (H) | Reliability (H) | PROAC (H-L) | -.108* | .036 | ||
Relevance indexes measure noticing. Table displays mean differences from repeated measures ANOVA and the corresponding p-value obtained from pairwise comparisons with Bonferroni adjustment. Intra-subjects factors are ambiguity, clarity and reliability and inter-subjects factors are CSI, ambiguity-tolerance (TOLER) and proactivity (PROAC).
95% confidence level.
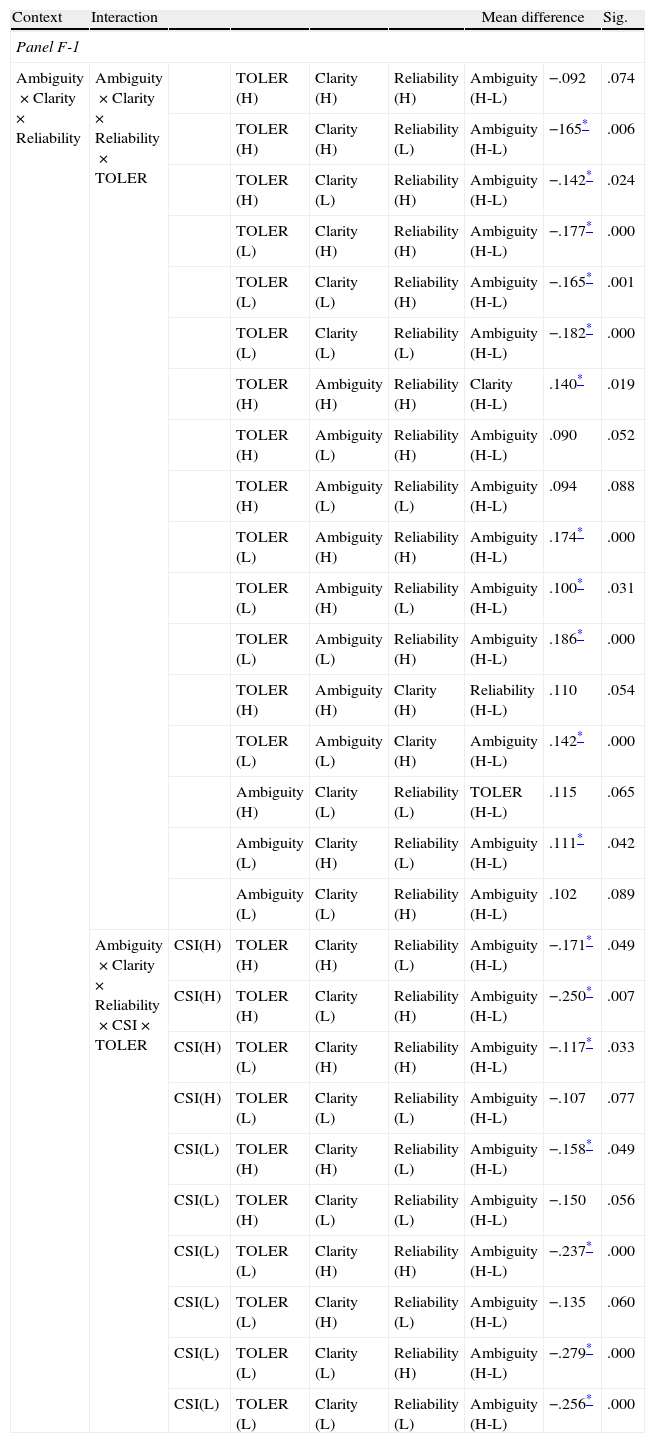
Noticing. Mean differences. Panel F (Ambiguity×Clarity×Reliability).
| Context | Interaction | Mean difference | Sig. | |||||
| Panel F-1 | ||||||||
| Ambiguity×Clarity×Reliability | Ambiguity×Clarity×Reliability×TOLER | TOLER (H) | Clarity (H) | Reliability (H) | Ambiguity (H-L) | −.092 | .074 | |
| TOLER (H) | Clarity (H) | Reliability (L) | Ambiguity (H-L) | −165* | .006 | |||
| TOLER (H) | Clarity (L) | Reliability (H) | Ambiguity (H-L) | −.142* | .024 | |||
| TOLER (L) | Clarity (H) | Reliability (H) | Ambiguity (H-L) | −.177* | .000 | |||
| TOLER (L) | Clarity (L) | Reliability (H) | Ambiguity (H-L) | −.165* | .001 | |||
| TOLER (L) | Clarity (L) | Reliability (L) | Ambiguity (H-L) | −.182* | .000 | |||
| TOLER (H) | Ambiguity (H) | Reliability (H) | Clarity (H-L) | .140* | .019 | |||
| TOLER (H) | Ambiguity (L) | Reliability (H) | Ambiguity (H-L) | .090 | .052 | |||
| TOLER (H) | Ambiguity (L) | Reliability (L) | Ambiguity (H-L) | .094 | .088 | |||
| TOLER (L) | Ambiguity (H) | Reliability (H) | Ambiguity (H-L) | .174* | .000 | |||
| TOLER (L) | Ambiguity (H) | Reliability (L) | Ambiguity (H-L) | .100* | .031 | |||
| TOLER (L) | Ambiguity (L) | Reliability (H) | Ambiguity (H-L) | .186* | .000 | |||
| TOLER (H) | Ambiguity (H) | Clarity (H) | Reliability (H-L) | .110 | .054 | |||
| TOLER (L) | Ambiguity (L) | Clarity (H) | Ambiguity (H-L) | .142* | .000 | |||
| Ambiguity (H) | Clarity (L) | Reliability (L) | TOLER (H-L) | .115 | .065 | |||
| Ambiguity (L) | Clarity (H) | Reliability (L) | Ambiguity (H-L) | .111* | .042 | |||
| Ambiguity (L) | Clarity (L) | Reliability (H) | Ambiguity (H-L) | .102 | .089 | |||
| Ambiguity×Clarity×Reliability×CSI×TOLER | CSI(H) | TOLER (H) | Clarity (H) | Reliability (L) | Ambiguity (H-L) | −.171* | .049 | |
| CSI(H) | TOLER (H) | Clarity (L) | Reliability (H) | Ambiguity (H-L) | −.250* | .007 | ||
| CSI(H) | TOLER (L) | Clarity (H) | Reliability (H) | Ambiguity (H-L) | −.117* | .033 | ||
| CSI(H) | TOLER (L) | Clarity (L) | Reliability (L) | Ambiguity (H-L) | −.107 | .077 | ||
| CSI(L) | TOLER (H) | Clarity (H) | Reliability (L) | Ambiguity (H-L) | −.158* | .049 | ||
| CSI(L) | TOLER (H) | Clarity (L) | Reliability (L) | Ambiguity (H-L) | −.150 | .056 | ||
| CSI(L) | TOLER (L) | Clarity (H) | Reliability (H) | Ambiguity (H-L) | −.237* | .000 | ||
| CSI(L) | TOLER (L) | Clarity (H) | Reliability (L) | Ambiguity (H-L) | −.135 | .060 | ||
| CSI(L) | TOLER (L) | Clarity (L) | Reliability (H) | Ambiguity (H-L) | −.279* | .000 | ||
| CSI(L) | TOLER (L) | Clarity (L) | Reliability (L) | Ambiguity (H-L) | −.256* | .000 | ||
Relevance indexes measure noticing. Table displays mean differences from repeated measures ANOVA and the corresponding p-value obtained from pairwise comparisons with Bonferroni adjustment. Intra-subjects factors are ambiguity, clarity and reliability. Inter-subjects factors are CSI, ambiguity-tolerance (TOLER) and proactivity (PROAC).
95% confidence level.
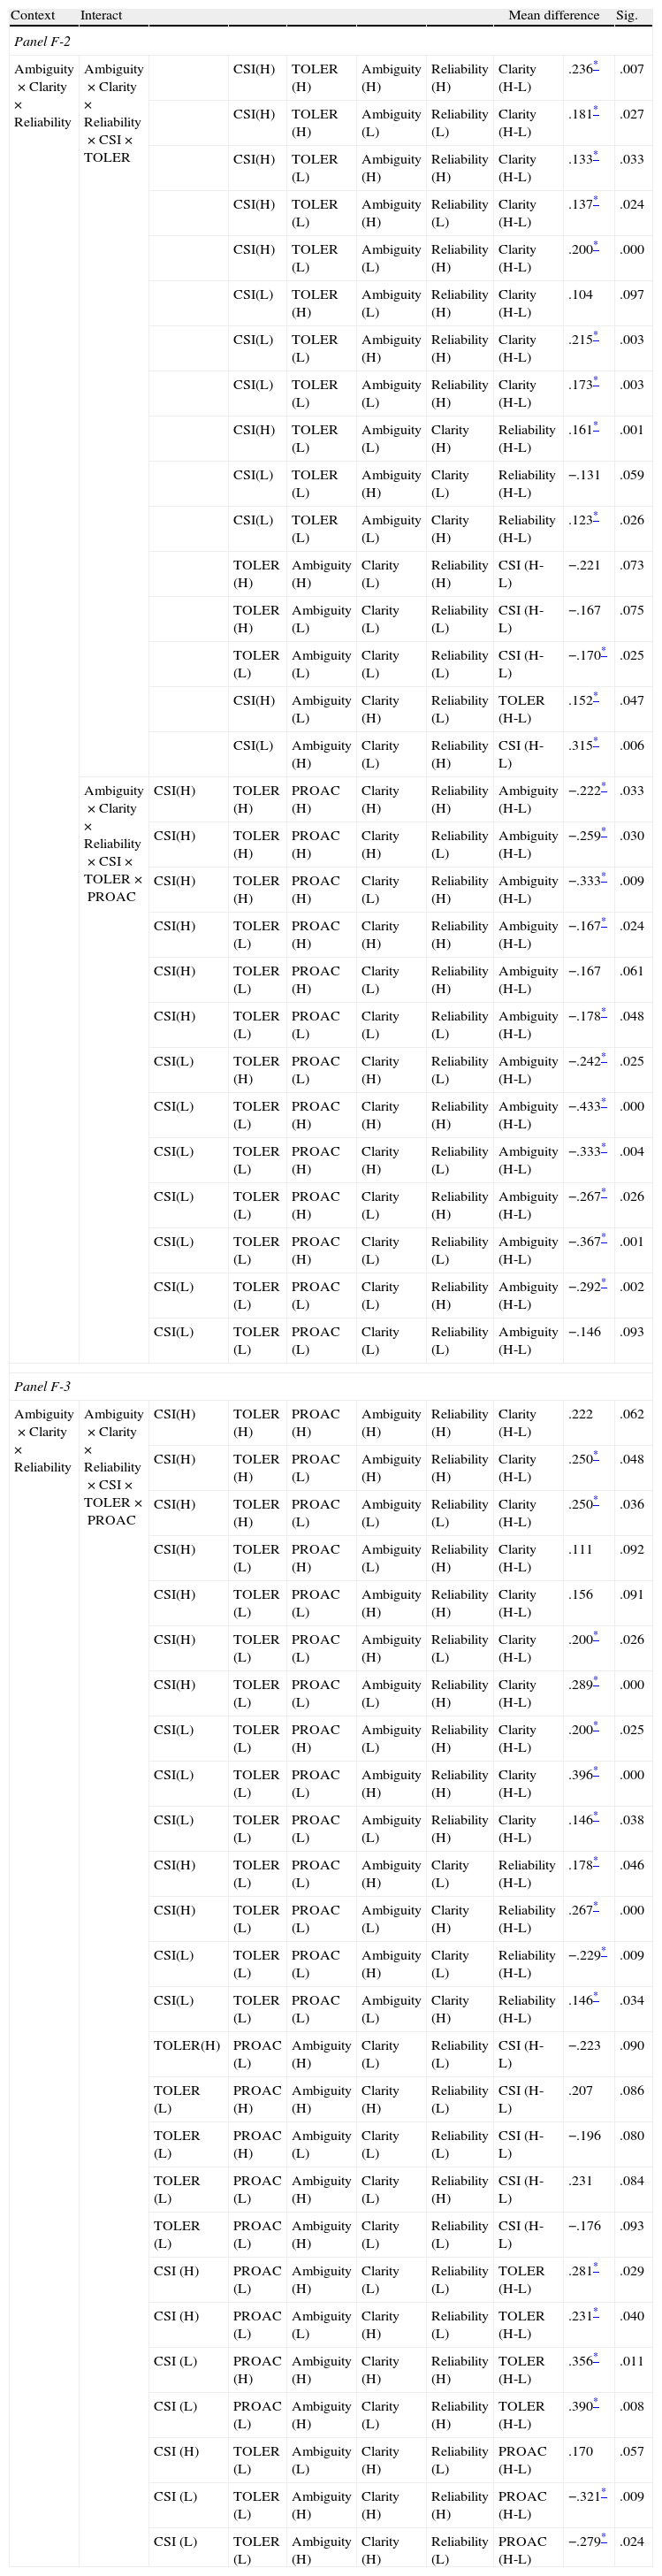
Noticing. Mean differences. Panel F (Ambiguity×Clarity×Reliability).
| Context | Interact | Mean difference | Sig. | ||||||
| Panel F-2 | |||||||||
| Ambiguity×Clarity×Reliability | Ambiguity×Clarity×Reliability×CSI×TOLER | CSI(H) | TOLER (H) | Ambiguity (H) | Reliability (H) | Clarity (H-L) | .236* | .007 | |
| CSI(H) | TOLER (H) | Ambiguity (L) | Reliability (L) | Clarity (H-L) | .181* | .027 | |||
| CSI(H) | TOLER (L) | Ambiguity (H) | Reliability (H) | Clarity (H-L) | .133* | .033 | |||
| CSI(H) | TOLER (L) | Ambiguity (H) | Reliability (L) | Clarity (H-L) | .137* | .024 | |||
| CSI(H) | TOLER (L) | Ambiguity (L) | Reliability (H) | Clarity (H-L) | .200* | .000 | |||
| CSI(L) | TOLER (H) | Ambiguity (L) | Reliability (H) | Clarity (H-L) | .104 | .097 | |||
| CSI(L) | TOLER (L) | Ambiguity (H) | Reliability (H) | Clarity (H-L) | .215* | .003 | |||
| CSI(L) | TOLER (L) | Ambiguity (L) | Reliability (H) | Clarity (H-L) | .173* | .003 | |||
| CSI(H) | TOLER (L) | Ambiguity (L) | Clarity (H) | Reliability (H-L) | .161* | .001 | |||
| CSI(L) | TOLER (L) | Ambiguity (H) | Clarity (L) | Reliability (H-L) | −.131 | .059 | |||
| CSI(L) | TOLER (L) | Ambiguity (L) | Clarity (H) | Reliability (H-L) | .123* | .026 | |||
| TOLER (H) | Ambiguity (H) | Clarity (L) | Reliability (H) | CSI (H-L) | −.221 | .073 | |||
| TOLER (H) | Ambiguity (L) | Clarity (L) | Reliability (L) | CSI (H-L) | −.167 | .075 | |||
| TOLER (L) | Ambiguity (L) | Clarity (L) | Reliability (L) | CSI (H-L) | −.170* | .025 | |||
| CSI(H) | Ambiguity (L) | Clarity (H) | Reliability (L) | TOLER (H-L) | .152* | .047 | |||
| CSI(L) | Ambiguity (H) | Clarity (L) | Reliability (H) | CSI (H-L) | .315* | .006 | |||
| Ambiguity×Clarity×Reliability×CSI×TOLER×PROAC | CSI(H) | TOLER (H) | PROAC (H) | Clarity (H) | Reliability (H) | Ambiguity (H-L) | −.222* | .033 | |
| CSI(H) | TOLER (H) | PROAC (H) | Clarity (H) | Reliability (L) | Ambiguity (H-L) | −.259* | .030 | ||
| CSI(H) | TOLER (H) | PROAC (H) | Clarity (L) | Reliability (H) | Ambiguity (H-L) | −.333* | .009 | ||
| CSI(H) | TOLER (L) | PROAC (H) | Clarity (H) | Reliability (H) | Ambiguity (H-L) | −.167* | .024 | ||
| CSI(H) | TOLER (L) | PROAC (H) | Clarity (L) | Reliability (H) | Ambiguity (H-L) | −.167 | .061 | ||
| CSI(H) | TOLER (L) | PROAC (L) | Clarity (L) | Reliability (L) | Ambiguity (H-L) | −.178* | .048 | ||
| CSI(L) | TOLER (H) | PROAC (L) | Clarity (H) | Reliability (L) | Ambiguity (H-L) | −.242* | .025 | ||
| CSI(L) | TOLER (L) | PROAC (H) | Clarity (H) | Reliability (H) | Ambiguity (H-L) | −.433* | .000 | ||
| CSI(L) | TOLER (L) | PROAC (H) | Clarity (H) | Reliability (L) | Ambiguity (H-L) | −.333* | .004 | ||
| CSI(L) | TOLER (L) | PROAC (H) | Clarity (L) | Reliability (H) | Ambiguity (H-L) | −.267* | .026 | ||
| CSI(L) | TOLER (L) | PROAC (H) | Clarity (L) | Reliability (L) | Ambiguity (H-L) | −.367* | .001 | ||
| CSI(L) | TOLER (L) | PROAC (L) | Clarity (L) | Reliability (H) | Ambiguity (H-L) | −.292* | .002 | ||
| CSI(L) | TOLER (L) | PROAC (L) | Clarity (L) | Reliability (L) | Ambiguity (H-L) | −.146 | .093 | ||
| Panel F-3 | |||||||||
| Ambiguity×Clarity×Reliability | Ambiguity×Clarity×Reliability×CSI×TOLER×PROAC | CSI(H) | TOLER (H) | PROAC (H) | Ambiguity (H) | Reliability (H) | Clarity (H-L) | .222 | .062 |
| CSI(H) | TOLER (H) | PROAC (L) | Ambiguity (H) | Reliability (H) | Clarity (H-L) | .250* | .048 | ||
| CSI(H) | TOLER (H) | PROAC (L) | Ambiguity (L) | Reliability (L) | Clarity (H-L) | .250* | .036 | ||
| CSI(H) | TOLER (L) | PROAC (H) | Ambiguity (L) | Reliability (H) | Clarity (H-L) | .111 | .092 | ||
| CSI(H) | TOLER (L) | PROAC (L) | Ambiguity (H) | Reliability (H) | Clarity (H-L) | .156 | .091 | ||
| CSI(H) | TOLER (L) | PROAC (L) | Ambiguity (H) | Reliability (L) | Clarity (H-L) | .200* | .026 | ||
| CSI(H) | TOLER (L) | PROAC (L) | Ambiguity (L) | Reliability (H) | Clarity (H-L) | .289* | .000 | ||
| CSI(L) | TOLER (L) | PROAC (H) | Ambiguity (L) | Reliability (H) | Clarity (H-L) | .200* | .025 | ||
| CSI(L) | TOLER (L) | PROAC (L) | Ambiguity (H) | Reliability (H) | Clarity (H-L) | .396* | .000 | ||
| CSI(L) | TOLER (L) | PROAC (L) | Ambiguity (L) | Reliability (H) | Clarity (H-L) | .146* | .038 | ||
| CSI(H) | TOLER (L) | PROAC (L) | Ambiguity (H) | Clarity (L) | Reliability (H-L) | .178* | .046 | ||
| CSI(H) | TOLER (L) | PROAC (L) | Ambiguity (L) | Clarity (H) | Reliability (H-L) | .267* | .000 | ||
| CSI(L) | TOLER (L) | PROAC (L) | Ambiguity (H) | Clarity (L) | Reliability (H-L) | −.229* | .009 | ||
| CSI(L) | TOLER (L) | PROAC (L) | Ambiguity (L) | Clarity (H) | Reliability (H-L) | .146* | .034 | ||
| TOLER(H) | PROAC (L) | Ambiguity (H) | Clarity (L) | Reliability (L) | CSI (H-L) | −.223 | .090 | ||
| TOLER (L) | PROAC (H) | Ambiguity (H) | Clarity (H) | Reliability (L) | CSI (H-L) | .207 | .086 | ||
| TOLER (L) | PROAC (H) | Ambiguity (L) | Clarity (L) | Reliability (L) | CSI (H-L) | −.196 | .080 | ||
| TOLER (L) | PROAC (L) | Ambiguity (H) | Clarity (L) | Reliability (H) | CSI (H-L) | .231 | .084 | ||
| TOLER (L) | PROAC (L) | Ambiguity (H) | Clarity (L) | Reliability (L) | CSI (H-L) | −.176 | .093 | ||
| CSI (H) | PROAC (L) | Ambiguity (H) | Clarity (L) | Reliability (L) | TOLER (H-L) | .281* | .029 | ||
| CSI (H) | PROAC (L) | Ambiguity (L) | Clarity (H) | Reliability (L) | TOLER (H-L) | .231* | .040 | ||
| CSI (L) | PROAC (H) | Ambiguity (H) | Clarity (H) | Reliability (H) | TOLER (H-L) | .356* | .011 | ||
| CSI (L) | PROAC (L) | Ambiguity (H) | Clarity (L) | Reliability (H) | TOLER (H-L) | .390* | .008 | ||
| CSI (H) | TOLER (L) | Ambiguity (L) | Clarity (H) | Reliability (L) | PROAC (H-L) | .170 | .057 | ||
| CSI (L) | TOLER (L) | Ambiguity (H) | Clarity (H) | Reliability (H) | PROAC (H-L) | −.321* | .009 | ||
| CSI (L) | TOLER (L) | Ambiguity (H) | Clarity (H) | Reliability (L) | PROAC (H-L) | −.279* | .024 | ||
Relevance indexes measure noticing. Table displays mean differences from repeated measures ANOVA and the corresponding p-value obtained from pairwise comparisons with Bonferroni adjustment. Intra-subjects factors are ambiguity, clarity and reliability. Inter-subjects factors are CSI, ambiguity-tolerance (TOLER) and proactivity (PROAC).
95% confidence level.
Sensemaking. Mean differences. Panel A (Ambiguity), Panel B (Ambiguity×Clarity), Panel C (Ambiguity×Reliability).
| Context | Interaction | Mean difference | Sig. | ||||
| Panel A | |||||||
| Ambiguity | Ambiguity | Ambiguity (H-L) | −.366* | .000 | |||
| Panel B | |||||||
| Ambiguity×Clarity | Ambiguity×Clarity | Clarity (H) | Ambiguity (H-L) | −.409* | .000 | ||
| Clarity (L) | Ambiguity (H-L) | −.324* | .000 | ||||
| Ambiguity (L) | Clarity (H-L) | .078* | .006 | ||||
| Ambiguity×Clarity×CSI×PROAC | CSI (H) | PROAC (H) | Clarity (H) | Ambiguity (H-L) | −.389* | .000 | |
| CSI (H) | PROAC (H) | Clarity (L) | Ambiguity (H-L) | −.413* | .000 | ||
| CSI (H) | PROAC (L) | Clarity (H) | Ambiguity (H-L) | −.469* | .000 | ||
| CSI (H) | PROAC (L) | Clarity (L) | Ambiguity (H-L) | −.295* | .004 | ||
| CSI (L) | PROAC (H) | Clarity (H) | Ambiguity (H-L) | −.417* | .000 | ||
| CSI (L) | PROAC (H) | Clarity (L) | Ambiguity (H-L) | −.260* | .012 | ||
| CSI (L) | PROAC (L) | Clarity (H) | Ambiguity (H-L) | −.360* | .000 | ||
| CSI (L) | PROAC (L) | Clarity (L) | Ambiguity (H-L) | −.329* | .000 | ||
| CSI (L) | PROAC (H) | Ambiguity (L) | Clarity (H-L) | .118* | .045 | ||
| CSI (L) | PROAC (L) | Ambiguity (L) | Clarity (H-L) | .091 | .065 | ||
| PROAC (L) | Ambiguity (H) | Clarity (H) | CSI (H-L) | −.189* | .020 | ||
| Panel C | |||||||
| Ambiguity×Reliability | Ambiguity×Reliability×TOLER | TOLER (H) | Reliability (H) | Ambiguity (H-L) | −.319* | .000 | |
| TOLER (H) | Reliability (L) | Ambiguity (H-L) | −.350* | .000 | |||
| TOLER (L) | Reliability (H) | Ambiguity (H-L) | −.476* | .000 | |||
| TOLER (L) | Reliability (L) | Ambiguity (H-L) | −.320* | .000 | |||
| TOLER (L) | Ambiguity (H) | Reliability (H-L) | −.091 | .064 | |||
| Ambiguity (L) | Reliability (H) | TOLER (H-L) | −.120* | .035 | |||
The coherent relevance index measures sense making. Table displays mean differences from repeated measures ANOVA and the corresponding p-value obtained from pairwise comparisons with Bonferroni adjustment. Intra-subjects factors are ambiguity, clarity and reliability. Inter-subjects factors are CSI, ambiguity-tolerance (TOLER) and proactivity (PROAC).
95% confidence level.
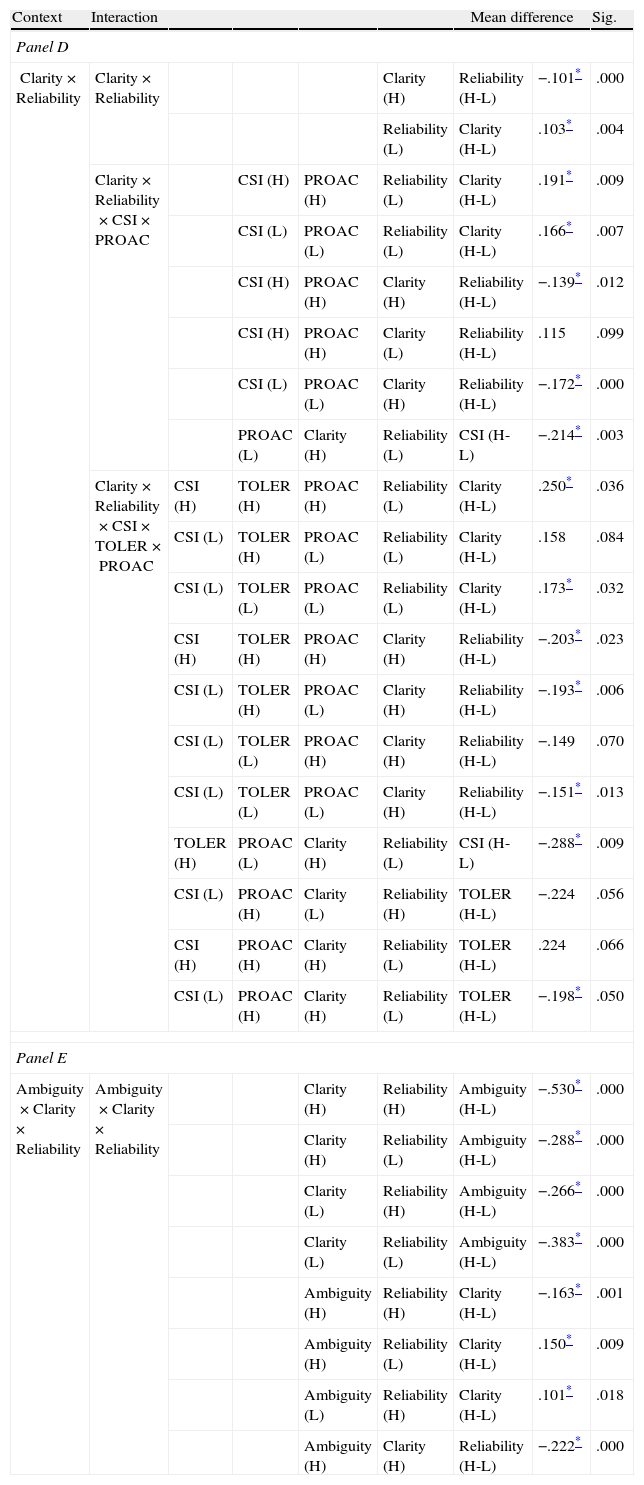
Sensemaking. Mean differences. Panel D (Clarity×Reliability), Panel E (Ambiguity×Clarity×Reliability).
| Context | Interaction | Mean difference | Sig. | |||||
| Panel D | ||||||||
| Clarity×Reliability | Clarity×Reliability | Clarity (H) | Reliability (H-L) | −.101* | .000 | |||
| Reliability (L) | Clarity (H-L) | .103* | .004 | |||||
| Clarity×Reliability×CSI×PROAC | CSI (H) | PROAC (H) | Reliability (L) | Clarity (H-L) | .191* | .009 | ||
| CSI (L) | PROAC (L) | Reliability (L) | Clarity (H-L) | .166* | .007 | |||
| CSI (H) | PROAC (H) | Clarity (H) | Reliability (H-L) | −.139* | .012 | |||
| CSI (H) | PROAC (H) | Clarity (L) | Reliability (H-L) | .115 | .099 | |||
| CSI (L) | PROAC (L) | Clarity (H) | Reliability (H-L) | −.172* | .000 | |||
| PROAC (L) | Clarity (H) | Reliability (L) | CSI (H-L) | −.214* | .003 | |||
| Clarity×Reliability×CSI×TOLER×PROAC | CSI (H) | TOLER (H) | PROAC (H) | Reliability (L) | Clarity (H-L) | .250* | .036 | |
| CSI (L) | TOLER (H) | PROAC (L) | Reliability (L) | Clarity (H-L) | .158 | .084 | ||
| CSI (L) | TOLER (L) | PROAC (L) | Reliability (L) | Clarity (H-L) | .173* | .032 | ||
| CSI (H) | TOLER (H) | PROAC (H) | Clarity (H) | Reliability (H-L) | −.203* | .023 | ||
| CSI (L) | TOLER (H) | PROAC (L) | Clarity (H) | Reliability (H-L) | −.193* | .006 | ||
| CSI (L) | TOLER (L) | PROAC (H) | Clarity (H) | Reliability (H-L) | −.149 | .070 | ||
| CSI (L) | TOLER (L) | PROAC (L) | Clarity (H) | Reliability (H-L) | −.151* | .013 | ||
| TOLER (H) | PROAC (L) | Clarity (H) | Reliability (L) | CSI (H-L) | −.288* | .009 | ||
| CSI (L) | PROAC (H) | Clarity (L) | Reliability (H) | TOLER (H-L) | −.224 | .056 | ||
| CSI (H) | PROAC (H) | Clarity (H) | Reliability (L) | TOLER (H-L) | .224 | .066 | ||
| CSI (L) | PROAC (H) | Clarity (H) | Reliability (L) | TOLER (H-L) | −.198* | .050 | ||
| Panel E | ||||||||
| Ambiguity×Clarity×Reliability | Ambiguity×Clarity×Reliability | Clarity (H) | Reliability (H) | Ambiguity (H-L) | −.530* | .000 | ||
| Clarity (H) | Reliability (L) | Ambiguity (H-L) | −.288* | .000 | ||||
| Clarity (L) | Reliability (H) | Ambiguity (H-L) | −.266* | .000 | ||||
| Clarity (L) | Reliability (L) | Ambiguity (H-L) | −.383* | .000 | ||||
| Ambiguity (H) | Reliability (H) | Clarity (H-L) | −.163* | .001 | ||||
| Ambiguity (H) | Reliability (L) | Clarity (H-L) | .150* | .009 | ||||
| Ambiguity (L) | Reliability (H) | Clarity (H-L) | .101* | .018 | ||||
| Ambiguity (H) | Clarity (H) | Reliability (H-L) | −.222* | .000 | ||||
The coherent relevance index measures sense making. Table displays mean differences from repeated measures ANOVA and the corresponding p-value obtained from pairwise comparisons with Bonferroni adjustment. Intra-subjects factors are ambiguity, clarity and reliability. Inter-subjects factors are CSI, ambiguity-tolerance (TOLER) and proactivity (PROAC).
95% confidence level.
The first hypothesis states that there are differences among the driving factors of noticing and the ones of sense making. A comparison of Tables 6 and 7 reveals that noticing and sense making only have two relevant key factors in common. Thus, ambiguity and the interaction of information clarity and reliability of the source are the two factors that have an impact on both stages of our decision-making model. On the other hand, our results disclose differences among the interactions of context factors and individual traits affecting noticing and the ones relevant for sense making.
In the noticing stage, information clarity and the individuals’ tolerance to ambiguity always have a positive impact on noticing. On the other hand, ambiguity reduces noticing in all the cases. However, the reliability of the source of information, the cognitive style and proactivity do not have a unique influence on this stage; sometimes they reduce noticing and other times they have a positive effect on it. In the majority of the cases, the influence of the source reliability on noticing is positive, but Table 8.4-Panels F-2 and F.3 shows that when intuitive and low ambiguity–tolerant individuals face unclear information in very ambiguous situations, they notice the stimuli with unreliable sources more frequently than with reliable ones. The significant effect of intuition on noticing is almost always positive. Nevertheless, Table 8.1-Panel A and Table 8.4-Panel F-2 show three significant cases where analytic individuals notice the stimuli more often than intuitive individuals. In these cases analytic individuals are also low ambiguity-tolerant and face unclear information in ambiguous situations from reliable sources. Finally, the significant influences of individuals’ proactivity on noticing are mainly negative and this always happens in high ambiguity scenarios. However, the two cases when proactivity favors noticing are characterized by low ambiguity (Table 8.1-Panel C and Table 8.2-Panel E).
In the sensemaking stage of the perception process, our results reveal that in all the significant interactions where ambiguity intervenes, it reduces the frequency of positive interpretation of the stimuli noticed. On the other hand, intuition always encourages this positive interpretation. However, we do not find significant differences between more and less proactive individuals in sensemaking. Tables 9.1 and 9.2 also display that clarity of the information, reliability of the source, and ambiguity-tolerance sometimes reduce the positive interpretation of stimuli and sometimes not. In the majority of the relevant interactions, clarity of the information favors the positive interpretation of the stimuli. Thus, unclear information only increases the positive interpretation of the information in those relevant interactions where reliable sources disseminate information on very ambiguous situations (Table 9.2-Panel E). On the other hand, the reliability of the source reduces the positive interpretation of the information in those significant interactions with clear information. Results only show one significant interaction where reliability of the source favors positive interpretations and it is characterized by unclear information. Finally, Table 9.1-Panel C and Table 9.2-Panel D show four significant interactions where ambiguity-tolerance explains the differences in individuals’ sense making. Three of them show that low ambiguity-tolerant individuals interpret the information positively more frequently than those individuals with a high tolerance to ambiguity. There is only one significant interaction where tolerance to ambiguity favors the positive interpretation of the information: when intuitive and proactive individuals face clear information from unreliable sources (Table 9.2-Panel D).
Therefore, we find empirical evidence that the distinction between noticing and sense making is significant to investors’ information processing. Our results empirically support Hypothesis 1.
Our second hypothesis is about how ambiguity negatively affects the noticing and sensemaking stages. Tables 6 and 7 show that the two levels of ambiguity considered in the experiment are significant for noticing and sense making, respectively. Whether considering ambiguity on its own or considering its interactions with other context or personality factors, ambiguity always has a negative impact on noticing and sense making (Tables 8.1–8.4 and 9.1–9.2, respectively). Therefore, our results support Hypothesis 2.
The third hypothesis states that the individual's cognitive profile moderates the influence of ambiguity on noticing and sense making. Table 6 shows that ambiguity has significant interactions for noticing with proactivity, with cognitive style and tolerance to ambiguity, and finally, with the three variables of the cognitive profile considered.
We have not found empirical evidence of significant interactions between ambiguity and cognitive profile in sensemaking, which constitutes a major difference in the driving factors of the two stages. Therefore, our results partially support the third hypothesis.
Hypothesis four posits that information clarity has a positive impact on noticing. Table 6 shows that significant differences are found in noticing when comparing scenarios with clear versus unclear information. Information clarity affects investors’ noticing positively (Table 8.1-Panel B). Results show this positive impact on noticing in both cases: when we consider clarity alone and when we analyze all its significant interactions with other context and personality variables (Table 8.1-Panel C, Table 8.2-Panel E, Tables 8.3 and 8.4). Hence, our results support Hypothesis 4.
Information clarity does not affect sense making unless we consider its interaction with other context variables. Although in the majority of the cases, information clarity favors the positive interpretation of the stimulus (Table 9.1-Panel B and Table 9.2), sometimes clarity reduces this interpretation. This happens in the significant pairwise comparison with unreliable source and high ambiguity (Table 9.2-Panel E). This constitutes another relevant difference between the noticing and sense making stages.
The fifth hypothesis tests whether the interaction among the individuals’ cognitive profile, ambiguity and information clarity has an impact on noticing and sense making. The interaction of ambiguity and information clarity is significant for individuals’ noticing depending on their ambiguity- tolerance and proactivity (Table 6). Unlike the noticing stage, in Table 7 we see that the interaction of ambiguity and information clarity is significant for sense making even without considering individuals’ cognitive profile. Ambiguity and clarity also interact with cognitive style and proactivity in sense making (Table 7). Hence, we find empirical support for H5.
Our last hypothesis maintains that the reliability of the source of information only has an effect on noticing and sense making when it interacts with other context variables and the cognitive profile affects this influence. Our results show that the reliability of the source only has an effect on noticing and sense making when it interacts with at least one of the other two context variables considered (Tables 6 and 7). The cognitive profile always affects this interaction in noticing, but in the case of sense making stage, the interaction of the three context variables is relevant without considering the individuals’ cognitive profile. Thus, our results provide empirical support for Hypothesis 6.
6ConclusionsOur paper develops a decision-making model to explain how investor perception affects the dynamics of financial markets. On the basis of Starbuck and Milliken (1988), our perception model includes two stages – noticing, and sense making. Financial decisions are compelled and constrained by non-financial factors. These include context factors as well as personality characteristics of individuals. We focus on the driving factors of investors’ perception and provide empirical evidence of the interaction among environmental factors and individual traits on this process. The context variables are ambiguity, clarity of the informative stimulus, and reliability of the source of information; the personality characteristics are defined by cognitive style, ambiguity-tolerance, and proactivity. The model considerations are tested empirically in an experiment where individuals are provided with information on the possibility of a forthcoming takeover bid. The experiment allows us to observe individual behavior in the different stages of our model under different contextual conditions.
We observe that different factors affect noticing and sense making. Therefore, it is relevant to analyze separately these two stages of perception when studying investors’ information processing.
Without considering any other context variables, ambiguity always has a negative impact on the two stages of perception. However, we find that the cognitive profile moderates this influence in noticing but not in sense making. Thus, highly ambiguity-tolerant individuals and proactive individuals notice more in high ambiguity contexts whereas intuitive and low ambiguity-tolerant individuals notice less in high ambiguity contexts. When we consider other context variables and their significant interactions with individuals’ cognitive profile, ambiguity reduces both noticing and the positive interpretation of information.
The second most important context variable in noticing is information clarity, since it explains differences in noticing without considering any other variables. However, there is a major difference between the two stages of perception; if we only allow for information clarity, no significant differences emerge on sense making.
The reliability of the source of information only has an effect on noticing and sensemaking when it interacts with other context variables and the cognitive profile affects this influence. Reliability almost always improves sense making; however, it tends to reduce the frequency of positive interpretation of the stimuli noticed.
The most relevant cognitive variable in sense making is intuition. When it affects sense making, intuitive individuals interpret the information positively more frequently than analytic individuals. This personality trait almost always improves noticing. On the other hand, the key personality variable in noticing is ambiguity-tolerance, which always has a positive impact on it. However, tolerance to ambiguity has a limited impact on sense making as it tends to reduce the frequency of positive interpretations.
The results obtained strongly support the idea that context variables, such as ambiguity and the clarity of the informative stimulus, and personality traits, such as cognitive style and ambiguity-tolerance, do have an effect on the perception of stimuli. With all this, the results of this research mark the direction of future research how context variables and individual traits influence the final stage on financial markets: investors’ decision making.
The authors are from the Department of Financial Economics and Accounting, University of Valladolid. They especially thank the participants in the Behavioral Finance Working Group workshops for many useful suggestions and benefit from the useful comments of William Forbes, Valle Santos, Arman Eshraghi, Mark Fenton-O’Creevy, and John Holland. They also thank Catherine Ramberg for editorial assistance. Financial support from DGIGPN (SEJ2007-67382) is also acknowledged. Any errors are the responsibility of the authors.

