


The growth in the interest rates paid on Spanish public debt since 2008 and the impairment of the interbank market have generated concerns about their effects on competition for bank deposits in Spain. I combine a nested logit model of bank deposit supply with a structural model of competition to measure the impact of the reference interest rates on public debt and interbank markets on the returns on deposits and funding policy of Spanish banks during 2003–2010. The interbank rate is found to be more closely correlated with the return on deposits than the interest rate on public debt, but the connection between interbank rates and deposit returns is significantly weaker in the crisis period 2008–2010. Counterfactual analysis shows an important effect of the interbank rate and investment opportunities in public debt on deposit rates and bank profits, and that observed deposit rates are on average 115bp above collusive levels.
Empirical research has shown in the past that the interbank rate worked as a reference for the interest rates of loan and deposit products offered by Spanish banks. In particular, the remuneration of bank deposits has been historically set equal to the interbank rate minus a margin discount. However, the interest cost of term deposits has been generally above the interbank rate since 2008. This observation is surprising if we use as framework of analysis a standard model of banking competition, where banks have some degree of market power in the loan and deposit markets and have access to an interbank market with a perfectly elastic supply of funds.1 In such a framework, it is not possible to observe a market equilibrium with an interest rate on bank deposits above the interbank rate, as banks would then have the incentive and the ability to substitute deposits for interbank funding. The addition to the standard model of disruptions in the interbank market and bank investments in public debt can help to solve this puzzle and explain the observed deposit rates in recent history. In this article, I estimate a structural model of the Spanish bank deposit market to examine its relation with interbank and public debt markets and the intensity of competition.
The operation of the European interbank market has been disrupted following the financial crisis of 2008. The reduced volumes of transactions, raising spreads and the recourse to European Central Bank, ECB henceforth, liquidity operations have signaled the difficulties of borrowers to access the interbank market, ECB (2008, 2010). For the particular case of Spain, the negative difference of the interbank rate and deposit rates since 2008 implied also that it would be unprofitable for Spanish banks to use deposit funding to participate as lenders in the interbank market. Even with limited participation of Spanish banks in the interbank market, a significant fraction of Spanish loans are still referenced to the Euribor interbank rate.2 The referencing of loans to interbank rates implies that this market can still impact the expected return on bank loans after 2008, and therefore the incentives of Spanish banks to set deposit rates and obtain funds to finance these loans. The relation between the interbank rate and bank deposits is nonetheless expected to change depending on whether normal access to the interbank market is available, or interbank rates impact the banks only through the referencing of loan rates.
The funds obtained from bank deposits can also be invested in public debt. The growth in the rates paid on Spanish public debt since 2008 increases the interest margin of these securities relative to the interest cost of bank deposits. Public debt assets bring an additional option value originating from its possible future use to obtain liquidity in the repo market or with the ECB.3 Spanish public debt was an investment option for Spanish banks before the financial crisis, and this already created a connection between the markets for public debt and bank deposits. However, the high interest rates on public debt and its heightened importance as a liquidity instrument after 2008 plausibly altered its relation with the bank deposit market.
This article uses regulatory data at the individual bank level on the deposit volume and interest rates of bank deposits in Spain during the period 2003–2010 to estimate the deposit supply function. The estimates of the deposit supply model are combined with a structural Nash pricing model of competition in the deposit market to infer the expected returns on deposit funds. These implied returns on deposits are calculated from the profit-maximization conditions of the formal competition model evaluated at the observed deposit rates. I then study the statistical relation of implied returns with the interest rates on the interbank and public debt markets. Counterfactual exercises are used to compute the sensitivity of deposit rates and bank profits to the interbank rate, interest rates on public debt and the intensity of competition.
I use a nested logit specification for the supply of bank deposits, which allows me to control for the possible endogeneity of deposit rates, through instrumental variables estimation, and recover different substitution patterns across commercial and savings banks. The existing empirical industrial organization literature, as reviewed below, has shown the importance of this class of discrete choice methods to accurately estimate price elasticities, which are a key input to the counterfactual exercises and the recovery of implicit returns. I find an elasticity of individual bank deposit supply with respect to its own deposit rate of 0.93 and that the correction for endogeneity bias is relevant. The analysis of the relation of deposit returns and reference interest rates reveals that the Euribor 12 months is clearly correlated with the implied return on deposits through the sample, though this relation is weaker after 2008. The interest rates on public debt are found to have a greater impact on the return on deposits after 2008. These findings offer some support for the concern that the exposure of Spanish banks to interbank and public debt markets changed during the financial crisis.
The counterfactual analysis in this article reveals that collusion in the deposit market can increase bank profits, but the variations of the reference rates in the interbank and public debt markets are found to have a larger impact on bank profits than the relaxation of competition.4 These results point to reference interest rates with impact on bank deposit returns as more relevant indicators of financial stability than measures of concentration in the Spanish bank deposit market.
The banking literature has long been concerned with the effects of competition on deposit rates. Berger and Hannan (1989) estimate the impact of concentration on deposit rates in the U.S. within a structure conduct performance framework, Hannan and Berger (1991) study the impact of market concentration and bank characteristics on bank level deposit rate decisions and Amel and Hannan (1999) estimate the deposit rate elasticity of bank deposits to measure the possibilities of substitution to nonbank financial institutions. Hannan and Berger (1991) consider the impact of changes in the average return of the securities market on deposit rates, but their objectives and data are not oriented to study the impact of the reference rates of different markets on deposit rates.
The developments in the empirical industrial organization literature, in particular, the extension of the use of discrete choice models and structural assumptions following Berry et al. (1995), BLP henceforth, provide new tools to examine the behavior and welfare of depositors and they have been applied to the study of the U.S. bank deposit markets in a series of recent articles. Adams et al. (2007) fit a generalized extreme value model to the market share data of deposit institutions in the U.S. to estimate the cross elasticities between the interest rates offered by commercial banks and thrifts. Dick (2008) uses different multinomial logit models to estimate the relation between the deposit supply in the U.S. and deposit rates, service fees and branch network density. Dick (2008) uses this deposit supply model to measure the consequences in welfare of the merger process initiated after the Riegel-Neal Act of 1994. Knittel and Stango (2008) also employ a logistic model to estimate the deposit supply in the U.S. as a function of deposit rates and ATM network characteristics.5
Ishii (2008) estimates the supply of deposits in the U.S. with a mixed logit model with the purpose of evaluating the impact on consumer welfare of ATM fees charged to consumers belonging to different networks and obtaining an estimate of the investment costs of expansion of ATM networks. Ho and Ishii (2011) improve the estimation technique in Ishii (2008) incorporating an outside option to bank deposits and detailed geographic data to obtain a more precise estimate of the welfare impact of the geographic expansion of banks as result of the Riegel-Neal Act. The financial crisis started on 2008 has increased the interest in the analysis of the relation between sovereign debt and the banking sector,6 and the current article contributes to this literature with new structural analysis of the effects of tensions in the public debt market and impairment of the interbank market on the competition for bank deposits.
The deposit and loan markets in Spain have been the objects of different empirical studies. Carbó et al. (2005) estimate a linear demand model for loans and deposits and they use it to infer the strategic reaction of commercial and savings banks to changes in the interest rates and advertising policies of competitors. Martín-Oliver and Salas-Fumás (2008) estimate a production function and a logit demand model for loans and deposits, which allow them to identify the contribution of information technology to the production process, measure the impact of advertising on demand and verify the strategic rationality of interest rate and advertising policies. Martín-Oliver et al. (2007) study the dispersion in the deposit and loan rates in the Spanish banking sector and they find evidence of imperfect long term convergence of interest rates to marginal costs. Martín-Oliver (2010) studies also the evolution of competition in the banking sector in the period 1988–2003 and he finds an increase in market power in the loan sector, decrease in market power in the deposit sector and greater use of advertising and information technologies in the later years of the sample. Jiménez et al. (2013) find some evidence of a negative relation between concentration and credit risk in the Spanish banking sector.
The rest of the article is organized as follows. Section 2 describes the data set. Section 3 introduces the empirical methodology and a simple theoretical model that motivates the analysis. Section 4 presents the results of deposit supply estimation and the analysis of the relation between the implied return on bank deposits and reference interest rates. Section 5 completes the counterfactual exercises and Section 6 concludes.
2Data and descriptive analysis2.1Data setThe data on interest rates and volume of new deposits of Spanish commercial and savings banks is obtained from the interest rate information reported monthly by deposit institutions to the Bank of Spain.7 This information is required by default to deposit institutions with an asset size of at least 1.5 billion euros and a domestic deposit stock of at least 500 million euros, and it can also be requested to smaller institutions, covering a representative part of the financial system. These data correspond to new operations within the month and provide deposit rates actually applied within the month at the individual institution level rather than average financial interest revenues. I calculate the average deposit rates for households and non-financial firms with a weighted average by volume of deposits with terms above and below the year for each class of depositor. The data on the Euribor 12 months – the interbank reference rate for Spanish deposit institutions – and the interest rates of Spanish public debt are obtained from the statistical bulletin of the Bank of Spain.
I collect institution level information on the number of employees, number of branches, labor costs and the commissions and fees associated to payment services (debit and credit cards, wire transfers, checks, etc.) from income statement data filed by deposit institutions to the Bank of Spain. I also make use of the data on the total stock of deposits of households and non-financial firms from the monthly reports of deposit balances collected by the Bank of Spain. I calculate the average payment services rate charged to customers with the ratio of payment service fees and the stocks of household and non financial firm deposits. I use the total stock of household deposits in the financial system, which includes the stock of deposits held by credit cooperatives and foreign branches, as a measure of the total size of the market for household deposits. As a complementary measure of market size, I also use data on the asset balances of households in the Financial Accounts of the Spanish Economy published by the Bank of Spain.
2.2Evolution of interest rates in the period 2003–2010The deposits in commercial and savings banks can be classified according to the type of depositor (households and non financial firms, NFFs henceforth) and the term of the deposit (term up to and above one year). For each of these contract categories, the left panel of Fig. 1 plots the cross sectional average of interest rates on new deposits. The remuneration of deposits increased significantly from January 2006 to December 2008, with an approximate rise of 300bp, but this increase was reverted during 2009. The deposit rates on different contract categories are highly correlated and there are no significant differences between the evolution of the deposit rates across depositors and maturities. For example, the coefficient of correlation is 0.96 for the interest rate on deposits of households with a term of up to one year and the interest rate on deposits of households with a term above one year. The coefficient of correlation is 0.99 for the interest rates on deposits of households and NFFs with a term of up to one year. Given the parallel evolution of different deposit rates and the focus of the literature on household deposits, I use the household deposit rates and volumes for the remaining of the article.

The right panel of Fig. 1 shows the average deposit rate on new deposits from households with a term of up to one year, the Euribor 12 months and the interest rates of Spanish public debt for different maturities (one year, 5 and 10 years). The deposit rate stays below the Euribor 12 months until November 2008 and above this reference rate after this date, e.g., the positive difference with respect to the Euribor 12 months approaches 100bp in May 2010. The interest rate of Treasury Bills with one year term stays below the level of the Euribor 12 months and the interest rate on new deposits from households with term up to one year since the end of 2007 to mid-2010. The Treasury Bills do not represent thus an attractive investment in this period for commercial and savings banks if it is financed with bank deposits. Since April 2010, the interest rate of Treasury Bills with one year term is higher than the Euribor 12 months and it even grows over the level of the average deposit rate in December 2010. However, it is not possible to use this specific event to conclude that Treasury Bills tensioned significantly the financing costs of commercial and savings banks during the sample period. On the contrary, funding with bank deposits the purchase of bonds of Spanish government debt with terms of 5 and 10 years is a profitable investment strategy except during the peak of deposit remuneration in 2008. For example, the average interest rate since January 2009 on new deposits from households with one year term is 2.4% whereas the average interest rates on Spanish government bonds with 5 and 10 year maturities are respectively 3.3% and 4.3%.
The deterioration of the margins of deposits with respect to the Euribor 12 months and the one year Treasury Bills does not affect all the banks equally. Since 2009, I observe an increase in the volatility of margins in the cross section of banks. Fig. 2 presents the evolution of the standard deviation of the relative margins of deposits of households with respect to the Euribor 12 months, the one year Treasury Bill and the 5 and 10 year bond. The four-fold increase in the volatility of the relative margin with respect to the Euribor 12 months during the period posterior to 2008 reveals significant variation in the offered deposit rates in the cross section of banks during the latter sample years.8 The two panels in Fig. 2 do not show significant differences in the volatility as function of the term of deposits.
, where rA and rDEP correspond respectively with the interest rates on assets and on bank deposits. The left (right) panel depicts the standard deviation of margins from bank deposits of households with term up to 1 year (with term above 1 year).")
Standard deviation of deposit margins. Note: The relative margin of bank deposits and the asset A, e.g., an interbank loan or a one year Treasury Bill, can be calculated as (rA−rDEP/rA), where rA and rDEP correspond respectively with the interest rates on assets and on bank deposits. The left (right) panel depicts the standard deviation of margins from bank deposits of households with term up to 1 year (with term above 1 year).
The data described in Section 2 reveal changes in the aggregate conditions in the Spanish bank deposit market over the sample period, but it is not possible to conclude without a more formal analysis either that relations between the different interest rate variables are statistically significant or that deposit rates contracted in different periods represent a prudent business strategy for banks. This section introduces a simple model of deposit supply and bank behavior to infer from the volume and interest rate of deposit contracts the implicit expected returns on deposit funding. Once this implicit return is recovered, it is possible to study its relation with the reference rates in the interbank and public debt markets. This procedure applies the techniques employed to extract implicit marginal costs, e.g., Berry et al. (1995), to the recovery of the implicit return on deposit funds.
3.1Theoretical considerationsIn this section, I use a simple model of bank behavior to illustrate how limited access to the interbank market changes the expected return on deposits and, as a consequence, the incentives of the bank to increase this form of financing.
A profit maximizing bank i sets deposit and loan rates ri(d) and ri(l) to collect deposit funds Di and grant total loans Li. In addition, the bank i can take a net position Ii in the interbank market at an interest rate REuribor and a net position Mi in the public debt market through an interest rate bid ri(m).9 The demand for loans Li, public debt Mi and the supply of deposits Di are continuously differentiable functions of, respectively, ri(l), ri(m) and ri(d). Other arguments of these functions include interest rates set by rivals, r−i(l), r−i(m) and r−i(d), market and macroeconomic conditions, X(l), X(m) and X(d), and parameters, βD, βL and βM. The deposit, loan and public debt functions are then:
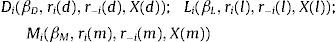
The first derivatives of these functions with respect to own interest rates have signs defined by:

The profit maximization problem of the bank is given by:
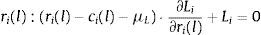
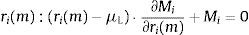
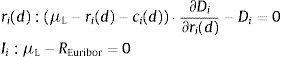
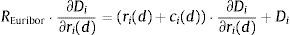
where the constraint is included to capture the need to finance new asset acquisitions with deposits and borrowing in the interbank market.10 The terms ci(l) and ci(d) represent the operating costs of granting new loans and accepting new deposits. Under reasonable specifications of the asset demand and deposit supply functions, the bank has no incentive to raise costly funds and not to invest them in assets so the constraint in (1) will hold with equality. The first order conditions for an interior solution are then:where μL is the Lagrange multiplier corresponding to the funding constraint in (1). It is possible to substitute μL=REuribor in the first order condition (4) for deposit rate ri(d) to find that the marginal deposit funding cost equals the marginal cost of financing an increase of deposits ∂Di/∂ri(d) at the interbank rate REuribor.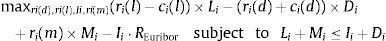
The profit maximization problem of a bank with no access to the interbank market is formulated as:

The absence of a first order condition for the interbank market implies that is not possible to cleanly identify the Lagrangean multiplier as μL=REuribor. The identification of the equilibrium value of μL will require the joint solution of the system of first order conditions (2)–(4) together with the constraint Li+Mi=Di. The solution for μL will depend on the particular specification of functions Li, Di and Mi, and cost components ci(l) and ci(d). Eq. (4) can then be rearranged to obtain:
where X[X(l), X(m), X(d)], ci[ci(l), ci(d)] and β[βD, βL, βM] collect exogenous variables, cost terms and parameters. It is important to note that the interbank rate REuribor will not enter Eq. (7) unless it forms part of the exogenous variables X. For example, Spanish mortgages are commonly indexed to the Euribor 12 months so it would be reasonable to assume when studying Spanish banks that REuribor belongs to X(l). Even if REuribor belongs to X, the relation between the interbank rate and the marginal cost of deposits will differ from the unrestricted case in Eq. (5) as X will typically enter the solution for μL(·) nonlinearly. For example, consider the program in (6) for a simple specification with ci(l)=ci(d)=0 and Li=a−ri(l), Mi=b−ri(m) and Di=c+ri(d) where a=a1+a2·REuribor+a3·(REuribor)2 and b and c are constants. The solution of this program yields an equilibrium value of the Lagrange multiplier μL=(a+b−c)/3. If bank i instead had unrestricted access to the interbank market, μL=REuribor.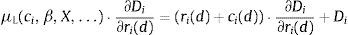
A general form of the optimal deposit rate rules in (5) and (7) is given by:
where the right hand side of (8) is the marginal interest rate cost of deposits and Ri is the expected equilibrium return on an increase in deposit funding of ∂Di/∂ri(d). For the model above with access to the interbank market, the equilibrium return Ri would be defined by Ri=REuribor−ci(d). For the model with restricted access to the interbank market, the equilibrium return is Ri=μL(ci, β, X,…)−ci(d), where the Lagrange multiplier μL(·) will typically be a nonlinear function of exogenous variables and parameters.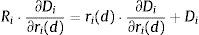
The stylized models above are used to illustrate how the equilibrium cost of deposits depends on the participation in the interbank and public debt markets. However, I do not have ex ante knowledge of whether the models in (1) and (6) are a good description of the behavior of Spanish banks in the period 2008–2010 and I do not apply these models to the data. I rather use the condition in (8), which applies under the mild assumption of bank profit maximization, to infer indirectly Ri from the marginal interest rate cost of deposits in the right hand side of (8). The return Ri can then be projected on REuribor and the interest rates of public debt to test empirically whether the reference rate of a particular asset market, e.g., the interbank market, is correlated with the return Ri implied by the marginal deposit cost in Eq. (8). I detail this procedure in the next subsection.
3.2Empirical implementationThe expected return on the deposit funds of bank i in the period t, Rit, will depend on the exposure to different asset classes (private loan portfolio, public debt, interbank loans, etc.) resulting from the investment strategy of the bank i and market access restrictions, the returns on each of these asset classes and its cost structure. Grouping the individual fixed effect of each deposit institution in αi,o and the variable effect of institution specific factors in ¿it, it is possible to formulate a model of the implicit expected return Rit:
where {αt,Euribor, αt,Bill, αt,Bond5, αt,Bond10} and {Rt,Euribor, Rt,Bill, Rt,Bond5, Rt,Bond10} respectively denote the bank loadings and interest rate levels for the Euribor 12 months, the one year Treasury Bill, and the 5 and 10 year Spanish government bonds. Eq. (9) can be interpreted as a first order linear approximation to the equilibrium return Rit in Eq. (8) for the condition on the marginal deposit costs of a profit maximizing bank.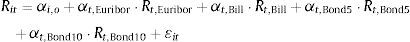
The implicit return Rit is not directly observable, but it can be recovered through the fact that the interest rate rit of the deposits of a bank with an optimal investment strategy yielding Rit will satisfy the optimal deposit rate rule in (8) to maximize the profits from deposit funds. In order to complete this task, it is necessary to specify a deposit supply function. I define Dit(β, rit, xit, ξit, r−it, x−it, ξ−it) as the supply of deposits to bank i in period t, which is a continuously differentiable function of the parameters β, the deposit rate offered by the bank i, rit, exogenous bank characteristics xit (number of branches, brand value, etc.) and an unobserved supply factor ξit, in addition to the interest rates, characteristics and unobserved supply factors associated to competitors (r−it, x−it, ξ−it). The first order condition (8) can be used to express Rit as a function of the rest of variables of the problem:
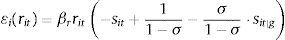
where I have omitted some arguments of the supply function for brevity. The estimates of Rit obtained from (10) can be used as dependent variable in the model of expected returns considered in (9). I estimate a nested logit specification of deposit supply with the purpose of applying Eq. (10) to the data. For this specification, the utility of a depositor j that places her savings in bank i in period t is defined by:where δit represents the mean utility of holding deposits at bank i. This mean utility is a function of both observed characteristics and the unobserved supply factor ξit:


The terms ζjtg and ¿ijt are two independent random variables with the extreme Type-I distribution and σ∈[0,1). The variable ζjtg represents a common shock to the utility for depositor j of deposits in all the banks belonging to a group g, whereas the individual shock ¿ijt represents the idiosyncratic utility of holding deposits at bank i for depositor j. The deposit supply function implied by this distributional assumption is11:
where s indexes the banks belonging to a group g and Mt represents the total available funds that can be supplied as deposits in period t. The effective supply of bank i in (12) is decomposed into the product of market size Mt and the probability that a representative depositor chooses bank i given by the exponential term in (12). If σ=0, the change in the interest rate of a bank i has the same effect on the market shares of all other banks irrespective of the group to which they belong (basic logit model). For σ>0, depositors that choose a bank i in a group g are more likely to switch to banks inside the same group in response to interest rate changes. In the estimation results below, I define two different groups for commercial and savings banks to allow for the possibility that depositors are more likely to substitute across the same type of institutions.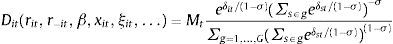
The expression in (12) is not linear in the parameters, but it can be shown to imply, as in Berry (1994), the following linear equation:
where sit represents the market share of bank i in period t, s0t is the market share of the outside option (the best savings alternative to bank deposits) and sit|g is the market share of bank i inside the group of institutions g in period t.
It can be shown that the deposit supply formula in (12) implies that the own deposit rate elasticity is given by:
The cross elasticities of the share of bank i with respect to the deposit rate rst of a bank s in the same nest and in a different nest are given by:
where the formula in (15) is the standard logit cross elasticity and the formulas in (14) and (16) differ from the standard logit benchmark as long as σ≠0, reflecting the different substitution patterns of different banks across groups.

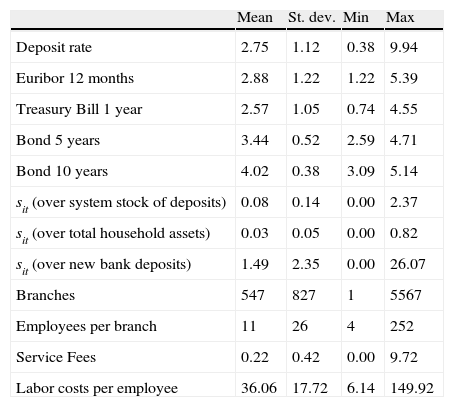
For a bank i in a given month t, I define the share sit as the ratio of the volume of new household deposits in bank i over the total stock of deposits from households in the financial system.12 I use the average weighted by volume of the interest rate on new deposits from households with maturities above and below a year as deposit rate rit in Eqs. (10) and (13). All specifications include as exogenous variables the number of branches, the employees per office, service fees and fixed effects for the trimester and the identity of each bank. Table 1 provides summary statistics of all the variables relevant for estimation.
Summary statistics.
| Mean | St. dev. | Min | Max | |
| Deposit rate | 2.75 | 1.12 | 0.38 | 9.94 |
| Euribor 12 months | 2.88 | 1.22 | 1.22 | 5.39 |
| Treasury Bill 1 year | 2.57 | 1.05 | 0.74 | 4.55 |
| Bond 5 years | 3.44 | 0.52 | 2.59 | 4.71 |
| Bond 10 years | 4.02 | 0.38 | 3.09 | 5.14 |
| sit (over system stock of deposits) | 0.08 | 0.14 | 0.00 | 2.37 |
| sit (over total household assets) | 0.03 | 0.05 | 0.00 | 0.82 |
| sit (over new bank deposits) | 1.49 | 2.35 | 0.00 | 26.07 |
| Branches | 547 | 827 | 1 | 5567 |
| Employees per branch | 11 | 26 | 4 | 252 |
| Service Fees | 0.22 | 0.42 | 0.00 | 9.72 |
| Labor costs per employee | 36.06 | 17.72 | 6.14 | 149.92 |
Note: Deposit rates, service fees, interest rate variables (Euribor 12 months, Treasury bill with 1 year maturity, Spanish government bonds with 5 and 10 year maturities) and shares sit of new deposits from households over various measures of market size are reported in percentage. Branches are reported in thousands.
It is possible to estimate the parameters in (13) through ordinary least squares, OLS henceforth. The OLS method entails the risk of generating inconsistent estimates of β through the possible correlation between the deposit rate rit and the unobserved supply shock ξit. The use of instruments and the two stage least squares method, 2SLS henceforth, avoids this problem and derives consistent estimates of the parameters in β. I use as instruments the sixth lags of the deposit rates, service fee rates, the 10 year bond rate and the labor cost per worker. The organization and cost structure of a bank is stable over six month periods, and the lagged variables with respect to time t provide information about the cost factors affecting the decisions on deposit rates and service fees at time t. Controlling for the bank brand effect and common time effects, the assumption is that interest rate and cost variables in precedent periods are correlated with interest rates at period t through the cost structure, but uncorrelated with the specific bank-month shock ξit.13 The use of the panel structure for identification follows the approach in Hausman et al. (1994), Hausman (1996) and Nevo (2001), but I consider different temporal markets and the cited articles use variation across city markets.14 If σ≠0, the share of deposits sit|g inside a nest appears as an additional endogenous variable in (13) and I add as instruments, following the approach in Berry et al. (1995), the average across rivals of branches and employees per branch, which are exogenous to supply shock ξit but correlated with deposit rates and service fees through market competition. The use of the BLP-type instruments in the estimation of deposit supply is also considered in Dick (2008). The bank characteristics vary through time and I can then use these instruments in estimation together with the time-invariant bank fixed effects. On the contrary, brand characteristics in Nevo (2001) are time-invariant and they cannot be used as instruments if brand fixed effects are included as explanatory variables.
4Estimation resultsI present the results of the estimation of the supply function of household deposits in Table 2. Column (a) of Table 2 presents OLS estimates of a basic logit model (σ=0) to serve as benchmark for the main specifications. The coefficients of the deposit rate, number of branches and employees per branch are positive and significant. On the contrary, the coefficient on service fees is not significant. The average deposit rate elasticity implied by these estimates is 0.63. The OLS coefficients are subject to the endogeneity bias described above and I derive 2SLS estimates of the basic logit model, with deposit rate and service fees as endogenous variables, to avoid this bias. The results of this specification are presented in column (b) of Table 2. The coefficients on both the deposit rate and the service fees increase in size, and the latter variable turns significant. The average deposit rate elasticity increases to 0.94 as result of controlling for endogeneity of the deposit rate and service fees. The column (c) presents the 2SLS estimates of the full nested logit model (σ≠0) in Eqs. (12) and (13), with separate nests for commercial and savings banks. The estimate 0.23 of the correlation parameter σ is significant and it rejects the hypothesis that the basic logit model is a valid description of the supply of deposits. The average deposit rate elasticities in the specifications of columns (b) and (c) are comparable, but the basic logit model underestimates the cross rate elasticity inside a nest. The basic logit implies a cross elasticity of −0.0008 whereas the nested logit model implies a cross elasticity of −0.007. A commercial or savings bank that offers higher deposit rates attracts more deposit funds from other institutions inside the same nest. Column (d) estimates again the 2SLS nested logit model, but it uses as definition of market share sit the ratio of new deposits to total household assets, which implies the assumption that households can convert any of their assets (corporate shares, public debt, etc.) into bank deposits. The results are robust to this different normalization of the market size.15 The standard errors in all the specifications are robust to heterocedasticity problems.
Supply of bank deposits.
| (a) | (b) | (c) | (d) | |
| Branches | 0.5416*** | 0.4416*** | 0.3460*** | 0.3456*** |
| 0.0819 | 0.0844 | 0.0724 | 0.0727 | |
| Deposit rate | 0.2273*** | 0.3426*** | 0.2606*** | 0.2640*** |
| 0.0191 | 0.0470 | 0.0396 | 0.0396 | |
| Employees per branch | 0.0025* | 0.0040** | 0.0029** | 0.0030** |
| 0.0014 | 0.0018 | 0.0014 | 0.0014 | |
| Service fees | −0.1142 | −0.3132* | −0.2444* | −0.2449* |
| 0.0964 | 0.1751 | 0.1373 | 0.1378 | |
| σ | 0.2345*** | 0.2331*** | ||
| 0.0632 | 0.0631 | |||
| Constant | −8.3004*** | −8.5824*** | −7.5321*** | −8.5006*** |
| 0.0906 | 0.1633 | 0.2904 | 0.2903 | |
| Own interest rate elasticity | 0.6255 | 0.9426 | 0.9302 | 0.9410 |
| 0.2535 | 0.3820 | 0.3767 | 0.3811 | |
| Cross elasticity (inside a nest) | −0.0005 | −0.0008 | −0.0072 | −0.0069 |
| 0.0011 | 0.0017 | 0.0123 | 0.0116 | |
| Cross elasticity (outside a nest) | −0.0005 | −0.0008 | −0.0006 | −0.0002 |
| 0.0011 | 0.0017 | 0.0013 | 0.0005 | |
| Individual Fixed Effect | Significant | Significant | Significant | Significant |
| Trimester Fixed Effect | Significant | Significant | Significant | Significant |
| R2 | 0.88 | 0.87 | 0.92 | 0.93 |
| Number of observations | 6384 | 5938 | 5938 | 5938 |
Note: The dependent variable in all specifications is ln(sit)−ln(s0), where sit is the share of new deposits of entity i over the total stock of deposits as defined in Section 3. The column (a) contains OLS estimates of the basic logit model, the column (b) provides 2SLS estimates of the basic logit model with Deposit Rate and Service Fees as endogenous variables, the column (c) provides 2SLS estimates of the nested logit model with Deposit Rate, Service Fees and the market share in a nest as endogenous variables, column (d) uses the same specification as column (c) with sit defined as the share of new deposits of entity i over total household assets.
For each variable, the coefficient is reported in the upper position and standard error in the lower position. Own and cross elasticities are calculated with the formulas in (14)–(16). The sample mean and standard deviation for each type of elasticity are reported respectively in upper and lower positions. The coefficients significant at 1% (5%, 10%) are marked with notation *** (**,*).
The average estimated elasticity of deposit supply to the deposit rate is in the range [0.63, 0.94]. This elasticity is relatively low, but it lies in the range of values previously found in the literature.16 Given that the price is an interest rate, we must take into account that high relative changes in this price, e.g., a doubling of deposit rates from 1.5% to 3% implying a 100% change, are possible and a greater elasticity would predict extreme variations in the volume of deposits as response to changes in deposit rates. The elasticity with respect to the number of branches, for a bank with an average number of branches equal to 550 is 0.242, which is below the figures found by Carbó et al. (2005), 0.782, and Martín-Oliver (2010), 0.318. Given that I study a period posterior to the years in the cited articles, the results point to a decreasing importance of the branch network in the determination of the supply of deposits.
The estimated parameters are used to evaluate (10) and recover Rit. The cross sectional average of individual implicit returns on deposit funds in each period, Rt, is then compared with candidate reference rates in Fig. 3. This average implied return Rt oscillates between 4.8% and 7.8% in the sample, with a clear increase in 2008. Fig. 3 reveals how the level of the interest rates on public debt with maturities of 5 and 10 years is closer to the implicit return on deposit funds than the level of the Euribor 12 months, but that the evolution of the interest rates on public debt and the implicit return are not clearly connected. On the contrary, the Euribor 12 months follows an evolution parallel to the implicit return over 2008 and the complete sample. These results point that it is not profitable to obtain funding through bank deposits to take a long position in the interbank market, but that the Euribor 12 months provides information about the expected implicit return on funds obtained through bank deposits.
 with the assumption of nested logit deposit supply and using the estimated coefficients of column (c) of Table 2. The figure plots the cross sectional average Rt of individual bank returns Rit at each month.")
Implicit return on deposits. Note: The implicit expected rate of return Rit is calculated with the formula in (10) with the assumption of nested logit deposit supply and using the estimated coefficients of column (c) of Table 2. The figure plots the cross sectional average Rt of individual bank returns Rit at each month.
The absolute level of the implicit return cannot be justified only by the possibility of investing in Spanish government debt because the interest rates on this class of assets are not as high as the implicit return. In order to rationalize the estimated implicit returns, it is necessary to consider the returns on other assets such as existing and prospective loans to non financial firms and households and the private benefits for management. For the period considered, the expected implicit returns on deposit funds can also include the discounted return from the future participation in public support programs provided that current financing needs are covered with bank deposits.
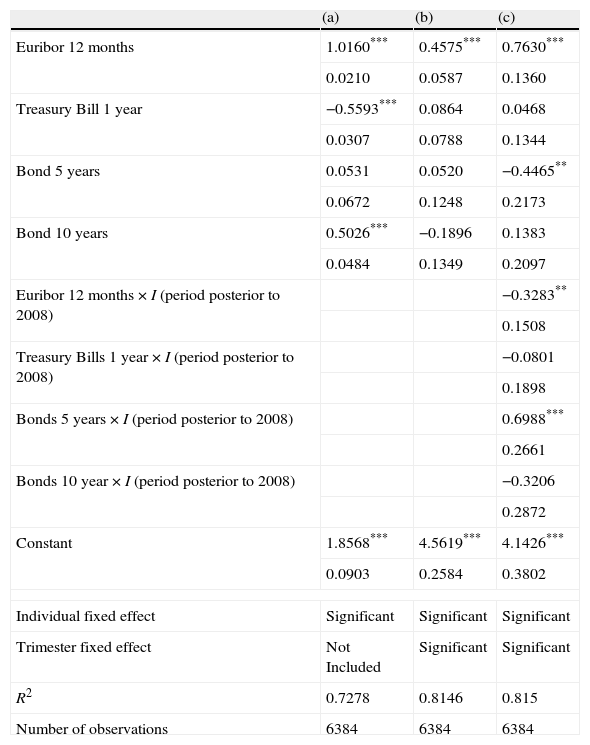
Table 3 presents the results for the OLS projections of the implicit return Rit on the reference interest rates according to the specification in Eq. (9). The standard errors in all the specifications are robust to heterocedasticity problems. The specification in column (a) of Table 3 shows that all reference rates except the Spanish Public Debt with a five year term are correlated with the deposit rate, as the coefficients on these variables are both individually and jointly significant. The rejection of the hypothesis of a zero coefficient on the Euribor 12 months is the strongest according to individual t-tests. To control for the effect of common latent factors, I include fixed effects for the trimester in the specification in column (b) of Table 3, and I observe how the returns on the Spanish public debt with one and 10 year terms lose their explanatory power. In order to accommodate a possible structural change as result of the financial crisis initiated in 2008, the specification in column (c) of Table 3 includes interactions of all the variables with an indicator for dates contemporaneous and posterior to 2008. The correlation between the deposit rate and the returns on Spanish public debt with a five year term turns significant when I control for the possibility of structural change. Furthermore, this relation is not stable through the sample, but it switches from negative to positive after 2007. This result would be consistent with the adoption of long positions in Spanish public debt during the latter part of the sample, as suggested by the descriptive analysis in Section 2. The model also finds a change in the relation between the Euribor 12 months and the deposit rate after 2007. The net effect of the Euribor 12 months remains positive through the sample, but it is weaker during the period of financial crisis with a coefficient of 0.76 before 2008 and 0.76–0.32=0.44 after this date.
Determinants of the implicit expected return on deposits.
| (a) | (b) | (c) | |
| Euribor 12 months | 1.0160*** | 0.4575*** | 0.7630*** |
| 0.0210 | 0.0587 | 0.1360 | |
| Treasury Bill 1 year | −0.5593*** | 0.0864 | 0.0468 |
| 0.0307 | 0.0788 | 0.1344 | |
| Bond 5 years | 0.0531 | 0.0520 | −0.4465** |
| 0.0672 | 0.1248 | 0.2173 | |
| Bond 10 years | 0.5026*** | −0.1896 | 0.1383 |
| 0.0484 | 0.1349 | 0.2097 | |
| Euribor 12 months×I (period posterior to 2008) | −0.3283** | ||
| 0.1508 | |||
| Treasury Bills 1 year×I (period posterior to 2008) | −0.0801 | ||
| 0.1898 | |||
| Bonds 5 years×I (period posterior to 2008) | 0.6988*** | ||
| 0.2661 | |||
| Bonds 10 year×I (period posterior to 2008) | −0.3206 | ||
| 0.2872 | |||
| Constant | 1.8568*** | 4.5619*** | 4.1426*** |
| 0.0903 | 0.2584 | 0.3802 | |
| Individual fixed effect | Significant | Significant | Significant |
| Trimester fixed effect | Not Included | Significant | Significant |
| R2 | 0.7278 | 0.8146 | 0.815 |
| Number of observations | 6384 | 6384 | 6384 |
Note: The specification (a) does allow neither a change in coefficients for the periods contemporaneous or posterior to year 2008 nor the trimester fixed effects. The specification (b) adds the trimester fixed effects and the specification (c) adds both the trimester fixed effects and the possible change in coefficients for the periods contemporaneous or posterior to year 2008 in order to test the stability of the relation between candidate reference rates and the implicit expected return on deposits.
For each variable, the coefficient is reported in the upper position and standard error in the lower position. The coefficients significant at 1% (5%, 10%) are marked with notation *** (**,*).
This section examines the sensitivity of deposit rates and bank profits to variations in the reference interest rates and the intensity of competition. I use the deposit supply model in column (c) of Table 2 and the projection of the implicit return of deposit funds on reference interest rates in column (c) of Table 3 in the computations of the different counterfactual experiments. All the computations are performed for the financial crisis period of 2008–2010.
5.1Transmission of the interbank rateThe results in Table 3 reveal that the increase of the Euribor 12 months leads to a higher return Rit on deposit funds, increasing the profits of bank i for a given volume of new deposits. However, competition in the deposit market also increases the deposit rate rit offered to households as response to a higher return Rit. In order to quantify the transmission to deposit rates and profits of the changes in the Euribor 12 months, I consider a counterfactual implicit return Rit(c) given by the expression:
where Rit is the implicit return estimated from Eq. (10), 0.44 is the impact of the Euribor 12 months on Rit from specification (c) of Table 3, and ΔRt,Euribor is the difference of the Euribor 12 months on month t and the average value of 2.6% for this interbank rate in the period 2008–2010. I obtain then for each month t a set of counterfactual returns {Rit(c)}i=1,…,I(t) with I(t) equal to the number of active banks. This shift to the average of the period leads to a decrease of the Euribor 12 months before February 2009, implying that Rit(c)<Rit, and an increment of the interbank rate, implying that Rit(c)>Rit, after that date.
Given the set of counterfactual returns {Rit(c)}i=1,…,I(t), I solve for every month t for the Nash equilibrium in deposit rates from the system of first order conditions that result from maximization of individual bank profits. The computation of the Nash equilibrium uses the estimates of the nested logit specification (c) in Table 2 and I recognize the variance that the estimated parameters introduce in the counterfactual computations with the use of parametric bootstrap. I take 500 draws {βb}b=1,…,500 of the distribution of estimated deposit supply parameters β and compute the counterfactual deposit equilibrium and the change in profits for the period 2008–2010 for each draw βb. Confidence intervals on the changes of deposit rates and profits are then constructed from the bootstrap sample. The procedure is further detailed in the Appendix A.
I report in Table 4 the average variation in deposit rates and the cumulative change in profits at the end of each semester of the period 2008–2010. The reduction of the return on deposit funds Rit(c) brings down bank profits by 1061 and 1312 million euros in the first and second semesters of 2008 for the median profit change across bootstrap samples. Bank profits decrease despite the fact that the lower return on deposit funds Rit(c) implies equilibrium deposit rates that are on average 90bp lower than observed rates in year 2008. In years 2009 and 2010, the increase of Rit(c) with respect to Rit leads to an average increase in profits of 1300 million euros every semester and an average increase of deposit rates of 50bp. Fig. 4 plots the monthly counterfactual variation in bank profits and shows how the magnitude of the profit adjustment is a function of the counterfactual change in the Euribor 12 months. The Euribor 12 months series is above its period average during 2008 and below this average for years 2009 and 2010, and the plot reveals negative profit changes in 2008 and increasingly positive adjustments for 2009 and 2010.
Sensitivity analysis of deposit rates and profitability.
| Experiment 1 | Experiment 2 | Experiment 3 | |||||
| Δrit | Δπit | Δrit | Δπit | Δrit | Δπit | ||
| June 2008 | p5 | −1.91 | −1556 | −4.03 | −4340 | −2.63 | 455 |
| p50 | −0.91 | −1061 | −3.03 | −3616 | −1.19 | 786 | |
| p95 | −0.31 | −54 | −2.43 | −2360 | −0.35 | 1710 | |
| December 2008 | p5 | −1.95 | −1850 | −4.24 | −4879 | −2.63 | 313 |
| p50 | −0.95 | −1312 | −3.24 | −4120 | −1.19 | 621 | |
| p95 | −0.35 | −267 | −2.64 | −2860 | −0.34 | 1570 | |
| June 2009 | p5 | −0.69 | 829 | −2.66 | −2660 | −2.59 | 554 |
| p50 | 0.31 | 1051 | −1.65 | −2147 | −1.16 | 720 | |
| p95 | 0.92 | 1456 | −1.05 | −1194 | −0.32 | 1342 | |
| December 2009 | p5 | −0.40 | 1274 | −2.32 | −2145 | −2.59 | 398 |
| p50 | 0.60 | 1544 | −1.32 | −1617 | −1.15 | 628 | |
| p95 | 1.21 | 1975 | −0.71 | −652 | −0.30 | 1419 | |
| June 2010 | p5 | −0.38 | 1102 | −2.11 | −1497 | −2.57 | 275 |
| p50 | 0.62 | 1354 | −1.11 | −1056 | −1.12 | 512 | |
| p95 | 1.23 | 1765 | −0.51 | −227 | −0.27 | 1228 | |
| December 2010 | p5 | −0.48 | 936 | −2.09 | −1429 | −2.57 | 345 |
| p50 | 0.52 | 1124 | −1.08 | −1048 | −1.12 | 494 | |
| p95 | 1.13 | 1447 | −0.48 | −328 | −0.27 | 1051 | |
Note: The Experiment 1 sets the Euribor 12 months equal to its average in the period 2008–2010 and adjusts the implicit return on deposits with the formula (17) in Section 5. The Experiment 2 assumes that the 10 year Spanish government bond is the only investment opportunity for the sample banks and sets the implicit return equal to the interest rate on this bond. The Experiment 3 calculates the deposit rates and profitability of a perfectly collusive cartel with the actual estimated implicit return.
For each end of semester in the period 2008–2010, I report the average difference of counterfactual deposit rates and observed rates (Δrit) and the sum of the difference of counterfactual and observed implicit profits on deposit funds (Δπit). I compute these variations for 500 bootstrap samples of supply parameters β and I report the results for 5th, 50th and 95th percentiles (p5, p50, p95) across the bootstrap samples.
. Note: The plot shows for each month the difference Δπit of counterfactual and actual implicit profits on deposit funds for a counterfactual level of profits derived from the Nash-pricing equilibrium in deposit rates with the expected return of deposits adjusted by a shift of the Euribor 12 months to its average during the period 2008–2010. The central series and the confidence intervals for Δπit are the 5th, 50th and 95th percentiles across bootstrap samples.")
Counterfactual change in profitability (interbank experiment). Note: The plot shows for each month the difference Δπit of counterfactual and actual implicit profits on deposit funds for a counterfactual level of profits derived from the Nash-pricing equilibrium in deposit rates with the expected return of deposits adjusted by a shift of the Euribor 12 months to its average during the period 2008–2010. The central series and the confidence intervals for Δπit are the 5th, 50th and 95th percentiles across bootstrap samples.
I use the method in Section 5.1 with the asset rate Rit(c) set equal to the interest rate on the 10 year Spanish government bond. The average interest rate on the 10 year government bond is 4.2% in the period 2008–2010, whereas the average estimate of the implicit return on deposit funds is 6%. The limitation of investment opportunities of banks to long term Spanish government debt brings down the level of the implied return on deposits Rit(c) and this is translated into lower deposit rates and bank profits. The results on Table 4 and Fig. 5 reveal a large profit adjustment in 2008, with a decrease in profits of 3616 million euros in the first semester and 4120 million euros in the second semester of this year. The depositors also would be negatively affected with an average decrease of deposit rates of 300bp in 2008. The adjustment to profits and deposit rates remains negative in 2009 and 2010, but the magnitudes are lower than in 2008.
. Note: The plot shows for each month the difference Δπit of counterfactual and actual implicit profits on deposit funds for a counterfactual level of profits derived from the Nash-pricing equilibrium in deposit rates with the expected return of deposits equal to the interest rate on the 10 year Spanish government bond. The central series and the confidence intervals for Δπit are the 5th, 50th and 95th percentiles across bootstrap samples.")
Counterfactual change in profitability (public debt experiment). Note: The plot shows for each month the difference Δπit of counterfactual and actual implicit profits on deposit funds for a counterfactual level of profits derived from the Nash-pricing equilibrium in deposit rates with the expected return of deposits equal to the interest rate on the 10 year Spanish government bond. The central series and the confidence intervals for Δπit are the 5th, 50th and 95th percentiles across bootstrap samples.
The results of this counterfactual exercise are explained by the fact that the estimated implicit return achieves its highest levels in year 2008, as shown in Fig. 3, and it decreases after December 2008, approaching levels closer to the interest rate on long term government debt. As the estimated implicit return reflects the expectations of bank managers, the counterfactual change in profits in this experiment can also be interpreted as the additional profits that bank managers expected to earn above the profits resulting from investment in Spanish long term government debt.
5.3CollusionI compute for every month t the deposit rates {rit,M}i=1,…,I(t) set by a perfectly collusive cartel with the return on deposit funds Rit(c) used in the counterfactual experiment equal to the estimated implicit rate Rit. This experiment measures the sensitivity of deposit rates and bank profits during the crisis period to the intensity of competition while keeping the reference interest rates equal to their observed values. Table 4 and Fig. 6 reveal that the changes to deposit rates, an average reduction of 115bp through the sample, and bank profits, an average increase of 105 million per month, are stable in the period 2008–2010. The counterfactual change in profits is not negligible, e.g., an additional profit of 1407 million euros would have been earned in 2008 by a cartel formed with the sample entities, but the computed variations are inferior with respect to the interest rate experiment. This indicates that the improvement of investment opportunities has a potential greater impact on profitability of deposit funds than the relaxation of competitive conditions.
. Note: The plot shows for each month the difference Δπit of counterfactual and actual implicit profits on deposit funds for a counterfactual level of profits calculated from the solution to the deposit rate setting problem for the perfectly collusive cartel. The central series and the confidence intervals for Δπit are the 5th, 50th and 95th percentiles across bootstrap samples.")
Counterfactual change in profitability (collusion experiment). Note: The plot shows for each month the difference Δπit of counterfactual and actual implicit profits on deposit funds for a counterfactual level of profits calculated from the solution to the deposit rate setting problem for the perfectly collusive cartel. The central series and the confidence intervals for Δπit are the 5th, 50th and 95th percentiles across bootstrap samples.
This article estimates a discrete choice model of household deposit supply that controls for the endogeneity of deposit rates and allows for different substitution patterns across types of institutions. I find that depositors of commercial and savings banks are more likely to substitute their deposits within banks of the same type and that deposit rate elasticity is moderate but significant.
The estimates of the deposit supply model are used in a structural price competition model to recover the return on deposit funds implicit in the bank decisions on the volume and remuneration of new deposits from households. The implicit return is clearly correlated with the interbank rate through the sample period, indicating that either banks participate actively in the interbank market or, more plausibly, that the interbank rate is an important reference for bank investments, e.g., mortgage and corporate loans, even if banks have a limited participation in the interbank market. The interbank rate maintains a clear empirical connection with deposit rates and the implicit return on deposit funds despite the concern about the higher weight of public debt in the investment portfolio of Spanish banks. The relation of deposit returns and interest rates on long term debt through the whole sample period is weaker than the relation with the interbank rate, but I find some evidence of a stronger link between public debt and returns on deposit funds after the start of the financial crisis of 2008.
Counterfactual analysis reveals a sizeable variation of deposit rates and bank profits as response to changes in the interbank rate. I also find that the limitation of bank investment opportunities to long term Spanish government debt would yield a level of bank profits lower than the implicit bank profits recovered in the estimation exercise. However, the negative profit difference associated to exclusive investment in public debt is lower in the later years 2009 and 2010. The moderation of competition is found to have a lower impact on bank profits than modification of reference rates in the interbank and public debt markets, but it would still be possible to increase bank profits significantly through collusion in the deposit market.
The Nash equilibrium deposit rate rit,NE of bank i solves the following profit maximization problem:
where Rit(c) is the counterfactual return on deposit funds, D(·) is the nested logit deposit supply function in (12) evaluated with the parameters in specification (c) in Table 2 and the equilibrium deposit rates of all other banks r−it,NE are fixed parameters in the individual profit maximization problem of bank i. For each month t, I solve for the Nash equilibrium deposit rates {rit,NE}i=1,…,I(t) from the system of first order conditions resulting from the problem in (18) for each bank i, where I(t) is the number of active banks on month t. A generic equation of this system takes the following form:

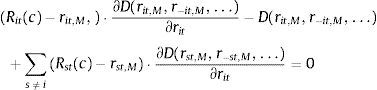
The deposit rates {rit,M}i=1,…,I(t) chosen by a perfectly collusive cartel solve the profit maximization problem of the multi-brand monopoly:
where all the relevant terms are defined as above. The solution of (20) with a direct search algorithm is possible, but it is more computationally efficient to work directly with the system of first order conditions of the problem in (20), with the first order condition for rit,M adopting the following generic form: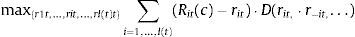
The parametric bootstrap scheme used in the counterfactual exercises takes random draws βb of the form:
where β and Γβ are respectively the estimated coefficients and the lower Cholesky decomposition of the variance covariance matrix Σβ for the nested logit specification (c) in Table 2. The term ω is a vector of draws of independent standard normal variables with size equal to the number of estimated coefficients in β. Train (2009) provides further details on random sampling schemes.
In particular, Klein (1971) and Monti (1972) models of multiproduct monopoly in which the bank determines the amounts of loans and deposits. These models can be generalized to a Cournot oligopoly model and to models of monopoly and oligopoly with price as strategic variable. See Freixas and Rochet (2002).
I wish to thank Raicho Bojilov, Gabriel Jimenez, Carlos Trucharte and the editor for their helpful comments. This article is my sole responsibility and, in particular, it does not necessarily represent the views of the Bank of Spain or the Eurosystem.
For example, Bank of Spain interest rate reports (model I.2 described in BOE (2010)) show that approximately 90% of mortgages for home acquisitions are granted with a revision period of less than a year. The mortgage rate is commonly referred to the Euribor interbank rate in contract revisions.
The ECB documents the continued use of its liquidity transactions by European banks since 2008. See Section 3 of the ECB Financial Stability Review in ECB (2008, 2010). The ECB provides an overview of its open market operations at http://www.ecb.int/mopo/implement/intro/html/index.en.html.
The concern over the impact of competitive tensions on the level of deposit rates lead to the Bank of Spain to introduce penalty contributions to the Deposit Guarantee Fund as a function of the level of deposit rates offered. See BOE (2011).
Additional international studies of deposit institutions include Cohen (2004), Cohen and Mazzeo (2007), Corvoisier and Gropp (2002), Focarelli and Panetta (2003) and Guo (2003).
Recent novel theoretical contributions include Broner et al. (2010), Bolton and Jeanne (2011) and Acharya and Rajan (2013). Acharya and Steffen (2013) analyze empirically the incentive of banks to raise short term finance and invest in public debt and Gennaioli et al. (2012) study the impact of sovereign default on private sector credit with a panel of countries.
The interest rate data collection by the bank of Spain follows European Monetary and Economic Union regulations, as published in the Bank of Spain Order 1/2010 in BOE (2010). The model form I.2 for interest rate information used in the article can be consulted in that same order in BOE (2010).
The volatility of the margin with respect to the interest rate on the bonds with 5 and 10 year terms is lower due to the higher average level of the yield on these bonds. The relative margin is defined as (rA−rDEP)/rA, so a higher level of asset return rA reduces the impact on the standard deviation of the greater cross sectional variability of the deposit rate rDEP.
A perfectly elastic supply of public debt at rate r(m) would allow to generate infinite profits through arbitrage if REuribor≠r(m) and equilibrium market clearing would require REuribor=r(m). I introduce the interest rate bid ri(m) and function Mi(·) motivated by the competitive bidding in primary public debt markets and order clearing in organized security exchanges that provide secondary markets. This is a reasonable assumption to construct a simple illustrative model with both interbank and debt markets.
It is straightforward to extend the analysis to include capital as a financing alternative. This extension is omitted for brevity, as the examination of the interbank and debt markets suffices for the purpose of illustrating the effect on deposit rates of limited access to a particular securities market.
A full exposition of the nested logit and other generalized extreme value discrete choice models can be found in Mc Fadden (1978), Berry (1994) and Train (2009).
Spanish legislation allows depositors to cancel deposits – with a penalty on the interest rate paid – so it is possible to substitute existing deposits for new deposits and the stock of deposits in the financial market is a good measure of market size.
The sixth month lag was chosen as a reasonable period to avoid contemporaneous correlation with unobserved supply factors and ensure that the bank cost structure is stable between current and lag dates. The estimation results are comparable if other lags are used, e.g., 3 months and 9 months.
The articles mentioned above consider that the prices of a product brand in different cities are correlated through common costs at the brand level and that city specific demand components affecting prices are not correlated across cities. The use of lagged variables as instruments can also be justified with the assumption that deposit rates and services fees are predetermined.
The substitution of the stock of deposits with total household assets increases the potential market size. I have also checked the robustness of the results to the reduction of market size to a fraction of the total stock of deposits and obtained satisfactory results.
For the case of Spain in the period 1993–2002, Carbó et al. (2005) find an elasticity of 0.46 whereas Martín-Oliver and Salas-Fumás (2008) estimate an elasticity of 2.27 in the period 1988–2003. Fort the case of the US, there is also variation in the range of elasticities estimated in different articles. For example, Adams et al. (2007) find an average elasticity of 3.47 whereas the specification in Dick (2008) yields an estimate of 1.77 and Ho and Ishii (2011) find an elasticity of 1.19.

