


This paper examines the mean-reversion property and volatility features of stochastic convenience yields for CO2 emissions allowances by using ADF, ECM-GARCH and ECM-TGARCH models. Empirical results show that the convenience yields for CO2 emissions allowances exhibit time-varying trends when different maturities are considered, and that convenience yields exhibit a linear mean-reverting process. We also find that the volatility of convenience yields exhibits a mean-reversion process and asymmetric leverage effect using ECM-GARCH (1,1) and ECM-TARCH (1,1) models. Unfavorable market information has a higher impact on this volatility than favorable market information, and unfavorable market information has a lower effect on the long-term volatility of convenience yields.
In recent years, CO2 gas emissions have attracted increasing public attention. CO2 gas emissions control and environmental protection have become hot political and academic topics. Since the launch of the European Union emissions trading scheme (EU ETS) in 2005, CO2 emissions allowances have become valuable commodities which can be traded in the CO2 emissions allowances markets. Based on the research report on the state and trend of the carbon market in 2011 by the World Bank, the total value of the global carbon markets had grown 6% to US $144 billion, and the trading volumes had reached 8.7 billion tons. CO2 emission allowances markets have become significantly promising and liquid commodities markets, and have the potential to grow into the largest commodities markets in the future.
Early empirical results show that spot and futures prices for CO2 emissions allowances exhibit strong stochastic behavior. Benz and Truck (2006) propose that emissions allowances prices are directly determined by the expected market scarcity in the CO2 emissions allowances markets. Seifert et al. (2008) and Benz and Trück (2009) find that spot prices exhibit a time-varying volatility structure in the pilot phase. Daskalakis et al. (2009) show that the prohibition of banking and borrowing for emissions allowances between distinct phases in the EU ETS has significant implications in terms of futures and options pricing. Montagnoli and Vries (2010) show, by using variance ratio tests, that Phase I was inefficient, while Phase II shows signs of restoring market efficiency. Milunovich and Joyenx (2010) examine market efficiency and price discovery in CO2 emissions allowances futures markets in the European Union. Their findings indicate that spot and futures markets can share information efficiently and futures markets contribute to price discovery. Chevallier (2010) proposes a time-varying risk premium between CO2 spot and futures prices, and that a positive relationship exists between risk premium and time-to-maturity of futures contracts.
Emissions allowances markets are emerging financial markets. Many studies have shown that financial products and commodities price series follow a mean-reverting process which indicates the internal balance mechanism in the price series. Gibson and Schwartz (1990) develop a two-factor model for commodity pricing, where spot price follows a geometric Brownian motion and the convenience yield follows a mean-reverting process. Schwartz (1997) and Miltersen and Schwartz (1998) propose a three-factor model for commodity futures pricing where the commodity spot price, the instantaneous convenience yields, and the instantaneous interest rates are important variables. Liu and Tang (2011) show that the volatility of convenience yields is heteroskedastic for industrial commodities, and propose that the heteroskedasticity of the convenience yields predicts an upward sloping implied volatility smile. These signs are of central importance to commodities pricing and commodities options value. The stochastic convenience yield is a significant variable for commodity pricing, and mean-reversion convenience yields are central for forecasting commodity price and estimating hedging returns. Accordingly, in this paper we examine the mean-reverting properties and the volatility features of stochastic convenience yields for CO2 emissions allowances.
Mean reversion is a tendency toward return to long-run average value over time. Previous studies find that convenience yields show a mean-reverting process in the two-factor and three-factor commodity futures pricing models. Generally speaking, mean-reversion behavior in convenience yields is expected because of the strong tendency, and short-term random convenience yields converge to their mean values in the long run. After temporarily deviating from their equilibrium value, convenience yields always revert toward their equilibrium value, hence the process is mean-reverting. This property of convenience yields is an important hedge and risk management factor for commodity producers, hedgers, financial intermediaries and other market participants.
Immature emissions allowances markets bring about the overreaction in spot and futures prices (see Montagnoli and Vries, 2010; Zhang and Wei, 2011). In the weak-effective emissions allowances markets, spot and futures prices have greater upward risk and downward risk trends, the obvious market risk changes bring market participants about tremendous uncertainty in assets portfolio between spot and futures for emissions allowances. The convenience yields are potential benefits implied from emissions allowances markets and the above early literatures on emissions allowances do not propose empirical results in mean reversion property and volatility features of convenience yields. Mean reversion property and volatility features of convenience yields are central to accurately predicting futures options pricing and making correct assets portfolio hedging policies.
The main innovations of this paper are that we capture mean-reversion property and asymmetric leverage effects in convenience yields for emissions allowances by using the ECM-GARCH and ECM-TARCH models. These empirical results are helpful for capturing market price behavior and explaining the spread between spot and futures prices. They are also helpful for accurately adjusting assets portfolio sizes between spot and futures and achieving the greater assets portfolio revenues.
The remainder of our paper is organized as follows. Section 2 describes the sourcing of data samples. Section 3 analyzes the statistical analysis results in convenience yields for CO2 emissions allowances. Section 4 proposes mean-reversion empirical methodology. Section 5 estimates and discusses the empirical results. Section 6 provides a brief conclusion.
2Data descriptionThe EU ETS is the largest greenhouse gas (GHG) emissions trading system in the world. It has experienced two phrases: the Pilot phase (2005–2007) and the Kyoto phase (2008–2012). The CO2 emission rights, called EU allowances (EUA), allow for the right to emit one ton of CO2 into the atmosphere under the European Union emissions trading scheme (EU ETS). The minimum trading volume for each standard futures contract is 1000tons of CO2 equivalents. In this paper, we select data samples from the settlement spot and futures prices in the BlueNext and ICE exchange platform. Spot trading in the BlueNext exchange was introduced on June 24, 2005, and now BlueNext has become the most liquid platform for CO2 spot trading. ICE has become the most liquid platform for CO2 futures trading since its introduction on April 22, 2005.
After the European Union banned out-of-phase banking and borrowing, the spot price for CO2 emissions allowances fell down to zero from October 2006 to December 2007 (see Chevallier, 2010). The trading of futures contracts with vintages December 2013 and 2014 was introduced on April 8, 2008. We select data samples from time-varying settlement prices on EUA futures contracts with different maturities from December 2010 to December 2014. Considering the availability and continuity of EUA futures prices, we choose these data samples to cover the period from April 8, 2008 to December 20, 2010 in the Kyoto phase. Here we choose as the constant free-risk rate, the average coupon rate of 3.06% which was the rate for three-year government bonds issued in 2010 in the European Union.
In Fig. 1, S denotes spot price for CO2 emissions allowances, F1 denotes the EUA futures contracts that are closest to maturity, F2 denotes the second closest to maturity, and F3, F4, F5 are defined similarly. From Fig. 1, we obviously observe that CO2 price series for both spot and futures contracts with different maturities exhibit strongly time-varying trends throughout the sample period.
3Convenience yields for CO2 emissions allowances
Convenience yields are defined as the immediate benefit or risk premium associated with holding underlying products or physical commodities at hand. Spot holders can achieve potential benefits due to price volatility, but the holders of futures contracts cannot attain such benefits (see Working, 1949; Brennan, 1958). The prices of CO2 emissions allowances exhibit random trends, so spot holders of emissions allowances suffer the largest market risk. Price fluctuation for emissions allowances is induced by many factors, such as change in regulation policy for emissions control, energy price volatility, innovation and application in low-carbon technology, extreme climate change, etc. Convenience yields fully reflect the spot holders’ expectation of price changes for emissions allowances. Short supply induces the market scarcity in quantity of CO2 emissions allowances. Greater market scarcity pushes up the price for emissions allowances, so spot holders can achieve the highest convenience yields for emissions allowances.
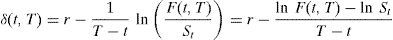
The simple cost of carry model describes an arbitrage relation among the futures price, spot price, and the cost of carrying the assets (see Heaney, 2002). Assuming no arbitrage, transaction cost and storage cost for CO2 emissions allowances, based on the cost of carry model, the futures and spot prices are linked through F(δ,t,T)=Ste(r−δ)(T−t). Here St denotes spot price for emissions allowances at time t, F(t, T) denotes price of futures contracts for maturity T at time t, r is the continuously compounded risk-free interest rate, and δ is the convenience yield for CO2 emissions allowances (see Working, 1949; Brennan, 1958). Accordingly, the convenience yield is equal to (Table 1)
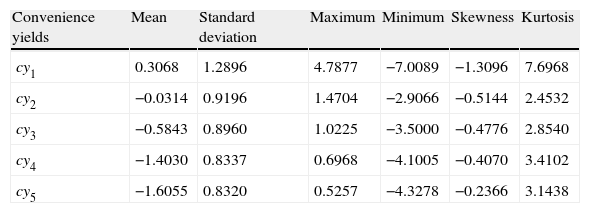
Descriptive statistics in convenience yields for CO2 emissions allowances (×100%).
| Convenience yields | Mean | Standard deviation | Maximum | Minimum | Skewness | Kurtosis |
| cy1 | 0.3068 | 1.2896 | 4.7877 | −7.0089 | −1.3096 | 7.6968 |
| cy2 | −0.0314 | 0.9196 | 1.4704 | −2.9066 | −0.5144 | 2.4532 |
| cy3 | −0.5843 | 0.8960 | 1.0225 | −3.5000 | −0.4776 | 2.8540 |
| cy4 | −1.4030 | 0.8337 | 0.6968 | −4.1005 | −0.4070 | 3.4102 |
| cy5 | −1.6055 | 0.8320 | 0.5257 | −4.3278 | −0.2366 | 3.1438 |
In Fig. 2, cy1,cy2,cy3,cy4,cy5 denote the convenience yields for CO2 emissions allowances futures contracts with different maturities from December 2010 to December 2014. Among them, cy1 is the convenience yield with the futures contract that is closest to maturity, cy2 is the convenience yields with the futures contract that is second closest to maturity, and cy3,cy4,cy5 are defined similarly. From Table 2, we detect the obviously time-varying trends for all the convenience yields, and standard deviation in the convenience yields for CO2 emissions allowances declines with the increase of time-to-maturity. Mean value in the convenience yields decreases with the increase of time-to-maturity. Higher negative convenience yields in the Kyoto period show that market participants reach higher yields by holding futures contracts. All skewnesses in the convenience yields are less than zero, thus convenience yields exhibit left-skewed and asymmetric distribution. All kurtoses in the convenience yields are larger positive, thus convenience yields exhibit a leptoturtosis disttribution.
.")
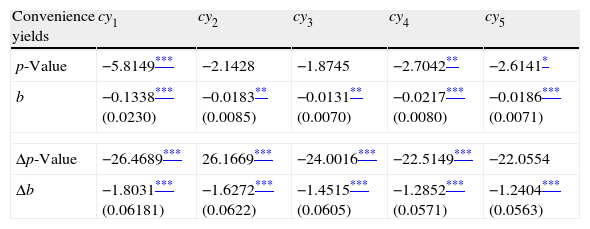
Empirical results of Augmented Dickey–Fuller (ADF) tests for convenience yields.
| Convenience yields | cy1 | cy2 | cy3 | cy4 | cy5 |
| p-Value | −5.8149*** | −2.1428 | −1.8745 | −2.7042** | −2.6141* |
| b | −0.1338*** (0.0230) | −0.0183** (0.0085) | −0.0131** (0.0070) | −0.0217*** (0.0080) | −0.0186*** (0.0071) |
| Δp-Value | −26.4689*** | 26.1669*** | −24.0016*** | −22.5149*** | −22.0554 |
| Δb | −1.8031*** (0.06181) | −1.6272*** (0.0622) | −1.4515*** (0.0605) | −1.2852*** (0.0571) | −1.2404*** (0.0563) |
Notes: 1. Lag length is equal to 1. We estimate coefficients by the following equation Δxt=a+bxt−1+c1Δxt−1+εt.
2. At confidence levels of 99%, 95%, 90%, the critical values of the ADF test with intercept are −3.4396, −2.8655, −2.5689.
3. p-Value denotes the ADF test statistic with intercept, Δp-value denotes the first-difference ADF test statistic with intercept, the statistic value in parentheses is the standard error.
Based on Granger and Teräsvirta (1993), the nonlinear unit root test used in this paper is a basic extension of the traditional linear ADF unit root test. In order to investigate whether convenience yields for CO2 emissions allowances involve linear mean reversion, we use the Augmented Dickey–Fuller (ADF) unit root methodology.
Here xt denotes the time series of the convenience yields for CO2 emissions allowances, and shows an m lag vector. Δxt=xt−xt−1 is the basis of non-stationary variables xt, and εt is a white noise vector. Rejection of the unit root null hypothesis H0: b=0 against the stationary linear alternative hypothesis H1: b<0 implies that the series is linear mean reverting.
Engle and Granger (1987) demonstrate that the error-correction term must be mean reverting if two underlying assets prices show co-integration. The error correction term reflects short-term deviation from the long-term equilibrium. Accordingly, the error-correction model (ECM) considers non-stationary time series, long-term equilibrium and short-term dynamics for the underlying financial assets. The volatility in the convenience yields is significantly variable for the holders of both spot and futures contracts. In order to capture the volatility behavior, we use error-correction general auto-regression conditional heteroskedasticity (ECM-GARCH).
where α,β are all positive, and volatility in the convenience yields is time-varying. The conditional volatility in the convenience yields follows a GARCH (1,1) process, whereby the conditional volatility at time t depends on the last period's squared innovation ξt−12 and the last period's volatility σt−12. GARCH time-varying variance models are an alternative for modeling the heteroskedasticity often found in time series. The above ECM-GARCH model describes the aggregated behavior of volatility in the convenience yields for CO2 emissions allowances.
Time-series prices for many financial assets often exhibit a leverage effect, and unfavorable information in the financial assets price is associated with higher volatility than favorable information. The spot and futures prices for emissions allowances are determined by many uncertain factors, and the spot and futures prices may exhibit a lead–lag relationship. In order to examine the asymmetry dynamics in the volatility of convenience yields for CO2 emissions allowances, we select the asymmetry ECM-TARCH model by Zakoian (1994) and Glosten et al. (1993).
Asymmetry in conditional variance is introduced through the term ut−12, and the impact of such asymmetries is captured by It. Here It−1 is a dummy variable vector, It−1 is equal to 1 when ξt−1<0, otherwise It−1 is equal to zero when ξt−1≥0. The term γrut−12It−1 in the conditional volatility Eq. (5) is the asymmetric impact term or TARCH term. The term σt2 in the conditional volatility equation depends on the last period's squared residual ξt−12, the last period's conditional volatility σt−12 and the asymmetric impact term γrut−12It−1. From Eq. (5), we propose that volatility in the convenience yields exhibits a shock effect when emissions markets receive favorable and unfavorable information. The convenience yields for CO2 emissions allowances indicate asymmetric effect when γ≠0. When ξt−1>0, the asymmetric impact term It−1=0, favorable information in the emissions allowances markets brings α multiple impacts on the conditional volatility σt2. When ξt−1<0, the asymmetric impact term It−1=1, unfavorable information in the emissions allowances markets brings α+γr multiple impacts on the conditional volatility σt2. If γr>0, the convenience yields for CO2 emissions allowances exhibit a leverage effect, and the last period's asymmetric impact term makes the conditional volatility increase. If γr>0, the last period's asymmetric impact term makes the conditional volatility decrease.
5Empirical results5.1Mean-reversion of the CO2 convenience yieldsIn Table 2, the ADF statistical values in the convenience yields cy1,cy4,cy5 are smaller than the critical value −2.5689 at the 90% confidence level. These show that the time series in the convenience yields cy1,cy4,cy5 are stationary, while the remaining series are non-stationary. Statistic values with first-difference ADF in five convenience yields are far less than the critical value at the 99% confidence level, and the first difference series in five convenience yields are stationary. All estimated b coefficients are significant at the 95% confidence level, and b<0 implies that the convenience yields series exhibit a linear mean-reversion process. The linear mean-reversion property of convenience yields suggests mean reversion to a long-run equilibrium that might change randomly over time. These results of convenience yields are similar to previous results of many scholars, such as the Schwartz (1997), Pindyck (1999), Schwartz and Smith (2000), Cortazar and Schwartz (2003), and Bernard et al. (2008).
The early empirical results show many financial products markets and commodities markets have prices spillover and futures mispricing trends (see Taylor, 2004; Bilson et al., 2005; Mcmillan and Ulku, 2009). Arouri et al. (2012) find that carbon spot and futures have asymmetrical and nonlinear relationships and suggest the usefulness of nonlinear models in pricing and forecasting carbon allowances prices. Our empirical results find that the convenience yields series exhibit a linear mean-reversion process as similar as other financial products markets. A number of complex factors such as political decision, energy prices volatility, stock markets and extraordinary temperature bring about the low efficiency and overreaction in the emissions allowances market (see Zhang and Wei, 2011; Montagnoli and Vries, 2010). These complex markets factors exert greater market prices shock; however, prices shock effectiveness has a tremendous difference in time and channel between emissions allowances spot and futures prices in the immature emissions allowances markets. Current emissions allowances markets are weak effective markets, and they exist in market bias, transaction cost and market overreaction. Unexpected market information will have a different change speeds for spot and futures prices, emissions allowances markets exhibit a lead–lag relationship between spot and futures. Based on the cost of carry theory, the theoretical and actual futures prices have a dynamics market deviation trends. When the above prices deviations are bigger than transaction cost, markets participants can achieve extra arbitrage revenues by adjusting assets portfolio between emissions allowances spot and futures.
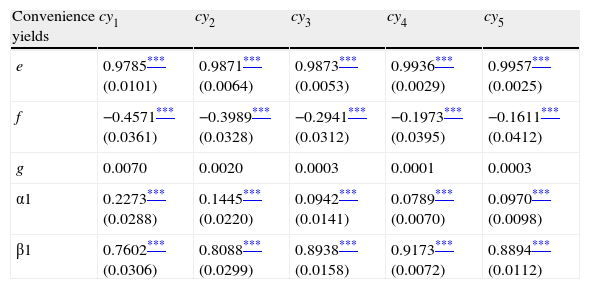
5.2Mean-reversion tests for CO2 convenience yield volatilityTable 3 presents empirical results for CO2 convenience yield volatility using the ECM-GARCH (1,1) model with Gaussian process. Previous convenience yields and error-correction terms are significant factors for current convenience yields at the significance level of 99%, and estimated coefficients slowly increase as time-to-maturity increases. Current convenience yields exhibit a positive correlation with previous convenience yields and a negative correlation with error-correction terms. Estimated coefficients of convenience yields volatility are significant at the significance lever of 99%, so convenience yield volatility exhibits a mean-reversion process. The coefficients of the GARCH model are significant, and the standard errors are approximately equal to 0. These results show that convenience yields for emissions allowances exhibit obvious ARCH effects.
Empirical results of convenience yield volatility using the ECM-GARCH (1,1) model.
| Convenience yields | cy1 | cy2 | cy3 | cy4 | cy5 |
| e | 0.9785*** (0.0101) | 0.9871*** (0.0064) | 0.9873*** (0.0053) | 0.9936*** (0.0029) | 0.9957*** (0.0025) |
| f | −0.4571*** (0.0361) | −0.3989*** (0.0328) | −0.2941*** (0.0312) | −0.1973*** (0.0395) | −0.1611*** (0.0412) |
| g | 0.0070 | 0.0020 | 0.0003 | 0.0001 | 0.0003 |
| α1 | 0.2273*** (0.0288) | 0.1445*** (0.0220) | 0.0942*** (0.0141) | 0.0789*** (0.0070) | 0.0970*** (0.0098) |
| β1 | 0.7602*** (0.0306) | 0.8088*** (0.0299) | 0.8938*** (0.0158) | 0.9173*** (0.0072) | 0.8894*** (0.0112) |
Note: cy1–cy5 denote the convenience yields for CO2 emissions allowances with different maturity from December 2010 to December 2014.
*Significance of the estimated coefficients at the significance levels of 90%. The numbers in parentheses are standard error values.
**Significance of the estimated coefficients at the significance levels of 95%. The numbers in parentheses are standard error values.
Figs. 3 and 4 show convenience yield volatility with different maturity form December 2010 to December 2014. Figs. 3 and 4 show that convenience yield volatility for CO2 emissions allowances exhibits a time-varying trend, especially during the peak time from October 2008 to May 2009. Short-term volatility is almost higher than long-term volatility in convenience yields. Finally, the convenience yield volatility cyv1 increased sharply at the end of its maturity.
 using the ECM-GARCH (1,1) model.")
 using the ECM-GARCH (1,1) model.")
Oh et al. (2008) study the long-term memory in various stock market indices and foreign exchange rates using Detrended Fluctuation Analysis (DFA), and their results imply that the long-term memory property of the volatility time series can be attributed to the volatility clustering observed in the financial time series. All the coefficients α1+β1 are approximately equal to 1. The lower α1 and higher β1 indicate that convenience yields will eventually return to the equilibrium value. However, the volatility of convenience yields will continue for a long time. These results show that the convenience yields for emissions allowances exhibit strong volatility clustering effects which have an obvious persistent property. The above signs indicate that emissions allowances markets are immature enough, so market participants frequently have to take speculative factors into account. As a result, emissions allowances assets exhibit a greater transaction risk. Asymmetric market information exerts the unexpected market scarcity which pushes up the higher volatility of spot and futures prices, so the emissions allowances markets are difficult to eliminate the clustering effects of convenience yields.
In order to achieve market arbitrage, market participants optimize their assets portfolio policies between spot and futures using the clustering effects of convenience yields. Wang et al. (2012) find that convenience yields have a significant call and put options feature, and market participants achieve distinct options values by flexibly adjusting assets portfolio policies between spot and futures. Our empirical results show that the convenience yields have obvious time-varying trends and clustering effects. The overreaction of emissions allowances markets brings markets participant about many arbitrage opportunities, so short-term market speculations are active. When convenience yields are positive, the convenience yields are call options, and market participants make assets portfolio policy of holding spot contracts while selling futures contracts. When convenience yields are negative, the convenience yields are put options, and market participants make assets portfolio policy of holding futures contracts while selling spot contracts. The above assets exchange policies can achieve extra arbitrage revenues.
5.3Asymmetric behavior of CO2 convenience yield volatilityDaal et al. (2007) propose asymmetric GARCH-Jump models that synthesize autoregressive jump intensities and volatility feedback in the jump component, and then capture several distinguishing features such as more volatility persistence, less leverage effects. Yamamoto (2010) documents the empirical research on asymmetric volatility and volatility clustering in stock markets, and the empirical results show that herding matters for volatility clustering while a borrowing constraint intensifies the asymmetry of volatility through the herding effect.
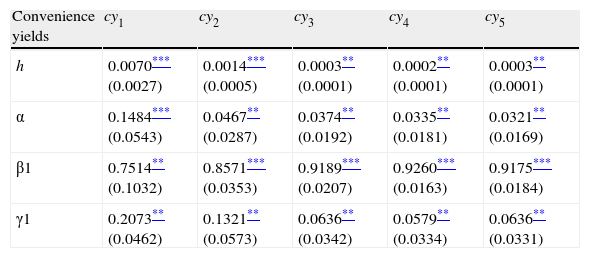
All the estimated coefficients in Eq. (5) are significant at the 95% confidence level, and all the standard errors are minor. The conditional volatility in the CO2 convenience yields mainly depends on the last period's residual errors, the asymmetric impact term and the last period's conditional volatility. Especially favorable and unfavorable market information has an asymmetric impact on the conditional volatility. In Table 4, all the γ1 coefficients of asymmetric terms are obviously bigger than zero, the convenience yield volatility (cyv) has an obvious leverage effect, so the convenience yield volatility exhibits asymmetric dynamics. Positive γ1 coefficients show that asymmetric leverage effects increase the convenience yield volatility. Take cyv1 for example, when emissions allowances markets receive favorable information, ξt−1≥0, and these favorable information brings 0.1484 times impacts on the cyv1. When emissions allowances markets receive unfavorable information, ξt−1<0, these unfavorable information brings cyv1 an impact of 0.3557 times. Unfavorable market information has a higher impact on convenience yield volatility. Estimated γ1 coefficients of cyv1–cyv4 decline with an increase in time-to-maturity, and unfavorable market information has a lower impact on the long-term volatility of convenience yields.
Empirical results for convenience yield volatility using the ECM-TARCH (1,1) model.
| Convenience yields | cy1 | cy2 | cy3 | cy4 | cy5 |
| h | 0.0070*** (0.0027) | 0.0014*** (0.0005) | 0.0003** (0.0001) | 0.0002** (0.0001) | 0.0003** (0.0001) |
| α | 0.1484*** (0.0543) | 0.0467** (0.0287) | 0.0374** (0.0192) | 0.0335** (0.0181) | 0.0321** (0.0169) |
| β1 | 0.7514** (0.1032) | 0.8571*** (0.0353) | 0.9189*** (0.0207) | 0.9260*** (0.0163) | 0.9175*** (0.0184) |
| γ1 | 0.2073** (0.0462) | 0.1321** (0.0573) | 0.0636** (0.0342) | 0.0579** (0.0334) | 0.0636** (0.0331) |
The complex factors such as Strict quota allocation rules and regulation policies of carbon emissions, long-term dependency of fossil energy and extreme temperature are favorable market information, the complex factors such as negotiation failure of global greenhouse emissions, fossil energy prices volatility, developing block in low-carbon technology are unfavorable market information. The favorable market push spot and futures prices upwards, increasing speeds of spot prices are higher than futures prices. The unfavorable market information brings about greater pessimistic demands in the weak effective emissions markets. The pessimistic overreaction in spot and futures prices push the greater convenience yields volatility, and then distort convenience yields of emissions allowances. Based on the higher degree of liquidity in the spot market relative to the futures market, these pessimism overreactions have more quick transition speed of spot prices relative to futures prices. The higher convenience yield volatility brings market hedgers about the greater arbitrage returns through adjusting assets portfolio between spot and futures, so these uncertain factors promote more rampant speculation. In summary, favorable and unfavorable market information has an asymmetric impact on the convenience yield volatility.
6ConclusionCO2 emissions allowances markets in the EU ETS are emerging financial markets. Previous results show that mean-reverting convenience yields are central to forecasting commodity prices and estimating hedging returns. Based on the simple cost-of-carry model, we examine the properties of convenience yields for CO2 emissions allowances futures contracts with different maturities from December 2010 to December 2014. We find that the convenience yields for CO2 emissions allowances exhibit a time-varying trend, and standard deviation in the convenience yields declines with an increase in time-to-maturity. All skewnesses and kurtoses show that convenience yields exhibit left-skewed and leptoturtossis distribution trends.
We test mean-reversion and volatility in the stochastic convenience yields for CO2 emissions allowances by using the ADF, ECM-GARCH and ECM-TARCH models. Empirical results from the ADF tests show that all estimated b coefficients are significant at the 95% confidence level, and b<0 implies that all the convenience yields follow a linear mean-reverting process. Empirical results from the ECM-GARCH (1,1) model show that the last period's convenience yields and error correction terms significantly affect current convenience yields, and that convenience yield volatility exhibits a mean-reversion process. We also detect that convenience yield volatility exhibits asymmetric dynamics by using the ECM-TARCH (1,1) model. Asymmetric leverage effects increase volatility, unfavorable market information has a greater impact on volatility than favorable market information, and unfavorable market information has a lower effect on long-term volatility in convenience yields.
The leaner mean-reversion property and asymmetric volatility of convenience yields provides much enlightenment for government regulators. Effective macro-control and macro-regulation is necessary to improve markets efficiency in the emissions allowances markets. Macro-controlling failure, uncertain decision and inactive trading volumes have significant impacts on the leaner mean-reversion phenomenon and asymmetric volatility of convenience yields. Government regulators should strengthen international governments’ operation and communication, establish scientific emissions reduction plan and strict emissions quota allocation rules. EU Government should make consistent and systematic decision in the greenhouse emissions reduction, support regime-switching behaviors among different emissions markets, and strengthen international cooperation in the greenhouse emissions reduction. EU government should present an international information network system of emissions trading markets, market participants timely capture demand and supply information, motoring and checking emissions reduction information, etc., and they can achieve fair, transparent and symmetric emissions markets.
Emissions investors, hedgers, arbitragers should be aware of risk reduction between emissions allowances spot and futures, regime switches and threshold effects when attempting to forecast both spot and futures prices. Market participants can flexibly adjust their assets portfolio trading policies between spot and futures and then achieve additional arbitrage returns by using the convenience yields. An active hedging strategy involving spot and futures markets seems to be of interest in asymmetric leverage effects of convenience yield volatility in order to protect against unfavorable movements in emissions allowances assets prices.
Our empirical results help market participants to capture the optimal hedge ratios and adjust portfolio sizes between spot and futures, so market participants can enhance their risk management capabilities for emissions allowances. Future research on emissions allowances should analyze the term structure of convenience yields, construct optimal hedge ratios by using convenience yields, and address GARCH option pricing for emissions allowances.

