


We study the determinants of flows and their impact on managers’ abilities in UK conventional and socially responsible (SR) pension funds. We examine three aspects barely documented in pension funds. First, flows may be affected by the fact that pension fund investors are restricted because they cannot disinvest until retirement, although they can switch the investment to another fund. Second, as both pension funds and SR funds are concerned with social welfare, SR pension funds present a special social interest and possibly different behavior. Third, the influence of flows on style timing abilities, as far as we are aware, has not been studied before. Our results indicate that both pension funds experience greater flows when they are younger and smaller, and have received flows in the past. Managers present negative stock-picking and poor timing abilities, independently of flows.
The pension fund industry is a market segment of first-order economic importance and significant for society as a whole. The worldwide pension fund investment has experienced significant expansion over the past two decades. With an average annual growth rate of 8.1% over the period 2008–2014, the total pension assets amounted to more than $25.2 trillion in 2014 (OECD, 2015).
Pension funds are investment products with a specific purpose: to save for retirement. Nonetheless, the pension fund investment is subject to some constraints. Specifically, members cannot disinvest until retirement or under certain circumstances (illness, death…), and are able to move the investments from one fund to another, although supporting some charges and being able to lose additional benefits, like life insurance coverage. These constraints affect pension investor behavior, especially with regard to money flows, which impact on management and, ultimately, on retirement incomes. While extensive research has been conducted on mutual fund flows, finding a convex relationship between performance and subsequent net flows (Ippolito, 1992; Sirri and Tufano, 1998; Del Guercio and Tkac, 2002, among others), relatively little research has been conducted on the determinants of pension fund flows. The relative lack of research provides us with an opportunity for a richer understanding of the pension fund investor behavior.
Both mutual and pension funds are investment vehicles, professionally managed, and formed by the resources invested by a set of different investors; however, while mutual funds are a channel for retail investors to participate in capital markets (their sole purpose is to profit), pension funds are designed to cover the retirement needs of individual investors. As a consequence, pension funds are long-term investments that are expected to generate stable growth over time, and provide pension incomes when investors retire. Furthermore, mutual funds and pension funds usually present different tax treatments and different disinvestment restrictions.
The existing differences between both products originate different management strategies and manager behavior. Del Guercio and Tkac (2002) find lack of convexity in the flow-performance relation in pension funds because pension fund managers have little incentive to engage in the same risk-shifting behavior as mutual funds. On the other hand, Sialm et al. (2015) point out that retirement plan participants rarely adjust their portfolio allocations. Subsequently, whether pension fund investors cannot disinvest, and are reluctant to move the investments (the selecting process of a new fund needs time and resources), the relation between pension flows and performance may not be convex. Additionally, although managers usually change investment strategies in order to attract inflows and minimize outflows, the long-term nature of pension funds may produce that pension fund managers are less affected by flow movements.
On the other hand, pension fund flows can also be influenced by fund characteristics (size, age, past flows…) because most of the pension investors are not professional investors and their investment decisions are guided by available public information (Renneboog et al., 2011), which is commonly related to fund characteristics.
In this paper we first examine the determinants of pension fund flows in UK conventional and social responsible (SR) domestic equity pension funds. The limited studies outside the US market, lend support for our analysis of the UK pension fund industry. The UK pension fund market deserves academic and professional attention because is the second worldwide pension fund industry with an investment of $2.68 trillion in 2014 (OECD, 2015), and represents more than 10.8% of the OECD pension fund market. This remarkably size has been primarily motivated by the low public pensions, which has enhanced private initiative. In particular, pension funds are the main savings vehicle, and 49.8% of the household savings were invested in pension funds and insurances in 2014 (INVERCO, 2015). This apparent active participation of the private investors is an important factor in our study because UK pension fund investors can be more prone to move their investments whether pension funds do not produce the desired results.
We also differentiate between conventional and social responsible (SR) pension funds because while conventional pension funds are focus on the traditional risk-return portfolio management, SR funds invest in companies that are social responsible with the environment, the human rights or the labor relations, and avoid investing in companies that may cause health hazards (alcohol, tobacco, gambling…) and exploit employees. As a consequence, SR management does not only focus on financial aspects. The UK is one of the most advanced countries in social responsible investment, but SR pension funds are still developing, and only represent 0.89% of the assets. The analysis of the SR pension funds is especially interesting because SR pension managers may be overly concentrated on non-financial matters (SR aspects and retirement social welfare), and flows may not influence management. Prior evidence on SR mutual funds already shows that SR funds focus on nonfinancial attributes and are less concern with results, affecting the flow-return relationship (Renneboog et al., 2011).
Finally, we analyze the flows influence on timing abilities; the latter aspect, as far as we are aware, has not been examined previously on pension funds. Specifically, we study whether managers develop or improve their abilities to attract more flows and minimize outflows, which will depend on the investor behavior to past results.
Our results confirm a distinct pension investor behavior. First, past return does not influence pension flows, and fund characteristics do. This evidence shows that pension investors (conventional and SR) are influenced by the long-term nature of pension funds and the disinvestment boundaries. On the contrary, investors choose funds that receive more flows, suggesting that they invest in funds that they already own, and that they just invest in the chosen fund for retirement. Furthermore, we find negative timing abilities, and managers do not consider money flows to improve their abilities. Therefore, the lack of investor reaction to past results produces that pension fund managers do not take into account flows either.
The rest of the paper proceeds as follows. In Section 2, we undertake a literature review. Section 3 presents our methodology. In Section 4, we give a brief description of the UK pension fund market, and we describe the data. Section 5 contains our empirical results, and Section 6 presents our main conclusions.
2Literature reviewThe financial literature focuses primarily on the study of mutual fund flows, and the evidence shows that investors tend to move their money according to past results (Capon et al., 1996; Johnson, 2010). Specifically, funds with good performance received additional flows, increasing manager compensation (Chevalier and Ellison, 1997; Sirri and Tufano, 1998; Busse, 2001; Del Guercio and Tkac, 2002), but funds with poor results do not experience the equivalent outflows, existing, in general, an asymmetric relationship (Ippolito, 1992; Sirri and Tufano, 1998; Del Guercio and Tkac, 2002). In contrast, Del Guercio and Tkac (2002) do not find evidence of this asymmetric relation in pension funds. These authors observe that pension fund managers do not depend on the performance relative to their peers, as mutual fund managers, and they do not have strong incentives to engage in risk-shifting strategies over time. James and Karceski (2006) point out that the asymmetric relation depends on the kind of fund; specifically, they find that institutional investors do not chase past performance in the same way as retail investors do. Sialm et al. (2015) find that US defined contribution pension plan investors rarely adjust their portfolio allocations, suggesting that flows are sticky and not discerning. Consequently, whether the long-term nature of pension funds provokes that investors do not monitor the investments closely, we will then expect less sensitive of flows to past return.
On the other hand, SR mutual fund evidence shows that these funds are more sensitive to past positive returns, but less sensitive to past negative returns, compared to their conventional counterparts (Bollen, 2007). Benson and Humphrey (2008) find that US SR fund flows are less sensitive to returns than conventional funds, and the impact of lagged flows on current flows is significantly greater for SR funds, suggesting that SR investors are more likely to invest in a fund that they already own. Renneboog et al. (2011) examine conventional and SR mutual funds from several countries, concluding that investors follow past returns. The absence of SR pension fund studies does not allow us to contrast our results with prior evidence, but we hypothesize that whether the non-financial targets are the most relevant aspects in investment decisions, and SR pension fund investors do not monitor their portfolios, as conventional pension investors, we then expect even lower link between flows and return.
Flows are a consequence of investor reactions and can impact on management behavior (Benson and Humphrey, 2008). Management behavior has been traditionally assessed by the stock-picking and timing abilities. The stock-picking ability is the manager's skill to pick stocks that outperform others at the same level of non-diversifiable risk. The timing ability is the skill to obtain results by changing exposure to the market (market timing) or to a management style (style timing) at the right moment. The most widely-used models to capture these abilities are those proposed by Treynor and Mazuy (1966) and Merton and Henriksson (1981). Empirical evidence shows mixed evidence of these abilities. Coggin et al. (1993) find positive stock-picking and negative market timing abilities in US pension funds, respectively. Blake et al. (1999) find negative evidence of both abilities in UK pension funds. Thomas and Tonks (2001) find positive stock-picking and size-timing abilities, but negative market timing in UK pension funds from 1983 to 1997. Other authors find a general absence of these abilities, as Koh et al. (2010) on Singapore pension funds, and Woodward and Brooks (2010) on Australian pension funds. The study of timing abilities in SR pension funds barely exists. Ferruz et al. (2010) find little positive stock-picking ability in SR pension funds, but negative market timing in conventional and SR funds.
Nonetheless, these traditional models do not take into account the influence of flows, so the spurious timing found in many studies (Lee, 1999; Fung et al., 2002; Abdel-Kader and Qing, 2007; Woodward and Brooks, 2010; Elton et al., 2012; Christensen, 2013) could be solved by including the influence of cash-flows in timing models, according to Warther (1995), Ferson and Warther (1996), and Edelen (1999). Edelen (1999) and Alda et al. (2015) control the effect of flows on market timing in US mutual funds, and demonstrate that the tendency of managers to time negatively is not attributable to the realized flows at the fund. We find a lack of research into the influence of flows on pension fund manager abilities; however, we expect that pension fund manager skills will only be affected by flows (developing skills that attract inflows and minimize outflows), whether investors react to past results.
3Methodology3.1Determinants of fund flows: the flow-return relationshipThe most extensive measure of fund flows is proposed by Sirri and Tufano (1998), according to whom fund flows are defined as the net growth in fund assets beyond asset appreciation. Formally, it is expressed as follows:
where Fi,t is the fund flow, and reflects the percentage growth of fund i at time t in excess of the growth that would have occurred if there were no new inflows, and all dividends had been reinvested. TNAi,t and TNAi,t−1 are the total net assets for fund i at the end of time t and t−1. Ri,t is the fund's return at time t. This measure assumes that all flows occur at the end of the period, in our case, the month.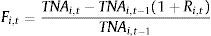
The existing literature finds that fund flows are influenced primarily by past performance and past flows; however, fund characteristics (age, size, volatility…) are also important because individual investors, such as pension fund clientele, can easily access to this information through newspapers, financial websites and specialized data providers (Renneboog et al., 2011). Consequently, we consider as determinants of the pension fund flows: the historical returns, the lagged flows, and three fund characteristics (fund age, fund size, and fund return volatility), as control variables. Additionally, in order to study the existence of the convexity relationship between flows and past return, we introduce dummy variables that distinguish between positive and negative returns.
where Fit is the flow of fund i in month t, Returni,[t−1,t−12] is the average Carhart-adjusted return of fund i over the months t−1 to t−12. R+ and R− are indicator variables that equal 1 if the average return is non-negative or negative, respectively. Fi,t−1 is the monthly lagged flow of fund i at time t−1; A is the age of fund i at time t−1, calculated as the logarithm of age in months; S is the size of fund i at time t−1, calculated as the logarithm of TNAi,t−1; and rv is the return volatility of fund i at time t−1, computed as the standard deviation of returns over twelve-month rolling windows.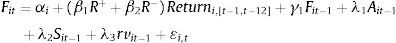
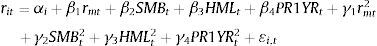
In order to avoid possible endogeneity problems in model (2) between flows and returns (returns can impact flows, and flows can also impact returns, because a large inflow in t will increase the cash balance in the current month, or a large outflow in t may result in forced liquidation of stock), flows refer to time t and returns from t−1 to t−12. Furthermore, to estimate model (2), we apply a two-stage GMM estimation (Generalized Method of Moments), estimating in the first stage the adjusted return of the fund with the Carhart (1997) model:
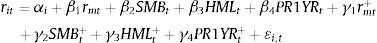
where ri,t is the excess return of fund i at time t over the risk-free asset; rm,t is the excess return of a representative market index over the risk-free asset; SMBt is the size factor; HMLt is the book-to-market factor, and PR1YRt is the momentum factor.3.2Traditional timing models
A variety of models have been used in the financial literature to identify stock-picking and market timing abilities. Two of the most widely used are proposed by Treynor and Mazuy (1966) and Merton and Henriksson (1981).
The Treynor and Mazuy (1966) model (TM henceforth) is expressed as follows:
where ri,t=Ri,t−Rf,t, is the excess return of fund i over the risk-free asset f during the period t; rm,t=Rm,t−Rf,t is the excess market return over the risk-free asset f during the period t; αi represents the stock-picking ability of the manager (hence, a significantly positive alpha indicates correct stock-picking); and γi determines the market timing skill; therefore, if the gamma is positive and significant, the manager has market timing ability, but if it is negative and significant, the manager's ability is perverse. εi,t is the error term.
The Merton and Henriksson (1981) model (MH henceforth) is as follows:
where ri,t=Ri,t−Rf,t, and rm,t=Rm,t−Rf,t are the excess returns of fund i and the market return over the risk-free asset f during period t, respectively; αi represents the stock-picking ability of the manager; γi measures the market timing ability; [rm,t]+=max[0,rm,t] is the payment of an option over the market portfolio with a strike price that is the same as the risk-free asset, and εi,t is the error term.3.3Style timing models: multifactorial timing versions
Active management requires a detailed supervision of the portfolio securities, so managers usually focus on specific market segments, resulting in the investment styles of the fund. As a consequence, managers may develop timing abilities with regard to these styles. In order to measure style timing abilities, Lu (2005)1 proposes an extension of the TM model, taking into account the four-factor Carhart (1997) model, and the work of Bollen and Busse (2001), obtaining the multifactorial TM version:
This model assesses whether a fund manager increases (decreases) the fund risk exposure to a specific factor, prior to the factor index increase (decrease); then the fund return will be a convex function of the factor index return. If any of the gamma coefficients is positive, it indicates timing ability with regard to this management style; that is to say, managers are increasing the importance of the stocks in that style to increase the performance of the portfolio.
In the same way, the Merton and Henriksson (1981) model may be extended to capture style timing abilities, originating the multifactorial MH model:
In this model, if any of the gamma coefficients is positive, it indicates timing ability with regard to that management style; that is to say, timing with respect to the market (γ1), size (γ2), book-to-market (γ3) and momentum (γ4) factors.
3.4The influence of flows on traditional timing modelsFlows are consequences of investor reactions, so these movements may be accompanied by changes in management behavior; that is to say, managers may take into account the outflows as a cue to improve their abilities, and inflows as a reward for their management. Nevertheless, traditional and multifactorial timing models do not consider the influence of flows, and may provide biased timing coefficients, as Warther (1995), Ferson and Warther (1996), and Edelen (1999) explain. Following Edelen (1999), we include flows in traditional timing models, and obtain new versions of TM and MH models2:
where r˜i,t is the excess return of fund i; r˜mt is the excess return of the market; X˜mt is the market timing regressor (it is either r˜mt2 in the TM model or [r˜mt]+=max(0,r˜mt) in the MH model); Fit are the fund flows; γ2 captures the market timing ability, and γ2 captures the effect of net flows on market timing ability. Thus, γ1 measures the true market timing ability of the manager.3.5Flows influence on multifactorial timing models
To capture the influence of flows on style timing abilities, we develop model (9):
where SMB˜t,HML˜t and PR1YR˜t are the style timing factors – they are either SMB˜t2, HML˜t2 and PR1YR˜t2 in the TM version, or [SMB˜mt]+=max(0,SMB˜mt), [HML˜mt]+=max(0,HML˜mt) and [PR1YR˜mt]+=max(0,PR1YR˜mt) in the MH version. γ1, γ2, γ3 and γ4 capture timing abilities with regard to the market, size, book-to-market, and momentum factors. γ5, γ6, γ7 and γ8 are the interactive terms that consider the influence of flows in timing abilities.4Pension funds in UK and data4.1Pension fund market in UK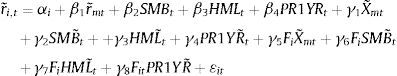
The UK pension fund market is one of the most developed in the world, exceeded only by the United States, with a superior asset value to $2.68 trillion in 2014 (OECD, 2015), which represents 96% of the GDP. One reason for this expansion has been the low levels of state pensions until the mid-1990s; however, although state pensions increased from then on, investment in private pensions continues to experience strong growth.
Pension benefits in the UK can be taken for retirement (the retirement age is 65 for men and 62.5 for women in 2014), although, under tax rules, the earliest age to recover the investment is 55 years. Additionally, many pension scheme rules usually set an age between 60 and 65 years old. The exceptions to this rule are for ill health, death, and whether before 6 April 2006, beneficiaries had the right under the pension scheme to take the pension before age 55.
The UK is one of the leading SR markets (more than €1.175 trillion in 2011; UKSIF, 2011), and was the first country to regulate the disclosure of social, environmental, and ethical investment policies of pension funds and charities in 2000 (Amendment to the 1995 Pensions Act), requiring the trustees of occupational pension funds to disclose in the Statement of Investment Principles “the extent (if at all) to which social, environmental, and ethical considerations are taken into account in the selection, retention and realization of investments”. This regulation contributed considerably to the growth of the SR industry, leading to a progressive awareness of their importance; nonetheless, as Keohane and Rowell (2015) point, the SR practices in pension funds are still emerging in the UK, and market and policy interventions are necessary to introduce social pension funds as a new segment of the pensions market (pension fund net SR assets represent only 0.89% of the overall pension fund net assets – UKSIF, 2011).
4.2DataThe pension fund data is obtained from Thomson Reuters, whose database contains the monthly returns and monthly TNA (Total Net Assets) of all domestic equity pension funds in the UK, both conventional and SR,3 from January 1994 to September 2012.
We require that the pension funds included in our sample present data for at least 24 months, to ensure the consistency of the analyses. Our sample is free of survivorship bias because all pension funds that existed for a period of at least 24 months within the time frame considered have been taken into account, regardless of whether or not they survived until September 2012. Following the procedure of Chevalier and Ellison (1997) and Bollen (2007), to include an observation of fund flow, it must be from a fund with at least €10,000,000 of total net assets in two successive months. This eliminates extremely small funds, which may distort the results. Our final sample contains 3493 conventional pension funds and 176 SR pension funds. We also remove the observations of fund flows beyond the 99.5th percentile or below the 0.5th percentile to reduce the effect of outliers, following Barber et al. (2005), Bollen (2007), and Renneboog et al. (2011).
The proxy of the risk-free asset employed is the three-month UK Treasury Bill, and our proxy of the market is the FT All-Share Index. Additionally, the three style factors used (size, book-to-market, and momentum) are the UK domestic factors developed by Gregory et al. (2013).4
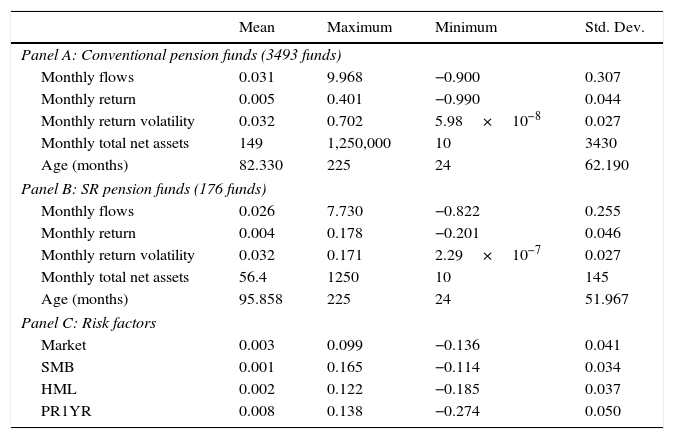
The descriptive statistics of the sample are presented in Table 1, divided into three panels. Panels A and B show the main statistics (mean, maximum, minimum, and standard deviation) of monthly flows, return, return volatility, TNA (Total Net Assets in millions of Euros) and age (in months) for conventional and SR pension funds, respectively. Panel C presents the same statistics for the risk factors used: market, size, book-to-market, and momentum. We observe that the monthly flows, return, TNA, and age are all greater in the conventional funds. This could produce different results between SR and conventional funds; such as, more stable flows in SR funds. The return of conventional and SR pension funds is greater than the risk factor return.
Summary statistics.
| Mean | Maximum | Minimum | Std. Dev. | |
|---|---|---|---|---|
| Panel A: Conventional pension funds (3493 funds) | ||||
| Monthly flows | 0.031 | 9.968 | −0.900 | 0.307 |
| Monthly return | 0.005 | 0.401 | −0.990 | 0.044 |
| Monthly return volatility | 0.032 | 0.702 | 5.98×10⁻⁸ | 0.027 |
| Monthly total net assets | 149 | 1,250,000 | 10 | 3430 |
| Age (months) | 82.330 | 225 | 24 | 62.190 |
| Panel B: SR pension funds (176 funds) | ||||
| Monthly flows | 0.026 | 7.730 | −0.822 | 0.255 |
| Monthly return | 0.004 | 0.178 | −0.201 | 0.046 |
| Monthly return volatility | 0.032 | 0.171 | 2.29×10⁻⁷ | 0.027 |
| Monthly total net assets | 56.4 | 1250 | 10 | 145 |
| Age (months) | 95.858 | 225 | 24 | 51.967 |
| Panel C: Risk factors | ||||
| Market | 0.003 | 0.099 | −0.136 | 0.041 |
| SMB | 0.001 | 0.165 | −0.114 | 0.034 |
| HML | 0.002 | 0.122 | −0.185 | 0.037 |
| PR1YR | 0.008 | 0.138 | −0.274 | 0.050 |
This table shows the summary statistics (mean, maximum, minimum, and standard deviation) for conventional (Panel A) and SR pension funds (Panel B), and for the monthly return of the risk factors (Panel C). Panels A and B collect the statistics of monthly flows, return, return volatility, total net assets (in millions of Euros) and age (in months) for conventional and SR pension funds, respectively. The risk factors included in panel C are: market return (market), size (SMB), book-to-market (HML) and momentum (PR1YR).
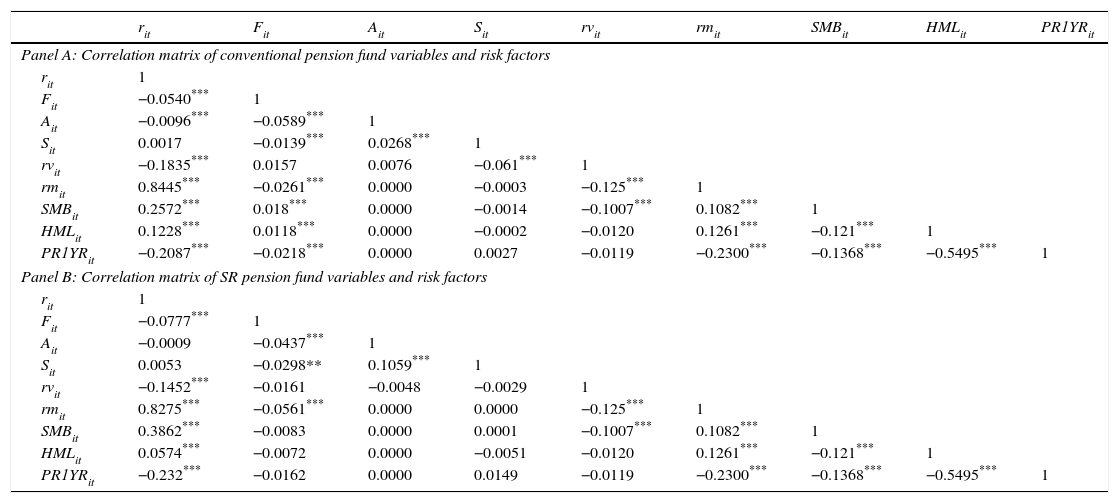
Table 2 shows the correlation coefficients between the pension fund variables and the risk factors for conventional (panel A) and SR (panel B) pension funds. The significant coefficients are small (in absolute value, the coefficients are no greater than 50%); except the correlations between the market factor and the pension fund returns, which are 0.8445 and 0.8275 for conventional and SR pension funds, respectively. However, this indicates that we chose an appropriate market index for our study; therefore, given these results, we assume there will be no further multi-collinearity problems.
Correlation matrices.
| rit | Fit | Ait | Sit | rvit | rmit | SMBit | HMLit | PR1YRit | |
|---|---|---|---|---|---|---|---|---|---|
| Panel A: Correlation matrix of conventional pension fund variables and risk factors | |||||||||
| rit | 1 | ||||||||
| Fit | −0.0540*** | 1 | |||||||
| Ait | −0.0096*** | −0.0589*** | 1 | ||||||
| Sit | 0.0017 | −0.0139*** | 0.0268*** | 1 | |||||
| rvit | −0.1835*** | 0.0157 | 0.0076 | −0.061*** | 1 | ||||
| rmit | 0.8445*** | −0.0261*** | 0.0000 | −0.0003 | −0.125*** | 1 | |||
| SMBit | 0.2572*** | 0.018*** | 0.0000 | −0.0014 | −0.1007*** | 0.1082*** | 1 | ||
| HMLit | 0.1228*** | 0.0118*** | 0.0000 | −0.0002 | −0.0120 | 0.1261*** | −0.121*** | 1 | |
| PR1YRit | −0.2087*** | −0.0218*** | 0.0000 | 0.0027 | −0.0119 | −0.2300*** | −0.1368*** | −0.5495*** | 1 |
| Panel B: Correlation matrix of SR pension fund variables and risk factors | |||||||||
| rit | 1 | ||||||||
| Fit | −0.0777*** | 1 | |||||||
| Ait | −0.0009 | −0.0437*** | 1 | ||||||
| Sit | 0.0053 | −0.0298** | 0.1059*** | 1 | |||||
| rvit | −0.1452*** | −0.0161 | −0.0048 | −0.0029 | 1 | ||||
| rmit | 0.8275*** | −0.0561*** | 0.0000 | 0.0000 | −0.125*** | 1 | |||
| SMBit | 0.3862*** | −0.0083 | 0.0000 | 0.0001 | −0.1007*** | 0.1082*** | 1 | ||
| HMLit | 0.0574*** | −0.0072 | 0.0000 | −0.0051 | −0.0120 | 0.1261*** | −0.121*** | 1 | |
| PR1YRit | −0.232*** | −0.0162 | 0.0000 | 0.0149 | −0.0119 | −0.2300*** | −0.1368*** | −0.5495*** | 1 |
This table is divided into two panels and shows the correlation matrices between pension fund variables (rit, Fit, Ait, Sit, rvit) and the risk factors (market return – rm, size – SMB, book-to-market – HML, momentum – PR1YR). Panel A displays the correlations between conventional pension fund variables and risk factors, and panel B between SR pension fund variables and risk factors.
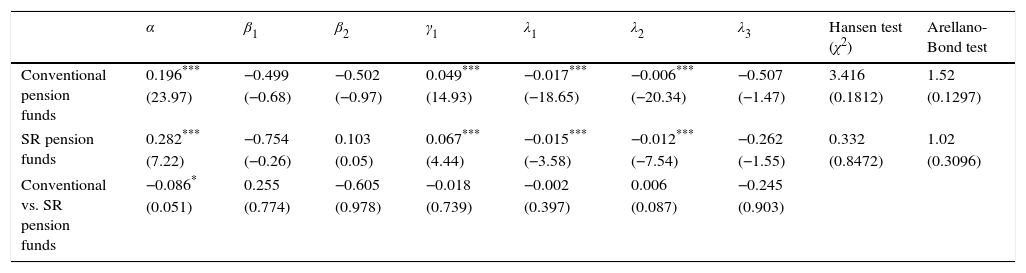
We examine the flow determinants of pension funds applying model (2) with the two-step GMM estimation. Table 3 presents the results of model (2), and a mean difference test, in order to determine whether the observed differences between conventional and SR funds are significant (Bollen, 2007).
Determinants of pension fund flows.
| α | β1 | β2 | γ1 | λ1 | λ2 | λ3 | Hansen test (χ2) | Arellano-Bond test | |
|---|---|---|---|---|---|---|---|---|---|
| Conventional pension funds | 0.196*** | −0.499 | −0.502 | 0.049*** | −0.017*** | −0.006*** | −0.507 | 3.416 | 1.52 |
| (23.97) | (−0.68) | (−0.97) | (14.93) | (−18.65) | (−20.34) | (−1.47) | (0.1812) | (0.1297) | |
| SR pension funds | 0.282*** | −0.754 | 0.103 | 0.067*** | −0.015*** | −0.012*** | −0.262 | 0.332 | 1.02 |
| (7.22) | (−0.26) | (0.05) | (4.44) | (−3.58) | (−7.54) | (−1.55) | (0.8472) | (0.3096) | |
| Conventional vs. SR pension funds | −0.086* | 0.255 | −0.605 | −0.018 | −0.002 | 0.006 | −0.245 | ||
| (0.051) | (0.774) | (0.978) | (0.739) | (0.397) | (0.087) | (0.903) | |||
This table presents the results from the two-staged GMM estimation of model (2) for conventional (Conv. funds) and SR pension funds, where: α is the intercept, β1 and β2 measure the sensitivity of flows to positive and negative historical returns, respectively; γ1 measures the sensitivity of flows to flows lagged one month; λ1 measures the sensitivity of flows to fund age at time t−1; λ2 measures the sensitivity of flows to fund size at time t−1; λ3 measures the sensitivity of flows to return volatility fund at time t−1. The table also reports the chi-squared of the Hansen test, and the second-order correlation Arellano-Bond test; in this case, p-values are in parentheses. The differences in the estimates between conventional and SR pension funds (conventional vs. SR pension funds) and their p-values (in parentheses) are in the last two rows.
In the first place, we check the validity of the instruments with the Hansen test. The null hypothesis of the test is that the instruments are valid; that is, they are uncorrelated with the error term, and the excluded instruments are correctly excluded from the estimated equation. The chi-squared test results (3.42 and 0.33 in conventional and SR fund models, respectively) do not allow us to reject the null hypothesis, so we confirm the validity of the instruments. We also carry out the second-order correlation Arellano-Bond test. The results show absence of autocorrelation problems; specifically, the tests (1.52 and 1.02 in the conventional and SR fund models) indicate that we cannot reject the no autocorrelation null hypothesis, so we do not find correlation problems (we do not report the first-order correlation results, but we do not reject the null hypothesis either).
Our results show that conventional and SR pension fund investors do not focus on past return, positive or negative (β1 and β2 are not significant), confirming our initial hypothesis that pension fund investors present a long-term investment behavior, and their main purpose is to save for retirement, independently of past results. This result is consistent with prior evidence, which shows that pension investors do not reallocate resources with the same frequency as return results (Sialm et al., 2015). The lack of a flow-return relationship suggests that pension fund investors do not chase past return because they have to deal with possible transferring restrictions, and moving investment decisions takes time and resources, so pension fund investors have different investment preferences than mutual fund investors.
The results also show that conventional and SR investors allocate resources when a fund received inflows in the past (γ1 are significantly positive). This shows that investors reinvest in funds that they already own. Our results are not significantly different between conventional and SR pension funds, contrary to SR mutual fund evidence (Benson and Humphrey, 2008), and demonstrating the prevalence of the pension fund nature; that is to say, investors continue saving for retirement in the pension fund chosen for that purpose. Additionally, younger and smaller funds receive more flows (significantly negative age and size coefficients), possibly because these funds are more innovative, flexible, and exert a more aggressive marketing approach. The volatility (λ3) is not a significant factor because investors pursue long-term savings and have divestment limitations.
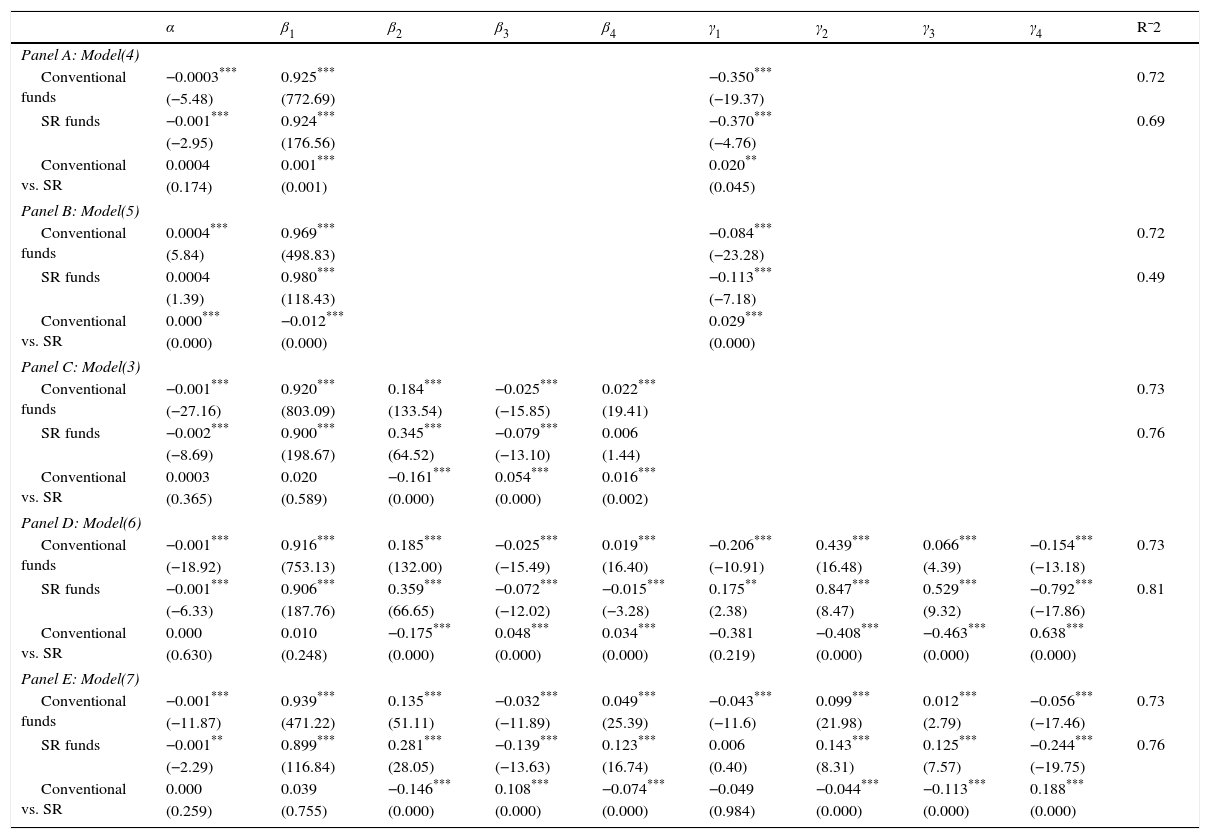
5.2Results of traditional and multifactorial timing modelsIn this section we analyze the abilities of pension fund managers (stock-picking, market and style timing) with traditional and multifactorial models. The results are collected in Table 4.
Results of the TM, MH, Carhart and style timing models.
| α | β1 | β2 | β3 | β4 | γ1 | γ2 | γ3 | γ4 | R¯2 | |
|---|---|---|---|---|---|---|---|---|---|---|
| Panel A: Model(4) | ||||||||||
| Conventional funds | −0.0003*** | 0.925*** | −0.350*** | 0.72 | ||||||
| (−5.48) | (772.69) | (−19.37) | ||||||||
| SR funds | −0.001*** | 0.924*** | −0.370*** | 0.69 | ||||||
| (−2.95) | (176.56) | (−4.76) | ||||||||
| Conventional vs. SR | 0.0004 | 0.001*** | 0.020** | |||||||
| (0.174) | (0.001) | (0.045) | ||||||||
| Panel B: Model(5) | ||||||||||
| Conventional funds | 0.0004*** | 0.969*** | −0.084*** | 0.72 | ||||||
| (5.84) | (498.83) | (−23.28) | ||||||||
| SR funds | 0.0004 | 0.980*** | −0.113*** | 0.49 | ||||||
| (1.39) | (118.43) | (−7.18) | ||||||||
| Conventional vs. SR | 0.000*** | −0.012*** | 0.029*** | |||||||
| (0.000) | (0.000) | (0.000) | ||||||||
| Panel C: Model(3) | ||||||||||
| Conventional funds | −0.001*** | 0.920*** | 0.184*** | −0.025*** | 0.022*** | 0.73 | ||||
| (−27.16) | (803.09) | (133.54) | (−15.85) | (19.41) | ||||||
| SR funds | −0.002*** | 0.900*** | 0.345*** | −0.079*** | 0.006 | 0.76 | ||||
| (−8.69) | (198.67) | (64.52) | (−13.10) | (1.44) | ||||||
| Conventional vs. SR | 0.0003 | 0.020 | −0.161*** | 0.054*** | 0.016*** | |||||
| (0.365) | (0.589) | (0.000) | (0.000) | (0.002) | ||||||
| Panel D: Model(6) | ||||||||||
| Conventional funds | −0.001*** | 0.916*** | 0.185*** | −0.025*** | 0.019*** | −0.206*** | 0.439*** | 0.066*** | −0.154*** | 0.73 |
| (−18.92) | (753.13) | (132.00) | (−15.49) | (16.40) | (−10.91) | (16.48) | (4.39) | (−13.18) | ||
| SR funds | −0.001*** | 0.906*** | 0.359*** | −0.072*** | −0.015*** | 0.175** | 0.847*** | 0.529*** | −0.792*** | 0.81 |
| (−6.33) | (187.76) | (66.65) | (−12.02) | (−3.28) | (2.38) | (8.47) | (9.32) | (−17.86) | ||
| Conventional vs. SR | 0.000 | 0.010 | −0.175*** | 0.048*** | 0.034*** | −0.381 | −0.408*** | −0.463*** | 0.638*** | |
| (0.630) | (0.248) | (0.000) | (0.000) | (0.000) | (0.219) | (0.000) | (0.000) | (0.000) | ||
| Panel E: Model(7) | ||||||||||
| Conventional funds | −0.001*** | 0.939*** | 0.135*** | −0.032*** | 0.049*** | −0.043*** | 0.099*** | 0.012*** | −0.056*** | 0.73 |
| (−11.87) | (471.22) | (51.11) | (−11.89) | (25.39) | (−11.6) | (21.98) | (2.79) | (−17.46) | ||
| SR funds | −0.001** | 0.899*** | 0.281*** | −0.139*** | 0.123*** | 0.006 | 0.143*** | 0.125*** | −0.244*** | 0.76 |
| (−2.29) | (116.84) | (28.05) | (−13.63) | (16.74) | (0.40) | (8.31) | (7.57) | (−19.75) | ||
| Conventional vs. SR | 0.000 | 0.039 | −0.146*** | 0.108*** | −0.074*** | −0.049 | −0.044*** | −0.113*** | 0.188*** | |
| (0.259) | (0.755) | (0.000) | (0.000) | (0.000) | (0.984) | (0.000) | (0.000) | (0.000) | ||
This table is divided into five panels (A, B, C, D and E) and presents the results of models (3)–(7) for conventional and SR pension funds, respectively. Each panel shows the estimates for the following parameters: α, which represents stock-picking ability; β1 measures the sensitivity of fund return to the market return; β2, β3 and β4 measure the sensitivity of the pension funds to the size, book-to-market and momentum styles, respectively; γ1, γ2, γ3 and γ4 represent the timing abilities with respect to the market, size, book-to-market and momentum factors, respectively. The t-statistics are reported in parentheses. The last column shows the adjusted R-squared coefficient (R¯2). These panels also report the differences in the estimates between conventional and SR pension funds (conventional vs. SR); in this case, p-values are in parentheses.
Panel A (TM model results) shows that managers present negative stock-picking and market timing abilities. The MH model (panel B) displays positive stock-picking ability in conventional funds and absence of selectivity in SR funds. The market timing coefficients are significantly negative and lower for SR managers, displaying worse timing and selectivity skills in SR managers.
Before studying timing abilities with regard to different styles, we identify those styles that characterize pension funds with the four-factor Carhart model (panel C). Both types of pension fund display negative fund performance (significantly negative α coefficients), invest in small caps (β2 are significantly positive) and growth stocks (β3 are negative and significant), and only conventional managers follow momentum strategies (β4 coefficient is significantly positive). We observe significant differences between SR and conventional styles, and SR funds are more weighted toward small-capitalization stocks and growth stocks.
Panels D and E display the results of the multi-factorial timing versions (models 6 and 7). In both panels, conventional and SR managers present negative stock-picking ability, invest in small caps, and growth values. Conventional managers follow momentum strategies and it is not clear whether SR funds develop momentum strategies, since the multifactorial TM version (panel D) displays contrarian strategies, but the multifactorial MH version (panel E) shows positive evidence. Conventional managers are not able to time the market, and SR managers present positive market timing in the TM version but absence of it in the MH version. All managers are able to time size and book-to-market strategies, but do not time momentum strategies. The mean difference test shows that SR managers present better timing abilities with respect to size and book-to-market styles, but worse with respect to the momentum strategies.
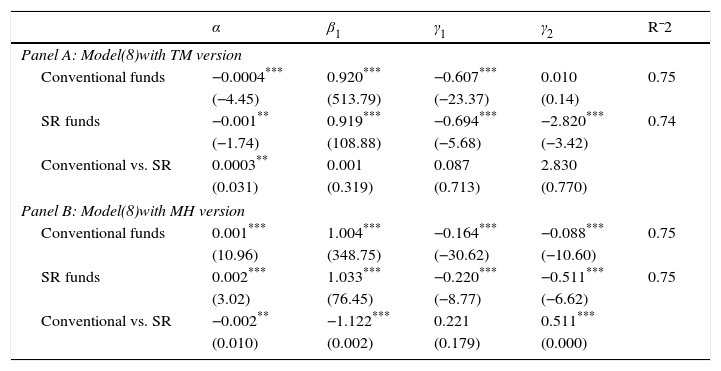
5.3Flows influence on traditional and multifactorial timing modelsThe influence of flows in timing abilities is examined in Table 5 (model 8). Panels A and B show persisting perverse market timing in conventional and SR pension fund managers, despite of the flows influence. Therefore, the prior negative market timing is not attributed to the realized flow at the fund. Unlike prior mutual fund evidence (Edelen, 1999; Alda et al., 2015), pension fund managers do not take into account flows to develop and improve their skills. This result is related to the lack of relation between flows and return; to be precise, if pension fund investors do not increase inflows and outflows as a result of positive and negative returns (no investment allocation according to past return), managers do not consider flows in management.
Flows influence on traditional timing models.
| α | β1 | γ1 | γ2 | R¯2 | |
|---|---|---|---|---|---|
| Panel A: Model(8)with TM version | |||||
| Conventional funds | −0.0004*** | 0.920*** | −0.607*** | 0.010 | 0.75 |
| (−4.45) | (513.79) | (−23.37) | (0.14) | ||
| SR funds | −0.001** | 0.919*** | −0.694*** | −2.820*** | 0.74 |
| (−1.74) | (108.88) | (−5.68) | (−3.42) | ||
| Conventional vs. SR | 0.0003** | 0.001 | 0.087 | 2.830 | |
| (0.031) | (0.319) | (0.713) | (0.770) | ||
| Panel B: Model(8)with MH version | |||||
| Conventional funds | 0.001*** | 1.004*** | −0.164*** | −0.088*** | 0.75 |
| (10.96) | (348.75) | (−30.62) | (−10.60) | ||
| SR funds | 0.002*** | 1.033*** | −0.220*** | −0.511*** | 0.75 |
| (3.02) | (76.45) | (−8.77) | (−6.62) | ||
| Conventional vs. SR | −0.002** | −1.122*** | 0.221 | 0.511*** | |
| (0.010) | (0.002) | (0.179) | (0.000) | ||
This table is divided into two panels. Panel A present the results of model (8) with the TM version, for conventional and SR pension funds. Panel B presents the same information as panel A for the MH version. Each panel shows the estimates for the following parameters: α represents stock-picking ability; β1 measures the sensitivity of the funds to market return; γ1 reflects market timing ability, and γ2 is the interactive term that introduces the effect of flows on market timing. The t-statistics are reported in parentheses. The last column shows the adjusted R-squared coefficient (R¯2). The panels also report whether there are significant differences in the estimates between conventional and SR pension funds (conventional vs. SR); in this case, p-values are in parentheses.
The influence of flows in multifactorial timing models (model 9 results) is collected in Table 6. Panels A and B show negative and positive stock-picking abilities, respectively. Conventional managers develop perverse market timing, and SR managers are able to time the market, according to the TM version (panel A), but panel B shows absence of this ability. Both sets of managers time correctly size strategies, but time incorrectly book-to-market and momentum strategies. By introducing the flow-interactive terms in timing abilities, the book-to-market timing coefficient becomes negative; thus, managers do not interpret correctly the flows direction to improve the book-to-market timing abilities.
Flows influence on multifactorial timing models.
| α | β1 | β2 | β3 | β4 | γ1 | γ2 | γ3 | γ4 | γ5 | γ6 | γ7 | γ8 | R¯2 | |
|---|---|---|---|---|---|---|---|---|---|---|---|---|---|---|
| Panel A: Model(9)with TM version | ||||||||||||||
| Conv. funds | −0.001*** | 0.913*** | 0.256*** | −0.048*** | 0.022*** | −0.162*** | 0.663*** | −0.110** | −0.439*** | −0.210** | −0.665*** | −0.703*** | 0.331*** | 0.78 |
| (−14.49) | (468.06) | (114.58) | (−15.80) | (12.17) | (−5.81) | (15.92) | (−2.02) | (−23.13) | (−2.41) | (−4.10) | (−3.41) | (5.44) | ||
| SR funds | −0.001* | 0.875*** | 0.384*** | −0.016 | −0.022*** | 0.310** | 0.607*** | −1.213*** | −0.820*** | −6.870*** | −1.526 | 7.997*** | 0.168 | 0.74 |
| (−1.81) | (100.99) | (40.23) | (−1.15) | (−2.81) | (2.56) | (3.45) | (−3.99) | (−10.13) | (−7.49) | (−1.48) | (2.88) | (0.47) | ||
| Conv-SR | −0.001 | 0.037* | −0.128*** | −0.033* | 0.044** | −0.472 | 0.056* | 1.103*** | 0.380*** | 6.660 | 0. 861 | −8.700 | 0.163 | |
| (0.252) | (0.073) | (0.000) | (0.058) | (0.012) | (0.877) | (0.078) | (0.005) | (0.008) | (0.715) | (0.303) | (0.543) | (0.648) | ||
| Panel B: Model(9)with MH version | ||||||||||||||
| Conv. funds | 0.0005*** | 0.936*** | 0.198*** | 0.016** | 0.080*** | −0.061*** | 0.105*** | −0.111*** | −0.100*** | −0.136*** | 0.058*** | 0.010 | −0.031*** | 0.78 |
| (3.84) | (301.21) | (51.77) | (2.58) | (27.80) | (−10.74) | (15.86) | (−12.15) | (−20.98) | (−12.63) | (5.92) | (0.81) | (−3.86) | ||
| SR funds | 0.002*** | 0.886*** | 0.322*** | 0.077*** | 0.116*** | −0.023 | 0.096*** | −0.198*** | −0.233*** | −0.467*** | −0.193** | 0.126 | −0.032 | 0.81 |
| (4.68) | (65.51) | (20.13) | (2.81) | (9.28) | (−0.93) | (3.44) | (−4.85) | (−11.48) | (−5.93) | (−2.04) | (0.90) | (−1.08) | ||
| Conv-SR | −0.002 | 0.049 | −0.124*** | −0.062* | −0.036*** | −0.038 | 0.009 | 0.087 | 0.133** | 0.331*** | 0.251 | −0.115 | 0.001 | |
| (0.177) | (0.383) | (0.000) | (0.086) | (0.002) | (0.187) | (0.272) | (0.131) | (0.021) | (0.000) | (0.254) | (0.757) | (0.609) | ||
This table is divided into two panels. Panel A presents the results of model (9) with the multifactorial TM version, for conventional and SR pension funds. Panel B presents the same information as panel A for the multifactorial MH version. Each panel shows the estimates for the following parameters: α represents stock-picking ability; β1 measures the sensitivity of pension funds to market return; β2, β3 and β4 measure the sensitivity of the pension funds analyzed to the size, book-to-market and momentum styles, respectively; γ1, γ2, γ3 and γ4 represent timing abilities with respect to market, size, book-to-market and momentum factors, respectively; γ5, γ6, γ7 and γ8 represent the interactive terms that introduce the effect of flows on timing abilities with respect to market, size, book-to-market and momentum factors, respectively. The t-statistics are reported in parentheses. The last column shows the adjusted R-squared coefficient (R¯2). The panels also report whether there are significant differences in the estimates between conventional and SR pension funds (Conv-SR); in this case, p-values are in parentheses.
The overall results show that conventional and SR pension funds present, in general, poor management abilities and perform similarly, despite some differences. Consequently, both set of managers develop comparable managerial strategies because conventional and SR investors pursue equivalent goals; i.e. saving for retirement. In addition, the persistent perverse timing after introducing the flow-interactive terms reveals that managers do not change their behavior (improving skills) to attract inflows and minimize outflows since pension fund investors do not move the investments based on prior results.
6ConclusionsWe provide new evidence on pension fund investor behavior and its influence on management by examining the determinants of flows in the pension fund industry. Using UK conventional and SR domestic pension funds, we discover singular conducts in the pension fund investors, which have a significant influence on managerial skills.
Pension fund investors, by and large, seek to save for retirement and cannot disinvest until retirement; although they are able to move the investment from one fund to another. As a consequence, pension fund investors rarely reallocate their investments, unlike mutual fund investors, and reinvest in funds that they already own. Specifically, we find that pension fund flows do not depend on past return; so pension funds are long-term investment vehicles in which save for retirement is the main target. Additionally, our results show that investors prefer to invest in younger and smaller funds. Our study also distinguishes between conventional and SR pension funds because SR investors and managers may act differently if they are less concerned about financial aspects. However, our results do not show differences in the determinants of flows in SR and conventional pension funds, and the long-term nature of these products predominates in both funds (money flows are not determined by past results).
Our results are contrary to the flow-return relationship found previously in mutual funds, revealing different preferences between pension and mutual fund investors. While mutual funds mainly pursue to make a profit, pension fund investors look for savings for retirement. Moreover, the disinvestment restrictions and the tax benefits of pension funds produce that the return is not a cause of money flows. An additional explanation may be the different costs, although it is important to note that our analysis does not allow us to examine this hypothesis, which can be studied in future research.
We also analyze if flows impact on pension fund management; specifically, we examine the flows influence on timing abilities. The results show that the absence of flow-return relation provokes that flows do not influence on management skills, and both sets of managers present poor timing abilities. In general, managers develop negative stock-picking and timing with regard to market and momentum strategies, and time correctly the size factor. This indicates that managers do not change their behavior, to attract inflows and minimize outflows, because investors do not move the investments based on previous results. The scarce differences found between conventional and SR funds reveal that both set of investors pursue to save for retirement, independently of the SR factor. Additionally, SR results can be influenced by the fact that the SR pension fund market is still developing, and many pension funds only report whether they implement SR practices, but do not explicit about the kind of SR criteria. It could even be the case that some pension funds follow certain SR practices, but they are not characterized as SR pension funds. In this regard, more research is needed.
Finally, we point out that our findings are limited to UK pension funds; however, our results can be extrapolated to other pension fund industries with similar characteristics, such as USA or Netherlands, in which the private pension investment has remarkably grown because, among other aspects, public pensions are low. Additionally, a further analysis about countries with dissimilar characteristics can also provide interesting studies, analyzing if our results hold in other pension fund industries. Regarding the latter, this study can be replicated in pension fund industries with Mediterranean and Continental pension fund systems, such as the Portuguese and French industries, in which private pensions have not been promoted to the same extent. As a consequence, a complete understanding of this topic in other pension fund industries is an important goal for future research.
The author wants to thank to the Government of Aragon [S58].
This version has been applied in other works; for example, Ferruz et al. (2012).
We do not introduce the flow-trading response coefficient used in Edelen (1999), since the purpose of including it is to prevent inflows crossing with outflows within a cash accumulation period. We avoid this problem by using net flows, and we also believe that flows remaining in cash must be taken into account, since they modify the proportion of funds exposed to the market (beta), and thus affect market timing in accordance with the Bollen and Busse (2001) hypothesis.
We should clarify that SR mutual funds can be divided considering the strategies followed; for example, social issues, and environmental criteria, positive or negative screens… However, the SR pension fund industry is still developing, and pension funds typically report only whether they follow, or not, SRI strategies, without specifying them, so we cannot divide our SR pension funds by these different criteria.
All these data are obtained from Xfi Centre for Finance and Investment, University of Exeter: http://business-school.exeter.ac.uk/research/areas/centres/xfi/research/famafrench/disclaimer/.

