


The aim of this paper is to analyze the determinants of sub-central government debt in Europe (Italy, France, Austria, Germany, Belgium and Spain) through estimation for each State based on corresponding panel data from 1996 to 2010. Furthermore, we estimate the debt model using a joint sample, consolidating conclusions on the most influential variables in terms of public debt. A comparative analysis of institutional frameworks in Europe shows that relationships between central and sub-central tax authorities have common traits, although the extent of change in each country remains unknown. In sum, this study shows that sub-sovereign government budgets are counter-cyclical, that economies of scale are present, which the golden rule of public finance is followed, that population growth and lower per capita financing lead to higher debt levels, and that regions characterized by higher debt/GDP ratios tend to have lower future deficits.
In recent decades in Europe, political and administrative decentralization processes have been carried out, partly driven by the European Union itself. These processes have not been uniform and have depended on the internal institutional reforms put in place from different countries. While Germany and Austria have a federal nature following constitutions set out after World War II, there are other traditionally more centralized countries in Europe such as Spain, France, Belgium or Italy that have been experiencing very dynamic decentralization processes and have not yet concluded.
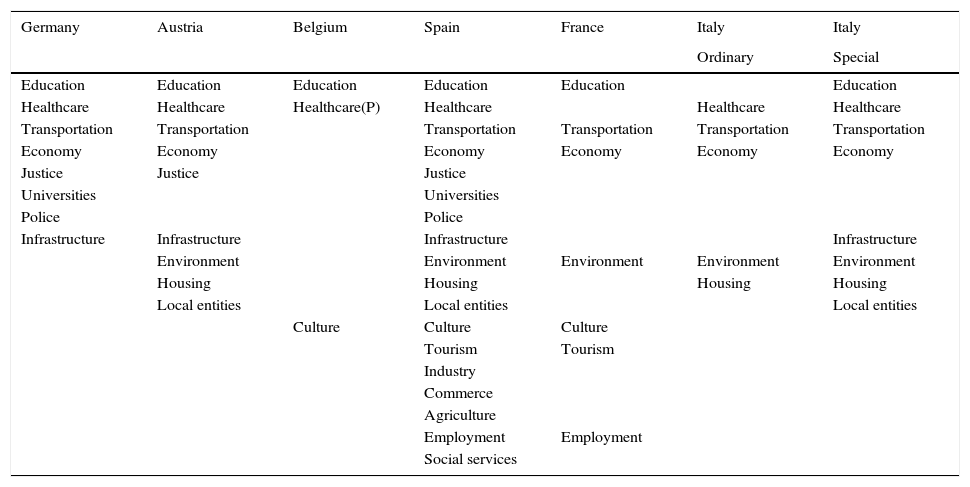
In the most centralized states, these processes began in the 1970s, with the last reforms of the institutional frameworks being implemented as from the year 2000. The common denominator of these processes has been to devolve to regions mainly welfare state responsibilities. The degree of decentralization has depended on each country, with Germany, Austria, Belgium and Spain achieving the highest decentralization level (Table 1).
European regions responsibilities.
| Germany | Austria | Belgium | Spain | France | Italy | Italy |
|---|---|---|---|---|---|---|
| Ordinary | Special | |||||
| Education | Education | Education | Education | Education | Education | |
| Healthcare | Healthcare | Healthcare(P) | Healthcare | Healthcare | Healthcare | |
| Transportation | Transportation | Transportation | Transportation | Transportation | Transportation | |
| Economy | Economy | Economy | Economy | Economy | Economy | |
| Justice | Justice | Justice | ||||
| Universities | Universities | |||||
| Police | Police | |||||
| Infrastructure | Infrastructure | Infrastructure | Infrastructure | |||
| Environment | Environment | Environment | Environment | Environment | ||
| Housing | Housing | Housing | Housing | |||
| Local entities | Local entities | Local entities | ||||
| Culture | Culture | Culture | ||||
| Tourism | Tourism | |||||
| Industry | ||||||
| Commerce | ||||||
| Agriculture | ||||||
| Employment | Employment | |||||
| Social services |
It is obvious that there must be a relationship between the number of responsibilities managed by local and regional governments and their weight within total public expenditure. If we consider the weight of local and regional expenditure in relation to total public expenditure, the most decentralized countries are Germany (57.6%) and Spain (55.18%), while France and Italy, the most centralized (Graphic 1).
.")
Debt has been a useful instrument to carry out sub-sovereign new responsibilities, taking into account indebtedness should always be linked to capital expenditures (golden rule). Likewise, debt is used in many countries due to the high sensitivity between GDP growth and operative revenue.
Broadly, local and regional debt in the period 2002–2009 has followed high-growth path for the European countries analyzed. In Spain, the volume of debt almost doubled, as it grew 90.93% while in Italy (61.7%) growth was somewhat more moderate.
German local and regional entities are undoubtedly the most indebted. German local and regional entities as a whole have a debt-to-GDP ratio in 2009 (29.08%), which is almost, double that of Spanish (11.55%) or Belgian (10.91%). In addition, the local and regional German debt is 39.32% of German public debt, while Spanish debt accounts for 20.05% of the Spanish public debt.
Likewise, German local and regional government debt is altogether much higher than that of the other countries considered. More than half (60.07%) of the local and regional debt of the European countries analyzed is German (Graphic 2), followed by France (13.55%), Italy (11.21%) and Spain (10.48%). German local and regional governments are the main issuers in capital markets (40.97% of outstanding debt). In second place are the Spanish local and regional governments (35.99%).

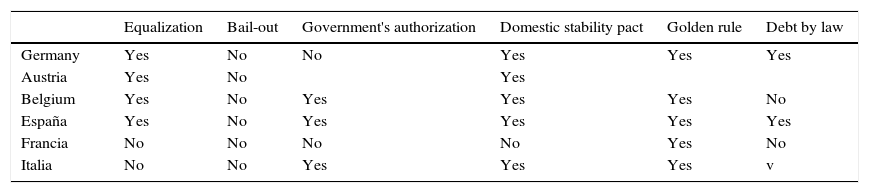
Regarding the institutional framework of the sub-sovereign countries in the six countries considered (Table 2), there is no bail-out clause and the golden rule is fulfilled, i.e., debt is only for investments. In addition, in most countries there is a national stability pact that tries to convey them the strict rules that countries have to fulfill within the European Union.
European sub-sovereign institutional framework.
| Equalization | Bail-out | Government's authorization | Domestic stability pact | Golden rule | Debt by law | |
|---|---|---|---|---|---|---|
| Germany | Yes | No | No | Yes | Yes | Yes |
| Austria | Yes | No | Yes | |||
| Belgium | Yes | No | Yes | Yes | Yes | No |
| España | Yes | No | Yes | Yes | Yes | Yes |
| Francia | No | No | No | No | Yes | No |
| Italia | No | No | Yes | Yes | Yes | v |
In most of the countries studied, there are equalization systems to correct the budget revenue differences between the richest and poorest regions. The equalization occurs from the central government to the regional (vertical), except in Germany that there are both a vertical and horizontal equalization (transfers between landers).
The economic literature in this area is still scarce and rather concentrated in the case of the US, Germany and Spain. In Spain, studies have been oriented mainly to verify the effect of fiscal co-responsibility, the existence or not of soft restraint, market discipline. The contribution of this article is twofold: On the one hand, to deal comprehensively with all aspects that may influence indebtedness; and secondly, to apply the specification for the regions of six European countries both individually by Country (Austria, Belgium, France, Italy, Germany and Spain) and in aggregate terms, comparing simultaneously with the same variables and criteria. Authors have been mainly inspired by Ellis and Schansberg (1999) and Jannone (2001) specifications for US states and Spanish regions respectively.
Potential implications in economy policy are also relevant to guide changes in the institutional framework that allow better compliance with fiscal targets and improve the sustainability of public finances. That is, to introduce changes in fiscal co-responsibility, changes in financing taking into account demographic and/or size factors, the establishment of additional budgetary restrictions or even changes in electoral laws which allow a greater probability of fiscal objectives fulfillment.
In this context, the aim of this paper is to analyze the determinants of sub-sovereign government debt in Europe through estimation for each State based on corresponding panel data from 1989 to 2010, with differences identified by country depending on data availability. European sub-sovereign governments in Italy, France, Austria, Germany, Belgium and Spain are studied. Furthermore, we estimate the debt model using a joint sample, consolidating conclusions on the most influential variables in terms of public debt.
The paper is organized as follows. In Section 2 presents a literature review about determinants of government debt. In Section 3, explains a methodology and the explanatory variables. In Section 4, provides a discussion of the results. Section 5 concludes.
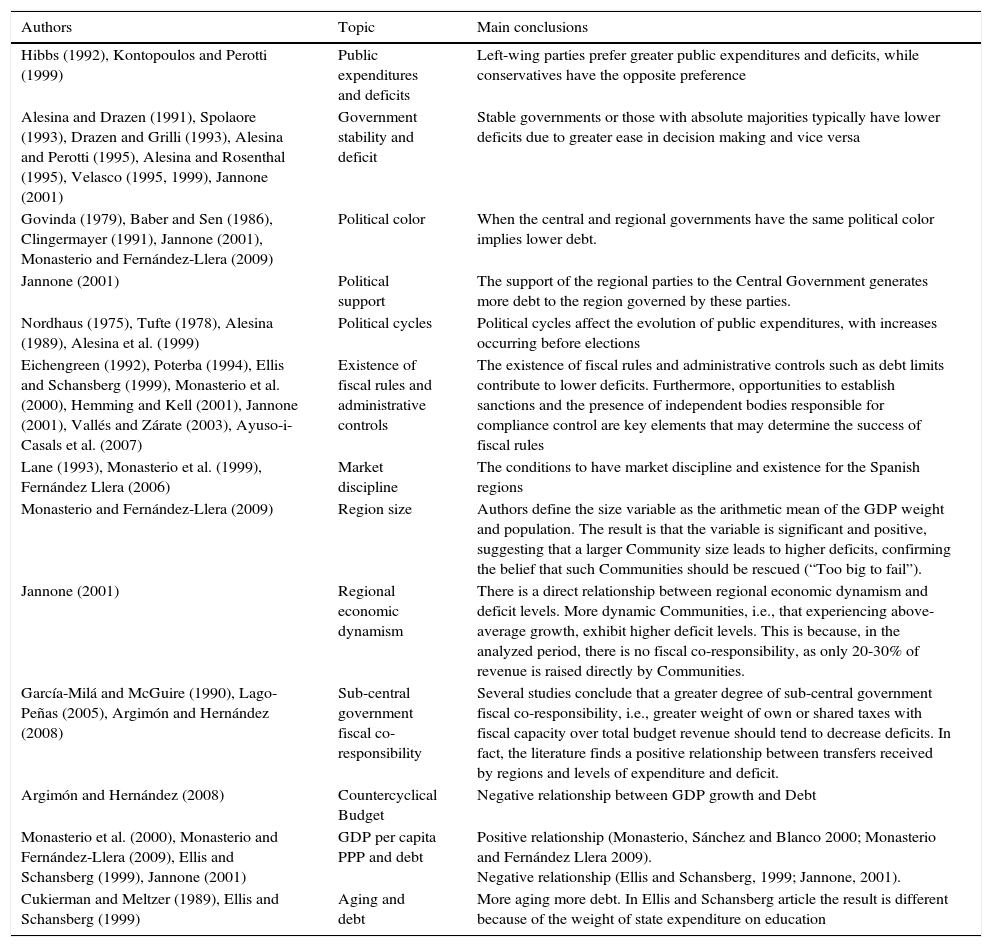
2Literature reviewModels used to estimate variables that significantly influence debt and deficit levels are structured as panel data, i.e., a combination of individual and time series, in which dummies and continuous variables interact based on political, geo-demographic, budgetary and economic indicators (Roubini and Sachs, 1989). Estimators depend on the year of creation, explanatory variables introduced and problems detected or, where applicable, those that may potentially appear in affected estimates. Table 3 shows a summary of the literature review in this context.
Literature review.
| Authors | Topic | Main conclusions |
|---|---|---|
| Hibbs (1992), Kontopoulos and Perotti (1999) | Public expenditures and deficits | Left-wing parties prefer greater public expenditures and deficits, while conservatives have the opposite preference |
| Alesina and Drazen (1991), Spolaore (1993), Drazen and Grilli (1993), Alesina and Perotti (1995), Alesina and Rosenthal (1995), Velasco (1995, 1999), Jannone (2001) | Government stability and deficit | Stable governments or those with absolute majorities typically have lower deficits due to greater ease in decision making and vice versa |
| Govinda (1979), Baber and Sen (1986), Clingermayer (1991), Jannone (2001), Monasterio and Fernández-Llera (2009) | Political color | When the central and regional governments have the same political color implies lower debt. |
| Jannone (2001) | Political support | The support of the regional parties to the Central Government generates more debt to the region governed by these parties. |
| Nordhaus (1975), Tufte (1978), Alesina (1989), Alesina et al. (1999) | Political cycles | Political cycles affect the evolution of public expenditures, with increases occurring before elections |
| Eichengreen (1992), Poterba (1994), Ellis and Schansberg (1999), Monasterio et al. (2000), Hemming and Kell (2001), Jannone (2001), Vallés and Zárate (2003), Ayuso-i-Casals et al. (2007) | Existence of fiscal rules and administrative controls | The existence of fiscal rules and administrative controls such as debt limits contribute to lower deficits. Furthermore, opportunities to establish sanctions and the presence of independent bodies responsible for compliance control are key elements that may determine the success of fiscal rules |
| Lane (1993), Monasterio et al. (1999), Fernández Llera (2006) | Market discipline | The conditions to have market discipline and existence for the Spanish regions |
| Monasterio and Fernández-Llera (2009) | Region size | Authors define the size variable as the arithmetic mean of the GDP weight and population. The result is that the variable is significant and positive, suggesting that a larger Community size leads to higher deficits, confirming the belief that such Communities should be rescued (“Too big to fail”). |
| Jannone (2001) | Regional economic dynamism | There is a direct relationship between regional economic dynamism and deficit levels. More dynamic Communities, i.e., that experiencing above-average growth, exhibit higher deficit levels. This is because, in the analyzed period, there is no fiscal co-responsibility, as only 20-30% of revenue is raised directly by Communities. |
| García-Milá and McGuire (1990), Lago-Peñas (2005), Argimón and Hernández (2008) | Sub-central government fiscal co-responsibility | Several studies conclude that a greater degree of sub-central government fiscal co-responsibility, i.e., greater weight of own or shared taxes with fiscal capacity over total budget revenue should tend to decrease deficits. In fact, the literature finds a positive relationship between transfers received by regions and levels of expenditure and deficit. |
| Argimón and Hernández (2008) | Countercyclical Budget | Negative relationship between GDP growth and Debt |
| Monasterio et al. (2000), Monasterio and Fernández-Llera (2009), Ellis and Schansberg (1999), Jannone (2001) | GDP per capita PPP and debt | Positive relationship (Monasterio, Sánchez and Blanco 2000; Monasterio and Fernández Llera 2009). Negative relationship (Ellis and Schansberg, 1999; Jannone, 2001). |
| Cukierman and Meltzer (1989), Ellis and Schansberg (1999) | Aging and debt | More aging more debt. In Ellis and Schansberg article the result is different because of the weight of state expenditure on education |
Regarding federalism/fiscal decentralization, there is no consensus on the efficiency of this process. For Tiebout (1956), Musgrave (1959) and Oates (1972), decentralization has generated efficiency, while for Prud’homme (1994), Hunter and Shah (1996), Ter-Minassian (1997), Afonso and Hauptmeier (2009), decentralization has entailed indiscipline and more debt.
Other studies have addressed market discipline, soft or hard budget constraints, or the effects of implementing fiscal rules or administrative controls over debt; the existence of the golden rule, the fiscal illusion or countercyclical budgets; the effect of tax co-responsibility, demographic and political variables on debt.
Lane (1993) sets the conditions for market discipline. However, although Monasterio et al. (1999) demonstrate that there is market discipline (for Spanish regions); Vulovic (2010) says this has worked poorly. In fact, Fernández Llera (2006) points out that market discipline must be complemented by administrative controls. Thus, fiscal rules and administrative controls have had a debt-reducing effect as shown by Ellis and Schansberg (1999) for US states; and Monasterio and Fernández-Llera (2009), Monasterio et al. (2000), Ayuso-i-Casals et al. (2007), Vallés and Zárate (2003), Jannone (2001) for Spanish regions. However, for Argimón and Hernández (2008), the fiscal rules do not influence the indebtedness.
Tax co-responsibility also helps reduce debt. The direct collection of taxes by the regions adds transparency to the taxpayers, thus generating discipline. This is demonstrated by Argimón and Hernández (2008), Lago-Peñas (2005), García-Milá and McGuire (1990).
In the case of the Spanish regions, Argimón and Hernández (2008) show that they have a countercyclical behavior. Likewise, Monasterio and Fernández-Llera (2009) conclude there is a positive relationship between size and debt, which means larger regions believe they will be rescued.
It can also be hypothesized that higher capital expenditures are paired with greater debt given that in most sub-sovereign governments, debt can only be used to finance investment. Furthermore, from an intergenerational equity perspective, the use of debt to finance investment is considered appropriate. Vallés (2002) shows that the weight of capital and operative expenditure is significant and positive in relation to deficits, reinforcing fiscal illusions, i.e., the impossibility of taxpayers to perceive the true cost of goods and services provided to generate political benefits, while the coefficient of capital revenue can be interpreted in the opposite sense. Jannone (2001) in turn concludes that net capital expenditures, i.e., expenditures with discounted capital revenue, represent a significant positive variable in relation to public deficit, while primary operating balance, i.e., the difference between operative revenue and expenditures, are also significant but negative. In this way, Spanish regions adjust deficit levels as a function of the budgetary margin provided through operative savings for finance investment.
According to the economic literature, GDP per capita in terms of PPP also has influence on the outstanding debt. For Monasterio et al. (2000) and Monasterio and Fernández-Llera (2009) show that there is a positive relation of GDP per capita in terms of PPP and debt due to the greater use of debt by the greater repayment capability of the debt of the richest regions; In contrast, Ellis and Schansberg for the US states (1999) and Jannone (2001) for the Spanish regions, conclude that this relationship is negative, because a stronger tax collection means less debt pressure.
Financing system shortcomings have also been cited as causes of increased debt. Erroneous calculations of real transferred service costs, overestimations of taxes, poor Interterritorial Compensation Fund functioning and a lack of leveling subsidies result in increased Community debt. The per capita degree of operative financing determines the deficit (Jannone, 2001). In this sense, and in the Spanish case, differences in per capita financing between Communities partly justify outstanding debt.
Aging also influences debt. Cukierman and Meltzer (1989) concluded that the more aged regions prefer more indebtedness than taxes to increase consumption today at the expense of future generations. However, Ellis and Schansberg (1999), in a study specific for US states, show that older states prefer taxation because of the spending by states biased toward education.
Alesina and Drazen (1991), Alesina and Tabellini (1990) and others say that stable governments and/or with absolute majority have lower indebtedness. Even this same effect occurs if the central and regional government has the same political color (Govinda, 1979; Baber and Sen, 1986; Clingermayer, 1991; Monasterio and Fernández-Llera, 2009; Jannone, 2001).
In Spain, according to Jannone (2001), the support of the regional parties to the Central Government generates more debt to the region governed by these parties. However, Monasterio and Fernández-Llera (2009) and Argimón and Hernández (2008) find that the variable is not significant.
Likewise, it is also shown that the period before the political elections, public spending, and therefore, the debt is raised with the aim of guaranteeing re-election (Tufte, 1978; Nordhaus, 1975; Alesina, 1989; Alesina et al., 1999).
Argimón and Hernández (2008) conclude that deficits have a high inertia component, as they are related to results achieved in the prior fiscal year. This demonstrates that in budgetary processes, the results of prior years are considered, removing a considerable degree of budgeting flexibility. However, negative dependence between the debt stock and deficit (budgetary balances) denotes sub-sovereign government sensitivity to debt renewal.
3MethodologyThe model to be estimated is described as follows:
where pij: political variables in region “i” in year “j”, demij: demographic variables and size in region “i” in year “j”, geoij: geographical variables in region “i” in year “j”, rij: fiscal rules in region “i” in year “j”, fsij: financing system in region “i” in year “j”, ecoij: economic variables in region “i” in year “j”, budij: budgetary variables in region “i” in year “j”, lagij: lagged variables in region “i” in year “j”.
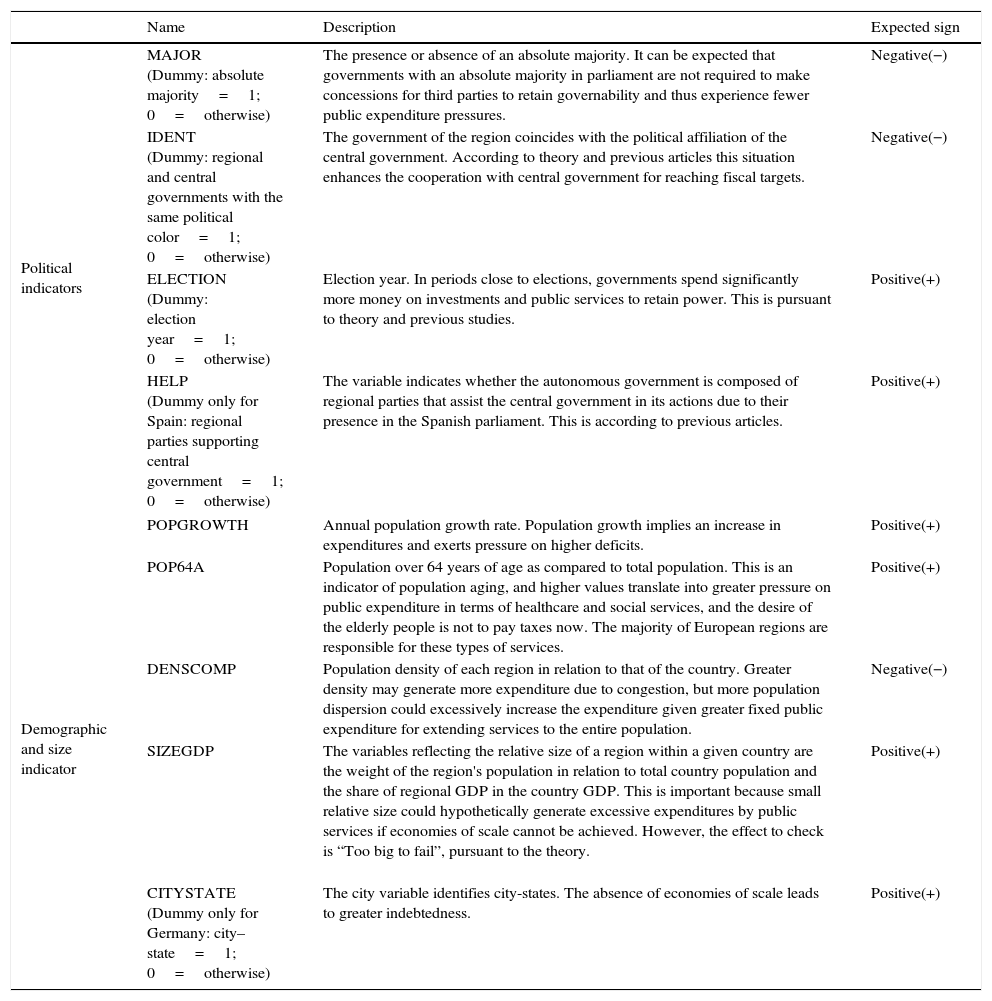
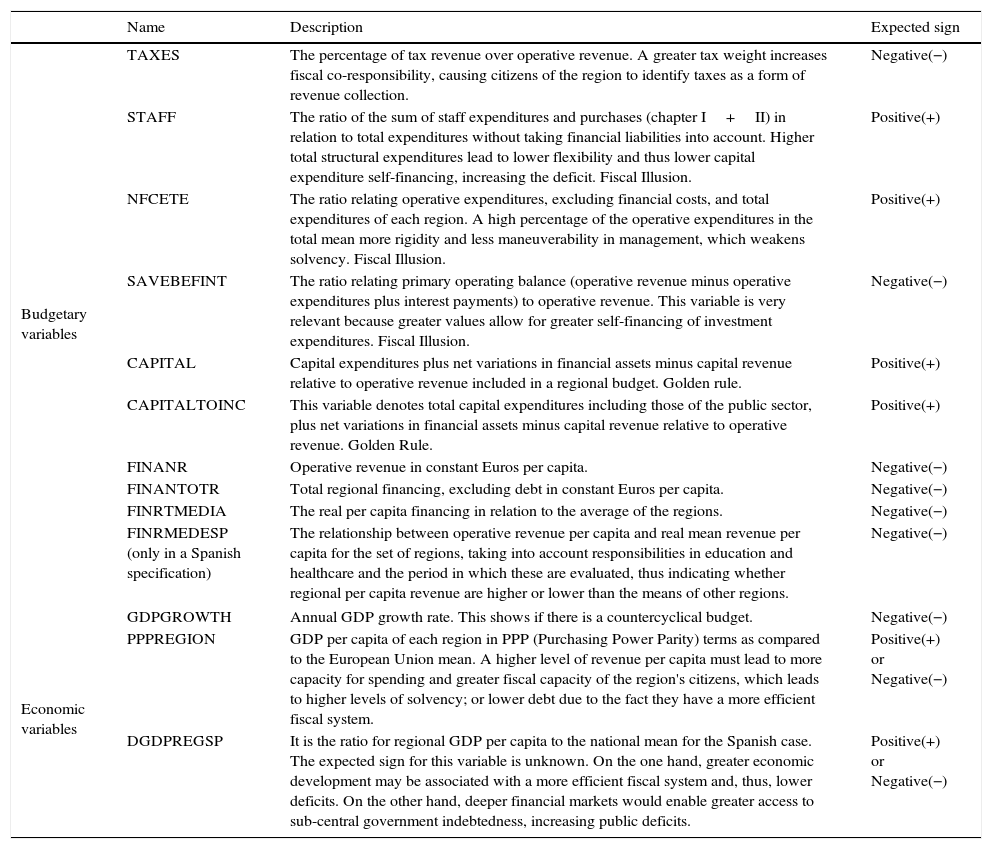
The dependent variable is direct debt variation in each region “i” studied for a period “j”. The explanatory variables of Eq. (1) are specified below, beginning with political indicators, demographic and size indicators (Table 4), budgetary and economics variables (Table 5), tax rules and structural changes (Table 6).
Independent variables: political, demographic and size indicators.
| Name | Description | Expected sign | |
|---|---|---|---|
| Political indicators | MAJOR (Dummy: absolute majority=1; 0=otherwise) | The presence or absence of an absolute majority. It can be expected that governments with an absolute majority in parliament are not required to make concessions for third parties to retain governability and thus experience fewer public expenditure pressures. | Negative(−) |
| IDENT (Dummy: regional and central governments with the same political color=1; 0=otherwise) | The government of the region coincides with the political affiliation of the central government. According to theory and previous articles this situation enhances the cooperation with central government for reaching fiscal targets. | Negative(−) | |
| ELECTION (Dummy: election year=1; 0=otherwise) | Election year. In periods close to elections, governments spend significantly more money on investments and public services to retain power. This is pursuant to theory and previous studies. | Positive(+) | |
| HELP (Dummy only for Spain: regional parties supporting central government=1; 0=otherwise) | The variable indicates whether the autonomous government is composed of regional parties that assist the central government in its actions due to their presence in the Spanish parliament. This is according to previous articles. | Positive(+) | |
| Demographic and size indicator | POPGROWTH | Annual population growth rate. Population growth implies an increase in expenditures and exerts pressure on higher deficits. | Positive(+) |
| POP64A | Population over 64 years of age as compared to total population. This is an indicator of population aging, and higher values translate into greater pressure on public expenditure in terms of healthcare and social services, and the desire of the elderly people is not to pay taxes now. The majority of European regions are responsible for these types of services. | Positive(+) | |
| DENSCOMP | Population density of each region in relation to that of the country. Greater density may generate more expenditure due to congestion, but more population dispersion could excessively increase the expenditure given greater fixed public expenditure for extending services to the entire population. | Negative(−) | |
| SIZEGDP | The variables reflecting the relative size of a region within a given country are the weight of the region's population in relation to total country population and the share of regional GDP in the country GDP. This is important because small relative size could hypothetically generate excessive expenditures by public services if economies of scale cannot be achieved. However, the effect to check is “Too big to fail”, pursuant to the theory. | Positive(+) | |
| CITYSTATE (Dummy only for Germany: city–state=1; 0=otherwise) | The city variable identifies city-states. The absence of economies of scale leads to greater indebtedness. | Positive(+) | |
Independent variables: budgetary and economic indicators.
| Name | Description | Expected sign | |
|---|---|---|---|
| Budgetary variables | TAXES | The percentage of tax revenue over operative revenue. A greater tax weight increases fiscal co-responsibility, causing citizens of the region to identify taxes as a form of revenue collection. | Negative(−) |
| STAFF | The ratio of the sum of staff expenditures and purchases (chapter I+II) in relation to total expenditures without taking financial liabilities into account. Higher total structural expenditures lead to lower flexibility and thus lower capital expenditure self-financing, increasing the deficit. Fiscal Illusion. | Positive(+) | |
| NFCETE | The ratio relating operative expenditures, excluding financial costs, and total expenditures of each region. A high percentage of the operative expenditures in the total mean more rigidity and less maneuverability in management, which weakens solvency. Fiscal Illusion. | Positive(+) | |
| SAVEBEFINT | The ratio relating primary operating balance (operative revenue minus operative expenditures plus interest payments) to operative revenue. This variable is very relevant because greater values allow for greater self-financing of investment expenditures. Fiscal Illusion. | Negative(−) | |
| CAPITAL | Capital expenditures plus net variations in financial assets minus capital revenue relative to operative revenue included in a regional budget. Golden rule. | Positive(+) | |
| CAPITALTOINC | This variable denotes total capital expenditures including those of the public sector, plus net variations in financial assets minus capital revenue relative to operative revenue. Golden Rule. | Positive(+) | |
| FINANR | Operative revenue in constant Euros per capita. | Negative(−) | |
| FINANTOTR | Total regional financing, excluding debt in constant Euros per capita. | Negative(−) | |
| FINRTMEDIA | The real per capita financing in relation to the average of the regions. | Negative(−) | |
| FINRMEDESP (only in a Spanish specification) | The relationship between operative revenue per capita and real mean revenue per capita for the set of regions, taking into account responsibilities in education and healthcare and the period in which these are evaluated, thus indicating whether regional per capita revenue are higher or lower than the means of other regions. | Negative(−) | |
| Economic variables | GDPGROWTH | Annual GDP growth rate. This shows if there is a countercyclical budget. | Negative(−) |
| PPPREGION | GDP per capita of each region in PPP (Purchasing Power Parity) terms as compared to the European Union mean. A higher level of revenue per capita must lead to more capacity for spending and greater fiscal capacity of the region's citizens, which leads to higher levels of solvency; or lower debt due to the fact they have a more efficient fiscal system. | Positive(+) or Negative(−) | |
| DGDPREGSP | It is the ratio for regional GDP per capita to the national mean for the Spanish case. The expected sign for this variable is unknown. On the one hand, greater economic development may be associated with a more efficient fiscal system and, thus, lower deficits. On the other hand, deeper financial markets would enable greater access to sub-central government indebtedness, increasing public deficits. | Positive(+) or Negative(−) | |
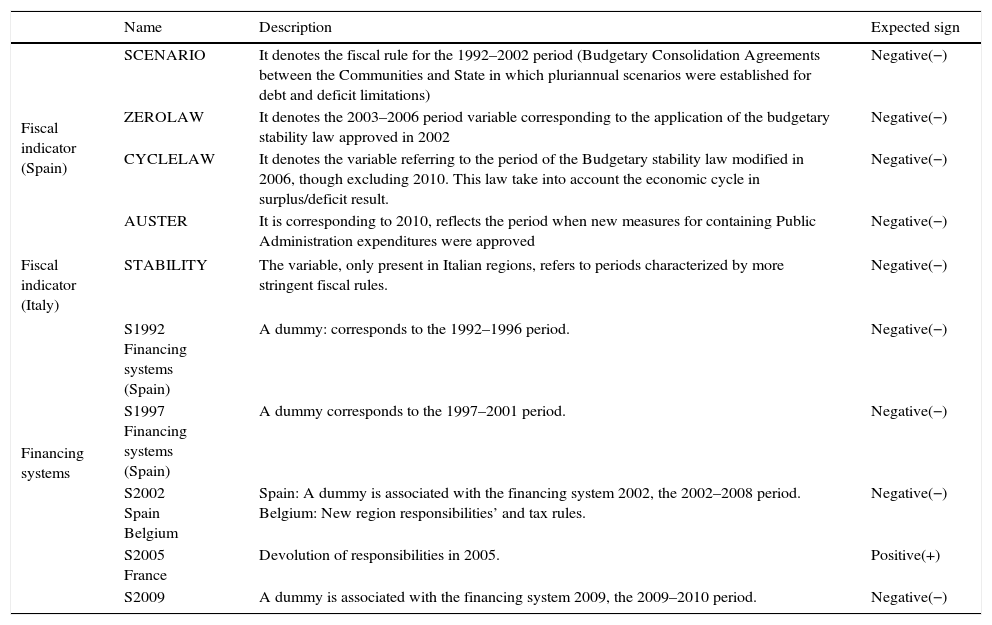
Independent variables (Dummies): tax rules and structural changes.
| Name | Description | Expected sign | |
|---|---|---|---|
| Fiscal indicator (Spain) | SCENARIO | It denotes the fiscal rule for the 1992–2002 period (Budgetary Consolidation Agreements between the Communities and State in which pluriannual scenarios were established for debt and deficit limitations) | Negative(−) |
| ZEROLAW | It denotes the 2003–2006 period variable corresponding to the application of the budgetary stability law approved in 2002 | Negative(−) | |
| CYCLELAW | It denotes the variable referring to the period of the Budgetary stability law modified in 2006, though excluding 2010. This law take into account the economic cycle in surplus/deficit result. | Negative(−) | |
| AUSTER | It is corresponding to 2010, reflects the period when new measures for containing Public Administration expenditures were approved | Negative(−) | |
| Fiscal indicator (Italy) | STABILITY | The variable, only present in Italian regions, refers to periods characterized by more stringent fiscal rules. | Negative(−) |
| Financing systems | S1992 Financing systems (Spain) | A dummy: corresponds to the 1992–1996 period. | Negative(−) |
| S1997 Financing systems (Spain) | A dummy corresponds to the 1997–2001 period. | Negative(−) | |
| S2002 Spain Belgium | Spain: A dummy is associated with the financing system 2002, the 2002–2008 period. Belgium: New region responsibilities’ and tax rules. | Negative(−) | |
| S2005 France | Devolution of responsibilities in 2005. | Positive(+) | |
| S2009 | A dummy is associated with the financing system 2009, the 2009–2010 period. | Negative(−) | |
The introduction of political variables tries to see if a regional government with an absolute majority, sharing the same political color between the central and regional government and the support from regional parties to the central government, has some influence on the evolution of the debt. The theory and previous studies indicate that they do have influence: Having the same political color or an absolute majority generates less debt; while regional governments (regional parties in the office) which support the central government raise debt. In addition, prior to the polls governments increase spending, and therefore, debt to ensure re-election.
Demographic variables can also theoretically influence debt, either by population growth, aging or population density. The size of the regions is also a variable to consider, since it is possible that the larger a region the greater the debt because it believes it will be rescued by the central government (“too big to fail”).
With the inclusion of economic variables in the specifications, it is possible to know whether budgets are countercyclical or whether rich regions issue more debt because they have more repayment capability or lower debt due to the fact they have a more efficient fiscal system.
The specification also incorporates budget variables to find if there is fiscal illusion, the golden rule or a negative relation between financing per capita and debt through the budget variables; and whether the application of more restrictive fiscal rules or changes in financing models or devolution of new responsibilities have influenced outstanding debt. Furthermore, the effect of the tax co-responsibility on the debt, taking into accounts the theory and previous articles.
The lagged variable included in the model refers to the outstanding debt and debt variation. In the first variable, its sign is expected to be negative, as higher debt levels lead to lower deficits in the following period as a logical reaction to avoid excessive deficits in the future, pursuant to the theory and previous articles; and the second one, positive pursuant to the inertia effect.
The construction of regional variables for each country has been a very complex task. No country database can be used exclusively to conduct estimates, and not all available information is operative. We thus followed a very thorough process that included an information search through varied sources to combine data with obtained times series for each region of the greatest possible length.
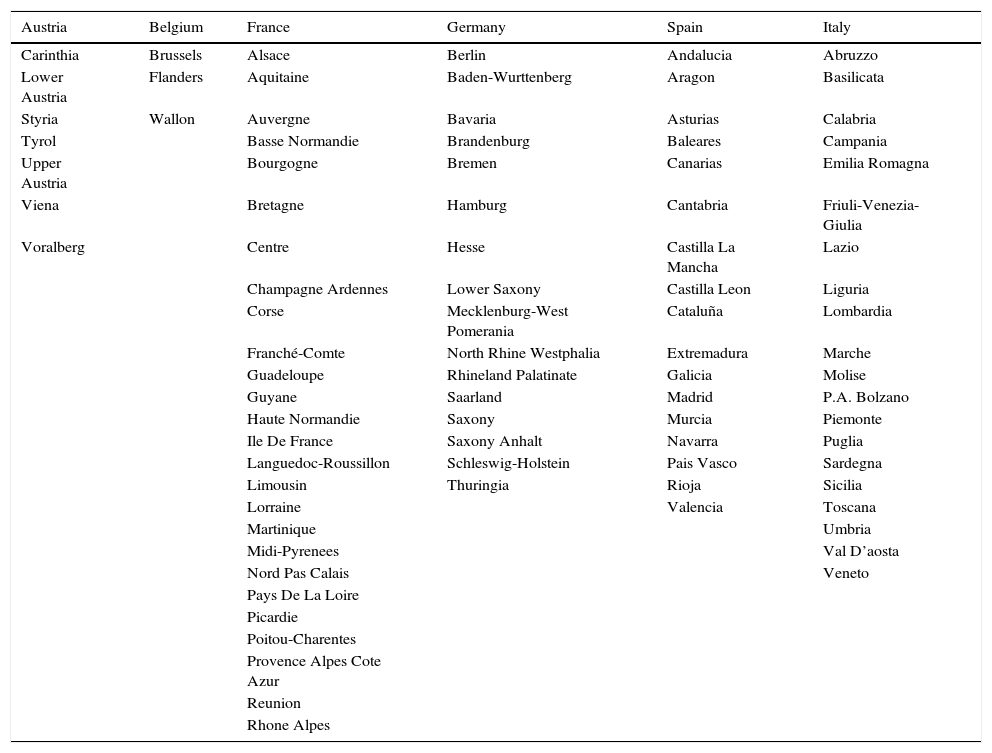
Regarding regions, almost all European regions from Austria, Belgium, France, Germany, Italy and Spain are included within the panel data. 89 sub-sovereigns out of 92 have been introduced. The autonomous province of Trento in Italy and Austrian Landers Salzburg and Burgenland are excluded due to the scarcity of data (Table 7).
Sub-sovereigns by country.
| Austria | Belgium | France | Germany | Spain | Italy |
|---|---|---|---|---|---|
| Carinthia | Brussels | Alsace | Berlin | Andalucia | Abruzzo |
| Lower Austria | Flanders | Aquitaine | Baden-Wurttenberg | Aragon | Basilicata |
| Styria | Wallon | Auvergne | Bavaria | Asturias | Calabria |
| Tyrol | Basse Normandie | Brandenburg | Baleares | Campania | |
| Upper Austria | Bourgogne | Bremen | Canarias | Emilia Romagna | |
| Viena | Bretagne | Hamburg | Cantabria | Friuli-Venezia-Giulia | |
| Voralberg | Centre | Hesse | Castilla La Mancha | Lazio | |
| Champagne Ardennes | Lower Saxony | Castilla Leon | Liguria | ||
| Corse | Mecklenburg-West Pomerania | Cataluña | Lombardia | ||
| Franché-Comte | North Rhine Westphalia | Extremadura | Marche | ||
| Guadeloupe | Rhineland Palatinate | Galicia | Molise | ||
| Guyane | Saarland | Madrid | P.A. Bolzano | ||
| Haute Normandie | Saxony | Murcia | Piemonte | ||
| Ile De France | Saxony Anhalt | Navarra | Puglia | ||
| Languedoc-Roussillon | Schleswig-Holstein | Pais Vasco | Sardegna | ||
| Limousin | Thuringia | Rioja | Sicilia | ||
| Lorraine | Valencia | Toscana | |||
| Martinique | Umbria | ||||
| Midi-Pyrenees | Val D’aosta | ||||
| Nord Pas Calais | Veneto | ||||
| Pays De La Loire | |||||
| Picardie | |||||
| Poitou-Charentes | |||||
| Provence Alpes Cote Azur | |||||
| Reunion | |||||
| Rhone Alpes |
Time frames vary according to the country analyzed: 1996–2010 for Italy; 1989–2010 and 1995–2010 for Spain; 1999–2010 for France; 1997–2010 for Belgium; 1998–2010 for Austria and Germany; and 1999–2010 for all the countries. The data are in annual basis.
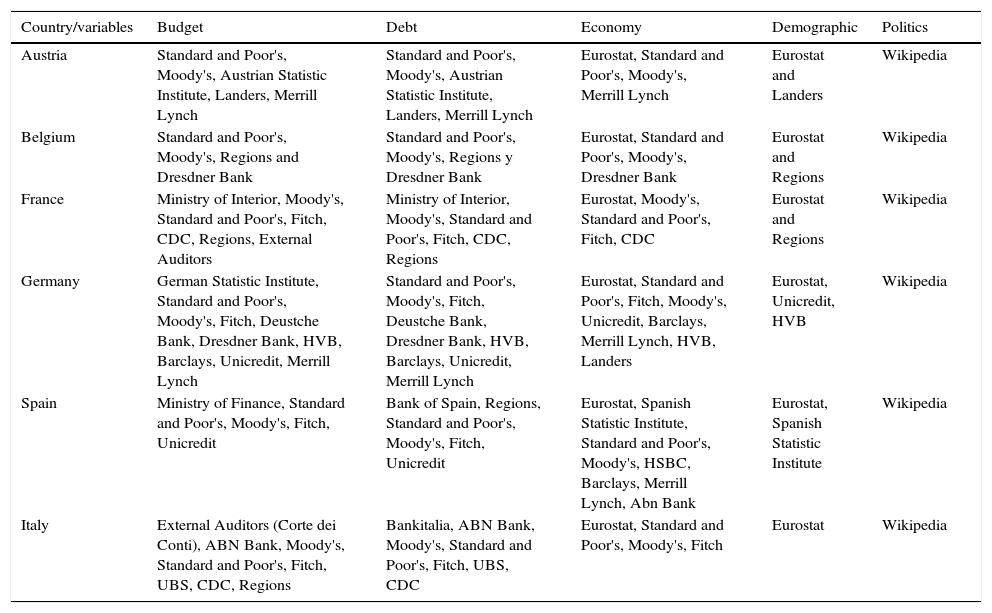
Data were drawn from Eurostat, national statistics institute; Moody's, Standard & Poor's and Fitch rating agencies; the National and Regional Court of Auditors; banks; central banks; central government finance departments; and regions themselves (Table 8).
Statistics by country.
| Country/variables | Budget | Debt | Economy | Demographic | Politics |
|---|---|---|---|---|---|
| Austria | Standard and Poor's, Moody's, Austrian Statistic Institute, Landers, Merrill Lynch | Standard and Poor's, Moody's, Austrian Statistic Institute, Landers, Merrill Lynch | Eurostat, Standard and Poor's, Moody's, Merrill Lynch | Eurostat and Landers | Wikipedia |
| Belgium | Standard and Poor's, Moody's, Regions and Dresdner Bank | Standard and Poor's, Moody's, Regions y Dresdner Bank | Eurostat, Standard and Poor's, Moody's, Dresdner Bank | Eurostat and Regions | Wikipedia |
| France | Ministry of Interior, Moody's, Standard and Poor's, Fitch, CDC, Regions, External Auditors | Ministry of Interior, Moody's, Standard and Poor's, Fitch, CDC, Regions | Eurostat, Moody's, Standard and Poor's, Fitch, CDC | Eurostat and Regions | Wikipedia |
| Germany | German Statistic Institute, Standard and Poor's, Moody's, Fitch, Deustche Bank, Dresdner Bank, HVB, Barclays, Unicredit, Merrill Lynch | Standard and Poor's, Moody's, Fitch, Deustche Bank, Dresdner Bank, HVB, Barclays, Unicredit, Merrill Lynch | Eurostat, Standard and Poor's, Fitch, Moody's, Unicredit, Barclays, Merrill Lynch, HVB, Landers | Eurostat, Unicredit, HVB | Wikipedia |
| Spain | Ministry of Finance, Standard and Poor's, Moody's, Fitch, Unicredit | Bank of Spain, Regions, Standard and Poor's, Moody's, Fitch, Unicredit | Eurostat, Spanish Statistic Institute, Standard and Poor's, Moody's, HSBC, Barclays, Merrill Lynch, Abn Bank | Eurostat, Spanish Statistic Institute | Wikipedia |
| Italy | External Auditors (Corte dei Conti), ABN Bank, Moody's, Standard and Poor's, Fitch, UBS, CDC, Regions | Bankitalia, ABN Bank, Moody's, Standard and Poor's, Fitch, UBS, CDC | Eurostat, Standard and Poor's, Moody's, Fitch | Eurostat | Wikipedia |
Debt determinant model specifications for regional European entities are estimated from panel data for fixed-random effects through the selection of the most efficient estimator based on Haussman test results. This estimator is compared with corresponding estimations for instrumental variables, where instruments used included GDPGROWTH and/or PPPREGION, and the Haussman test is used to check for endogeneity in the conducted estimation because, if this were the case, the estimator would be biased.
In cases of non-endogeneity, if the estimator of fixed effects is more efficient, the hypothesis on the existence of serial autocorrelation, contemporary autocorrelation and heteroskedasticity is confirmed. If specification problems appear as noted above, the estimation would be repeated using feasible generalized least squares corrected for the problems detected. If the most efficient estimator is one of random effects, the hypothesis regarding the presence of serial autocorrelation would be confirmed. In cases of serial autocorrelation, we would re-estimate with the use of generalized least squares corrected for autocorrelation.
Finally, following static model estimates, the Arellano-Bond estimator (Generalized Method of Moments) is used to estimate a dynamic model with difference variables that include the lagged dependent variable, i.e., variations in debt to GDP, for one or two periods, and the other variables are used for the static model. The Arellano-Bond (1991) test for second-degree serial autocorrelation and the Sargan test of over-identification restriction are also conducted.
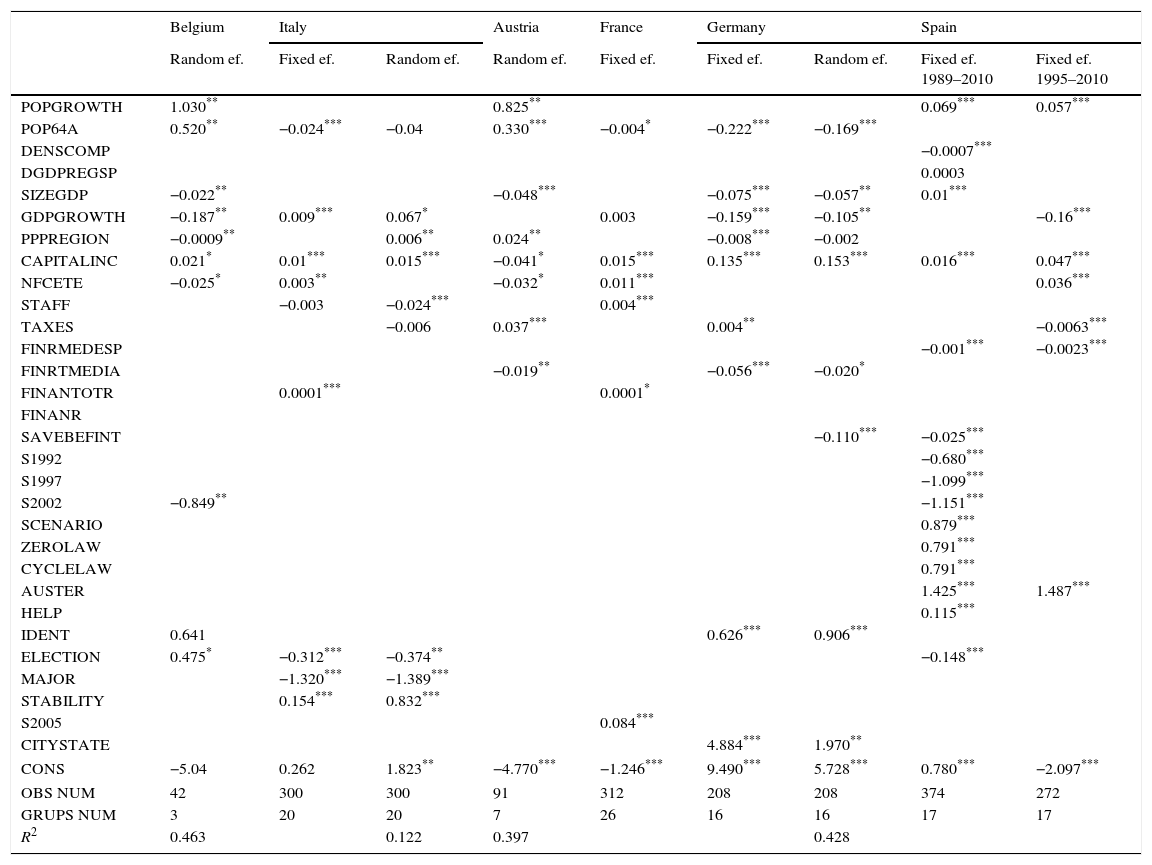
4ResultsEq. (1) was estimated for each European country covered in this study based on a panel sample, as explained in the methodology. Table 9 shows that for certain countries, estimations include random and fixed effects because variables estimated together differ, and thus, both are efficient for the set of factors chosen.
Estimation results of static models.
| Belgium | Italy | Austria | France | Germany | Spain | ||||
|---|---|---|---|---|---|---|---|---|---|
| Random ef. | Fixed ef. | Random ef. | Random ef. | Fixed ef. | Fixed ef. | Random ef. | Fixed ef. 1989–2010 | Fixed ef. 1995–2010 | |
| POPGROWTH | 1.030** | 0.825** | 0.069*** | 0.057*** | |||||
| POP64A | 0.520** | −0.024*** | −0.04 | 0.330*** | −0.004* | −0.222*** | −0.169*** | ||
| DENSCOMP | −0.0007*** | ||||||||
| DGDPREGSP | 0.0003 | ||||||||
| SIZEGDP | −0.022** | −0.048*** | −0.075*** | −0.057** | 0.01*** | ||||
| GDPGROWTH | −0.187** | 0.009*** | 0.067* | 0.003 | −0.159*** | −0.105** | −0.16*** | ||
| PPPREGION | −0.0009** | 0.006** | 0.024** | −0.008*** | −0.002 | ||||
| CAPITALINC | 0.021* | 0.01*** | 0.015*** | −0.041* | 0.015*** | 0.135*** | 0.153*** | 0.016*** | 0.047*** |
| NFCETE | −0.025* | 0.003** | −0.032* | 0.011*** | 0.036*** | ||||
| STAFF | −0.003 | −0.024*** | 0.004*** | ||||||
| TAXES | −0.006 | 0.037*** | 0.004** | −0.0063*** | |||||
| FINRMEDESP | −0.001*** | −0.0023*** | |||||||
| FINRTMEDIA | −0.019** | −0.056*** | −0.020* | ||||||
| FINANTOTR | 0.0001*** | 0.0001* | |||||||
| FINANR | |||||||||
| SAVEBEFINT | −0.110*** | −0.025*** | |||||||
| S1992 | −0.680*** | ||||||||
| S1997 | −1.099*** | ||||||||
| S2002 | −0.849** | −1.151*** | |||||||
| SCENARIO | 0.879*** | ||||||||
| ZEROLAW | 0.791*** | ||||||||
| CYCLELAW | 0.791*** | ||||||||
| AUSTER | 1.425*** | 1.487*** | |||||||
| HELP | 0.115*** | ||||||||
| IDENT | 0.641 | 0.626*** | 0.906*** | ||||||
| ELECTION | 0.475* | −0.312*** | −0.374** | −0.148*** | |||||
| MAJOR | −1.320*** | −1.389*** | |||||||
| STABILITY | 0.154*** | 0.832*** | |||||||
| S2005 | 0.084*** | ||||||||
| CITYSTATE | 4.884*** | 1.970** | |||||||
| CONS | −5.04 | 0.262 | 1.823** | −4.770*** | −1.246*** | 9.490*** | 5.728*** | 0.780*** | −2.097*** |
| OBS NUM | 42 | 300 | 300 | 91 | 312 | 208 | 208 | 374 | 272 |
| GRUPS NUM | 3 | 20 | 20 | 7 | 26 | 16 | 16 | 17 | 17 |
| R2 | 0.463 | 0.122 | 0.397 | 0.428 | |||||
Notes:
The results show that among the demographic variables, for Belgian and Austrian regions, the population growth (POPGROWTH) sign and that of populations over 64 years of age (POP64A) coincide with expectations; that is, these variables are positive because higher degrees of population aging and greater population growth rates increase expenditures, increasing debt levels, and also because, according to the theory, elderly people vote against the rise of tax rates for financing the increase of current public expenditure. However, in Italy, France and Germany, the POP64A variable presents an unexpected sign. French regions show little power in the area of expenditures, regional entities are not held responsible for social or healthcare spending, which form the majority of expenditures in more aged societies. For this reason, given the country's responsibility in education, this negative sign is to be expected, as larger younger populations correlate with higher regional expenditures and thus greater debt. Only in the Spanish case, population density is significant and negative, reflecting the fact that relatively denser communities exhibit greater service accessibility and thus a reduction in direct debt stock variation relative to GDP. Moreover, for Spanish regions, the population growth has a positive sign like Belgian and Austrian ones.
The size measured in GDP terms relative to the mean (SIZEGDP) is significant and has a sign contrary to expectations and the theory in all countries except Spain. This shows that the effect of relative size pressures on the central government for obtaining greater laxity (too big to fail) on deficit rules does not work. Furthermore, real GDP growth (GDPGROWTH) indicates that Spain, Belgium and Germany are counter-cyclical given their negative relationship between indirect debt variations and real GDP growth; i.e., Spanish Autonomous Communities, Belgian regions and German Landers have more resources and fewer needs and thus less debt. Meanwhile, Italy reflects highly pro-cyclical behavior, in which GDP corresponds with positive debt variations. Real per capita revenue in PPP terms (PPPREGION) thus has a negative sign in Belgium and Germany; i.e., greater wealth and revenue lead to greater capabilities for taxation and therefore lower debt variation. Meanwhile, in Italy and Austria, the PPPREGION is positive, indicating that higher regional real per capita revenue correlate with greater indebtedness, as debt repayment capabilities are enhanced.
Regarding budgetary expenditures, CAPITALINC values reflect the expected sign, validating the golden rule in almost all countries (Austria is the exception) in which the increase of capital expenditures is financed by debt as described in previous articles. The Fiscal Illusion variables in the model such as NFCETE, STAFF and SAVEBEFINT, are fulfilled in the most countries studied. In France, Germany, Italy and Spain there is clearly Fiscal Illusion, meanwhile in Belgium and Austria it does not exist.
NFCETE (operative non-financial expenditures to total expenditures) are negative in Belgium and Austria, contrary to economic theory, perhaps because regions with a greater share of operative expenditures compensate with lower capital expenditures. Meanwhile, Italy, Spain and France do show a positive relation, i.e., a greater share of operative expenditures in the total budget produces a lower maneuver margin and a tendency toward higher debt variations and because citizens in these countries do not know the real cost of the public services. Additionally, in Italy, a higher share of staff expenditures in relation to expenditures has a negative influence on debt variation, which unexpectedly indicates a substitution effect between staff and functioning in expenditures relative to operative transfers. By contrast, this variable is positive in France, likely because higher operative expenditures tend to increase debt variations relative to GDP due to fewer investment self-financing opportunities.
Regarding SAVEBEFINT, in Germany and Spain, a higher rate of primary operating balance relative to operative revenue implies lower debt variations relative to GDP, suggesting that at least a proportion of savings are used to self-finance investment, and justified the existence of fiscal illusion.
As for budgetary revenue, a higher share of tax revenue relative to operative revenue grants (TAXES) that theoretically should influence in a reduction of debt due to greater fiscal co-responsibility and transparency toward the citizens has the sign not expected, except in Spanish regions. Total real per capita financing relative to total mean financing in Austria, Germany and Spain has a negative sign, suggesting that higher taxes and other forms of per capita revenue relative to the mean generate less debt variations relative to GDP, as expected according to theory and previous articles. By contrast, real per capita financing is positive in Italy and France, contrary to what was expected. Perhaps, in France, establishing a financing system that is progressively less linked to changes in GDP and a lower share of own taxes relative to total revenue may explain this result.
Regarding political variables, the influential capabilities are almost insignificant within specifications. Variables for absolute majority (MAJOR) presence are only significant in the Italian case. MAJOR assumes lower debt variations and coincides with the expected sign, as these cases of greater political support reflect fewer limitations and cessions to govern, thus leading to lower debt variations, according to theory and previous articles.
Variable regional government likeness to the central government (IDENT) theoretically implies the existence of greater cooperation in achieving the fiscal objectives as both governments are from the same political faction, and therefore the expected sign is negative. However, the result for German Landers is contrary to expectations.
The dummy variable which reflects the support from regional parties to the central government (HELP)-only in Spanish specifications-can make relaxing the fiscal objectives in compensation of the support, and consequently the sign must be positive. The sign in Spanish specifications is positive, pursuant to the expectations.
For its part, the election year variable is positive only in Belgium, coinciding with expectations and theory, i.e., greater pressure on expenditures during election years to ensure re-election. In the case of Italy and Spain, the negative sign of this variable may be related to electoral expenditures made for re-election purposes in the previous year.
On the other hand, the implementation of more restrictive fiscal rules for the sub-sovereign governments from the central government should press down the outstanding debt, and therefore the expected sign should be negative. The result of the fiscal rules on the debt has been in general ineffective. It has only worked well in Belgium. In Italy (STABILITY) this may perhaps coincide with periods when regions exerted maximum power, and in Spain (SCENARIO, ZEROLAW, CYCLELAW, AUSTER) it is assumed that the simultaneity of financing system and fiscal rule variables produces interactions.
Additionally, in Spain the different financing models implemented in the period (1989–2010) (S1992, S1997, S2002 and S2009), with additional contributions from the central government, have slowed the expansion of debt because the sign is negative; In France, the S2005 variable is significant and positive, indicating that during the post-2005 period, there was lower debt variation relative to GDP, and this corresponds to regions that assume a greater degree of power. Finally, in Germany, the CITYSTATE variable is positive, coinciding with expectations. City-states present higher levels of debt variation relative to GDP due to limited resources available for the provision of certain services, due to the no existence of scale economies.
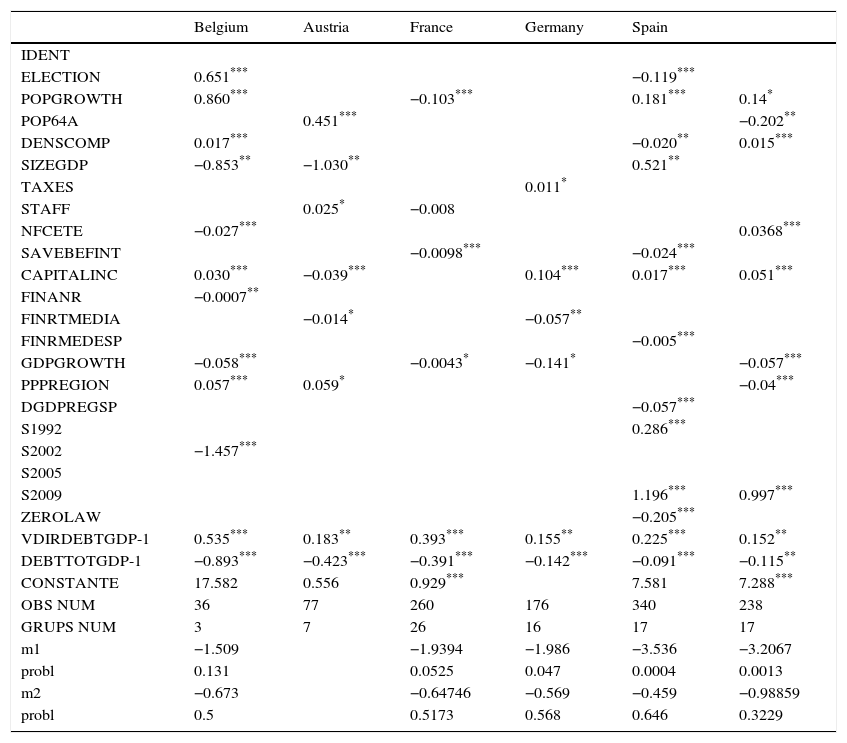
For each panel sample, we produced a dynamic model using the Arellano-Bond estimator (Table 10). In this case, we include lagged variables, catering to its dynamic nature.
Estimation results of the dynamic model (Arellano-Bond).
| Belgium | Austria | France | Germany | Spain | ||
|---|---|---|---|---|---|---|
| IDENT | ||||||
| ELECTION | 0.651*** | −0.119*** | ||||
| POPGROWTH | 0.860*** | −0.103*** | 0.181*** | 0.14* | ||
| POP64A | 0.451*** | −0.202** | ||||
| DENSCOMP | 0.017*** | −0.020** | 0.015*** | |||
| SIZEGDP | −0.853** | −1.030** | 0.521** | |||
| TAXES | 0.011* | |||||
| STAFF | 0.025* | −0.008 | ||||
| NFCETE | −0.027*** | 0.0368*** | ||||
| SAVEBEFINT | −0.0098*** | −0.024*** | ||||
| CAPITALINC | 0.030*** | −0.039*** | 0.104*** | 0.017*** | 0.051*** | |
| FINANR | −0.0007** | |||||
| FINRTMEDIA | −0.014* | −0.057** | ||||
| FINRMEDESP | −0.005*** | |||||
| GDPGROWTH | −0.058*** | −0.0043* | −0.141* | −0.057*** | ||
| PPPREGION | 0.057*** | 0.059* | −0.04*** | |||
| DGDPREGSP | −0.057*** | |||||
| S1992 | 0.286*** | |||||
| S2002 | −1.457*** | |||||
| S2005 | ||||||
| S2009 | 1.196*** | 0.997*** | ||||
| ZEROLAW | −0.205*** | |||||
| VDIRDEBTGDP-1 | 0.535*** | 0.183** | 0.393*** | 0.155** | 0.225*** | 0.152** |
| DEBTTOTGDP-1 | −0.893*** | −0.423*** | −0.391*** | −0.142*** | −0.091*** | −0.115** |
| CONSTANTE | 17.582 | 0.556 | 0.929*** | 7.581 | 7.288*** | |
| OBS NUM | 36 | 77 | 260 | 176 | 340 | 238 |
| GRUPS NUM | 3 | 7 | 26 | 16 | 17 | 17 |
| m1 | −1.509 | −1.9394 | −1.986 | −3.536 | −3.2067 | |
| probl | 0.131 | 0.0525 | 0.047 | 0.0004 | 0.0013 | |
| m2 | −0.673 | −0.64746 | −0.569 | −0.459 | −0.98859 | |
| probl | 0.5 | 0.5173 | 0.568 | 0.646 | 0.3229 | |
Notes:
Among the estimates, most of coefficients are significant and have the expected sign, as seen in the static regressions, except PPPREGION for Belgium (positive sign in dynamic specification) and ZEROLAW for Spain (negative sign in dynamic specification). The lagged dependent variable for one period has a positive sign with a coefficient of less than one for all countries, and thus, there is certain degree of debt variation inertia. The debt stock variable relative to GDP has a negative sign, reflecting a natural tendency toward fiscal consolidation. These results are in line with theory and previous studies.
Below, we estimate representative models for aggregate debt determinants, i.e., for a sample in which data for the six countries are analyzed together. First, the period analyzed corresponds to the common denominator of the series longitude for each of the studied countries, thus bounding the period to 1999–2010. Second, variables that are common to all specifications are selected, taking outstanding debt variation relative to GDP as the dependent variable. Finally, we add five dummies representing each country with the exception of Spain to absorb differential factors. For panel data estimations, the group variable is the region itself, and the time variable is the corresponding year.
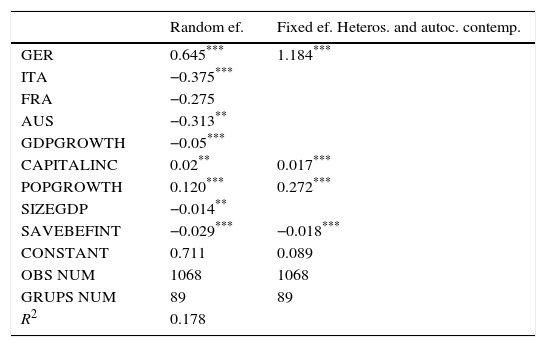
Thus, a panel of 1068 observations and 89 regions is generated, from which static and dynamic specifications are conducted. For the former, we selected two that generate the best results. The first is characterized by random effects of robust estimation without serial autocorrelation, and the other includes fixed effects that apply the generalized feasible least squares estimator due to the presence of contemporary autocorrelation and heteroskedasticity. As none of these specifications present endogeneity, these estimates can be confirmed with instrumental variables via the Haussman test (Table 11). As for the dynamic specifications, using the Arellano-Bond method, none have been adequate. Once estimates were performed, the coefficients of significant variables reflected the expected sign, except for that representing the relative size in terms of GDP, which was expected to have a positive sign (“too big to fail”). This may be because larger entities, apart from being able to take on more debt due to central government support, have larger scale economies than smaller regions, thus generating less expenditure and less debt variation.
Estimation results of total regions.
| Random ef. | Fixed ef. Heteros. and autoc. contemp. | |
|---|---|---|
| GER | 0.645*** | 1.184*** |
| ITA | −0.375*** | |
| FRA | −0.275 | |
| AUS | −0.313** | |
| GDPGROWTH | −0.05*** | |
| CAPITALINC | 0.02** | 0.017*** |
| POPGROWTH | 0.120*** | 0.272*** |
| SIZEGDP | −0.014** | |
| SAVEBEFINT | −0.029*** | −0.018*** |
| CONSTANT | 0.711 | 0.089 |
| OBS NUM | 1068 | 1068 |
| GRUPS NUM | 89 | 89 |
| R2 | 0.178 |
Notes:
The country dummies were found to be significant with the exception of France, suggesting an upward bias in debt variation relative to GDP in German Landers and a negative bias in Italian and Austrian regions. The real GDP growth variable is significant with a negative sign, reflecting the counter-cyclical nature of regional budgets in European countries. Net capital expenditures relative to operative revenue have a positive sign, suggesting that capital expenditures are usually financed with debt, complying with golden rule. Finally, primary operating balance to operative revenue are significant, presenting a negative sign, suggesting that capital expenditure financing is compensated by a surplus that may be obtained through operative results, and the existence of the fiscal illusion.
Finally, the annual population percentage growth variable is significant and has a positive sign. Regions of greater demographic growth experience higher expenditure pressures that are not compensated by higher revenue, forcing them into higher debt levels in the future.
5ConclusionsAdministrative decentralization processes in Europe have broadly afforded regions with authority for healthcare, education and social services, i.e., welfare state services, in the majority of European countries. Based on the pace of decentralization, most of local and regional public expenditures rest within the 24.5–12% range measured in terms of GDP. The most indebted European regions, both at absolute and relative scales, are German, which, together with their Spanish peers, have used capital markets mainly to finance deficits.
A comparative analysis of institutional frameworks in Europe shows that relationships between central and sub-central tax authorities have common traits, although the extent of change in each country remains unknown. Almost all countries follow sub-sovereign fiscal rules, stability laws, domestic stability plans, equalization systems on the revenue side across regions, no bail-out clause, and comply with the golden rule that debt should be dedicated to investment.
Both static and dynamic specifications for the six countries analyzed are consistent and explain well the factors that influence the evolution of the debt, but being dynamic specifications the best for the debt determinants.
In determining variables that significantly affect the appearance of deficits in European sub-sovereigns, a database for each country was constructed, followed by a joint database for all European countries. Using panel data and a set of estimations, both dynamic and static, it was found that regional European government deficit determinants follow a common pattern, with some minor differences, and that variable signs coincide with expectations, pursuant to previous studies and the theory.
This study shows that sub-sovereign government budgets are counter-cyclical, that economies of scale are present, which the golden rule of public finance is followed, that population growth and lower per capita financing lead to higher debt levels; the existence of fiscal illusion and inertial of deficits; and that regions characterized by higher debt/GDP ratios tend to have lower future deficits, according to the theory and the former articles.
However, there are some variables that either are not significant or with a sign no expected. The effect of the tax co-responsibility (TAXES) on the debt depends on the country: In Spain the sign is negative according to the theory and the previous articles and therefore it illustrates the more transparency less debt; but in Austria and Germany the sign is positive. The introduction of more restrictive tax rules in some countries have not complied their target and in almost all the political variables have not had any influence in debt variation.
Furthermore, POP64 and PPPREGION sign also depends on the country. In the first variable the sign is positive In Belgium and Austria, explaining more aged region have more debt pursuant to the theory, but not in the case of Italy, France, Germany and Spain. In the second one, in Italy, Austria and Belgium (dynamic specification) the variable sign is positive according to the theory.
Variable change sensitivity is found to vary across countries: GDP growth is more sensitive in Germany and Belgium. Budgetary variables, such as investment that is not financed with capital revenue, primary operating balance and per capita financing, are more sensitive in Germany; population growth and real per capita revenue at purchasing power parity are more variable in Austria; and the deficit inertia effect and stock debt/GDP reducing effect are more significant in Belgium. Using deficit estimates, demographic and financing variables and mean variable values, Austria, Germany and Spain were found to exhibit the greatest degree of variability between regions, i.e., where models are theoretically the worst calibrated.

