


The aim of this study is to evaluate the impact of Knowledge Management (KM) adoption on the Supply Chain (SC) performance. This paper proposes a framework based on balanced scorecard (BSC) and fuzzy Analytical network process (FANP) to evaluate the impact of KM adoption on SC performance. The BSC integrates financial and non-financial SC performance measures around the four perspectives: customer, internal business process, learning and growth, and financial. The FANP establishes the interaction among KM adoption in SC enablers, BSC perspectives, and SC performance to evaluate the SC performance. The empirical case study of an Indian organization is conducted to demonstrate the use of the proposed framework. This study has evaluated the results of the SC performance before and after KM adoption in SC. It shows the positive impact of KM adoption on SC performance. Finally, it examines the robustness of the model through sensitivity analysis.
Supply Chain (SC) is a set of organizations directly and indirectly interlinked and interacted to transform inputs into outputs for efficient delivery to the end customer (Elgazzar, Tipi, Hubbard, & Leach, 2012). A highly efficient SC would bring great benefits to organizations such as integrated resources, reduced logistics and high quality of overall level of services (Fan, Zhang, Wang, Yang, & Hapeshi, 2013). Effective SC relies on information integration and implementation of best practice across the chain (Agrell & Hatami-Marbini, 2013). SC is no longer confined to the study of logistics, information flow and cash flow. The efficient knowledge flows and knowledge sharing process among SC partners ensure agility, adaptability, and alignment in the chain (Lee, 2004). Knowledge transfer improves the performance of SC organizations (He, Ghobadin, & Gallear, 2013; Lawson, Petersen, Cousins, & Handfield, 2009). Knowledge Management (KM) is a systematic, organized, explicit and deliberate ongoing process of creating, disseminating, applying, renewing and updating the knowledge for achieving organizational objectives (Pillania, 2008). KM is a major enabler of SC, and is a critical element in the information intensive and multi-cultured enterprise environments (Marra, Ho, & Edwards, 2011).
KM adoption in SC is recognized as an important source of competitive advantage. There has been increasing academic and practitioner interest in understanding and isolating the factors that contribute to effective knowledge transfer between SC actors (He et al., 2013). The KM adoption in SC enables a collaborative environment for the chain to be more adaptive and responsive for achieving an improved strategic competitive position in the market place. KM enabled SC members can provide a guarantee for the chain members to access the external knowledge, but also it is helpful to improve overall competitiveness of the SC (Lia & Hu, 2012).
1.1Research motiveAlthough the large number of researchers emphasized on the importance of performance measuring and providing approaches and methods, there is a lack of a comprehensive model to link the strategy to the SC performance measures (Najmi & Makui, 2012). SC performance measurement is still a fruitful research area and there is the need of further research (Akyuz & Erkan, 2010). In order to manage and improve the SC, many organizations have adopted KM in their SC to gain more competitive advantages against their competitors. After making such a big investment in resources for KM adoption organizations should ask themselves in what aspects of performances they are trying to improve and how performances should be measured.
There is a lack of studies measuring the impact of KM practices on the SC performance (Marra et al., 2011). Measuring KM enabled SC performance can facilitate a better understanding of the influence of KM adoption on SC performance. It needs that effective performance measurements to be established and hence, a SC performance measurement framework to evaluate the impact of KM adoption in SC is required.
1.2Research objectiveThe objective of this study is to explore the SC performance measures and evaluate the impact of KM adoption on SC performance.
Evaluating SC performance is a complex undertaking, in part because this is a transversal process involving several actors cooperating to achieve given organizational objectives (Estampe, Lamouri, Paris, & Brahim-Djelloul, 2013). In the assessment of SC performance based on KM adoption, it is crucial to understand how KM adoption contributes to improve SC performance. The SC evaluation that relies on financial measures alone is not suitable. The balanced scorecard (BSC) is a good performance assessment framework developed by Kaplan and Norton (1992, 1993, 1996a, 1996b) to provide holistic consideration of financial and non-financial measures. The Analytical Network Process (ANP) in turn provides a structure and process that guide the decision maker in weighing the various KM adoption in SC enabler's perspectives, BSC perspectives and SC performance measures to achieve the stated objectives (Sevkli et al., 2012; Tavana, Momeni, Rezaeiniya, Mirhedayatian, & Rezaeiniya, 2013; Tjader, Maya, Shang, Vargas, & Gao, 2013). Since fuzziness and vagueness are common characteristics in many decision making problems, a fuzzy ANP (FANP) method is able to tolerate vagueness and ambiguity. Hence this study proposes BSC-FANP approach to evaluate the impact of KM adoption on SC performance.
The organization of the paper is as follows. In Section 2 we reviewed the KM adoption in SC and SC performance measures literature. The BSC and fuzzy ANP methods are presented in Section 3. This section also covered the literature that utilizes the integrated BSC and ANP models. The Proposed BSC-FANP framework to determine the performance level of SC based on KM adoption in SC is described in Section 4. The empirical case study is conducted and described in Section 5. The result and discussion along with sensitivity analysis are presented in Section 6. Finally, the conclusion is discussed in Section 7.
2Literature review2.1KM adoption in SCThe process of knowledge creation transfer and reuse that consists of capturing a part of tacit knowledge and transforming it into explicit knowledge that can be acquired and reused by SC members is called KM adoption in SC (Samuel, Goury, Gunasekaran, & Spalanzani, 2011). KM adoption in SC has become an essential factor for the organizations to improve their core competitiveness (Yang & Jiang, 2005). A strong positive relationship was found between KM process and organizational performance (Fugate, Stank, & Mentzer, 2009). Knowledge capture and knowledge sharing improve the SC integration and the production efficiency (Khalfan, Kashyap, Li, & Abbott, 2010).
The interaction between a culture of competitiveness and knowledge development has a positive association with SC performance. The development of knowledge-based SC depends on the nature of knowledge flow in the entire chain which in turn helps to maintain customer responsiveness. SC partners will find it very useful to share decision knowledge on a timely basis. However this requires changes in managerial mindsets and corporate culture. Furthermore, support and commitment from top management are essential to ensure successful implementation of knowledge sharing (Shih, Hsu, Zhu, & Balasubramanian, 2012). Knowledge exchange within SC adds value to the SC as it improves efficiency as well as financial SC performance (Kim, Umanathb, Kim, Ahrensc, & Kim, 2012; Paton & McLaughlin, 2008).
Knowledge development capacity is a good complement for other SC strategies (Craighead, Tomas, Hult, & Ketchen, 2009) as well as the order entry method. There is a link between relational variables such as trust, communication, commitment, and performance. Those characteristics lead to greater collaboration among SC partners and help to maintain the buyer–supplier partnership (Spekman, Spear, & Kamauff, 2002). To enhance the benefits of cooperation and to diminish the conflicts of competition when knowledge sharing is involved, organizations should develop trust-based relationships by focusing on activities that would enhance mutual trust (Cheng, Yeh, & Tu, 2008). It will be useful to minimize the SC response time and purchased order cycle time. By exploring Decision Knowledge sharing flexibility in SC structure and operational performance can be achieved (Wadhwa & Saxena, 2006).
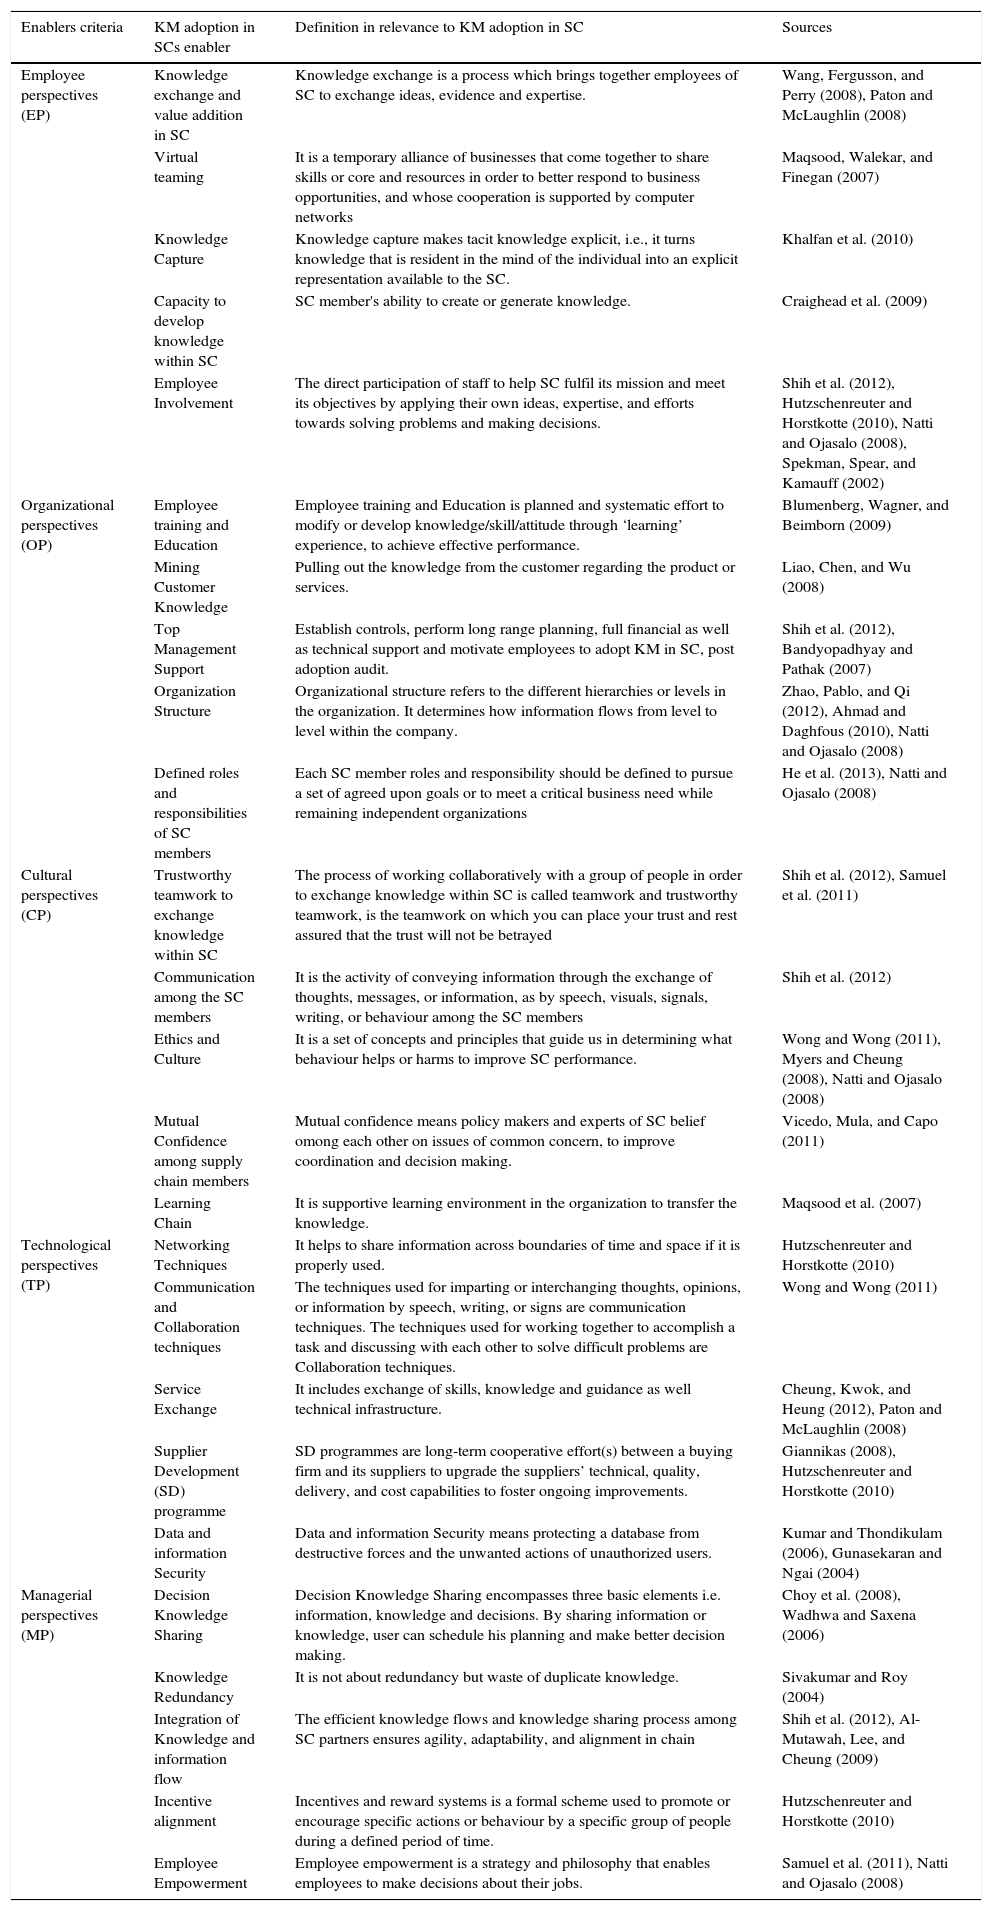
Total 25 enablers of KM adoption in SC are identified through an extensive literature review and categorized into five perspectives. These perspectives are employee perspectives (EP), organizational perspectives (OP), cultural perspectives (CP), technological perspectives (TP) and managerial perspectives (MP). Table 1 summarizes the enablers of KM adoption in SC.
KM adoption in SC enablers (strategies) and its criteria (perspectives).
| Enablers criteria | KM adoption in SCs enabler | Definition in relevance to KM adoption in SC | Sources |
|---|---|---|---|
| Employee perspectives (EP) | Knowledge exchange and value addition in SC | Knowledge exchange is a process which brings together employees of SC to exchange ideas, evidence and expertise. | Wang, Fergusson, and Perry (2008), Paton and McLaughlin (2008) |
| Virtual teaming | It is a temporary alliance of businesses that come together to share skills or core and resources in order to better respond to business opportunities, and whose cooperation is supported by computer networks | Maqsood, Walekar, and Finegan (2007) | |
| Knowledge Capture | Knowledge capture makes tacit knowledge explicit, i.e., it turns knowledge that is resident in the mind of the individual into an explicit representation available to the SC. | Khalfan et al. (2010) | |
| Capacity to develop knowledge within SC | SC member's ability to create or generate knowledge. | Craighead et al. (2009) | |
| Employee Involvement | The direct participation of staff to help SC fulfil its mission and meet its objectives by applying their own ideas, expertise, and efforts towards solving problems and making decisions. | Shih et al. (2012), Hutzschenreuter and Horstkotte (2010), Natti and Ojasalo (2008), Spekman, Spear, and Kamauff (2002) | |
| Organizational perspectives (OP) | Employee training and Education | Employee training and Education is planned and systematic effort to modify or develop knowledge/skill/attitude through ‘learning’ experience, to achieve effective performance. | Blumenberg, Wagner, and Beimborn (2009) |
| Mining Customer Knowledge | Pulling out the knowledge from the customer regarding the product or services. | Liao, Chen, and Wu (2008) | |
| Top Management Support | Establish controls, perform long range planning, full financial as well as technical support and motivate employees to adopt KM in SC, post adoption audit. | Shih et al. (2012), Bandyopadhyay and Pathak (2007) | |
| Organization Structure | Organizational structure refers to the different hierarchies or levels in the organization. It determines how information flows from level to level within the company. | Zhao, Pablo, and Qi (2012), Ahmad and Daghfous (2010), Natti and Ojasalo (2008) | |
| Defined roles and responsibilities of SC members | Each SC member roles and responsibility should be defined to pursue a set of agreed upon goals or to meet a critical business need while remaining independent organizations | He et al. (2013), Natti and Ojasalo (2008) | |
| Cultural perspectives (CP) | Trustworthy teamwork to exchange knowledge within SC | The process of working collaboratively with a group of people in order to exchange knowledge within SC is called teamwork and trustworthy teamwork, is the teamwork on which you can place your trust and rest assured that the trust will not be betrayed | Shih et al. (2012), Samuel et al. (2011) |
| Communication among the SC members | It is the activity of conveying information through the exchange of thoughts, messages, or information, as by speech, visuals, signals, writing, or behaviour among the SC members | Shih et al. (2012) | |
| Ethics and Culture | It is a set of concepts and principles that guide us in determining what behaviour helps or harms to improve SC performance. | Wong and Wong (2011), Myers and Cheung (2008), Natti and Ojasalo (2008) | |
| Mutual Confidence among supply chain members | Mutual confidence means policy makers and experts of SC belief omong each other on issues of common concern, to improve coordination and decision making. | Vicedo, Mula, and Capo (2011) | |
| Learning Chain | It is supportive learning environment in the organization to transfer the knowledge. | Maqsood et al. (2007) | |
| Technological perspectives (TP) | Networking Techniques | It helps to share information across boundaries of time and space if it is properly used. | Hutzschenreuter and Horstkotte (2010) |
| Communication and Collaboration techniques | The techniques used for imparting or interchanging thoughts, opinions, or information by speech, writing, or signs are communication techniques. The techniques used for working together to accomplish a task and discussing with each other to solve difficult problems are Collaboration techniques. | Wong and Wong (2011) | |
| Service Exchange | It includes exchange of skills, knowledge and guidance as well technical infrastructure. | Cheung, Kwok, and Heung (2012), Paton and McLaughlin (2008) | |
| Supplier Development (SD) programme | SD programmes are long-term cooperative effort(s) between a buying firm and its suppliers to upgrade the suppliers’ technical, quality, delivery, and cost capabilities to foster ongoing improvements. | Giannikas (2008), Hutzschenreuter and Horstkotte (2010) | |
| Data and information Security | Data and information Security means protecting a database from destructive forces and the unwanted actions of unauthorized users. | Kumar and Thondikulam (2006), Gunasekaran and Ngai (2004) | |
| Managerial perspectives (MP) | Decision Knowledge Sharing | Decision Knowledge Sharing encompasses three basic elements i.e. information, knowledge and decisions. By sharing information or knowledge, user can schedule his planning and make better decision making. | Choy et al. (2008), Wadhwa and Saxena (2006) |
| Knowledge Redundancy | It is not about redundancy but waste of duplicate knowledge. | Sivakumar and Roy (2004) | |
| Integration of Knowledge and information flow | The efficient knowledge flows and knowledge sharing process among SC partners ensures agility, adaptability, and alignment in chain | Shih et al. (2012), Al-Mutawah, Lee, and Cheung (2009) | |
| Incentive alignment | Incentives and reward systems is a formal scheme used to promote or encourage specific actions or behaviour by a specific group of people during a defined period of time. | Hutzschenreuter and Horstkotte (2010) | |
| Employee Empowerment | Employee empowerment is a strategy and philosophy that enables employees to make decisions about their jobs. | Samuel et al. (2011), Natti and Ojasalo (2008) |
Performance measurement is defined as the process of quantifying the effectiveness and efficiency of action (Chan, Qi, Chan, Lau, & Ip, 2003). Organizations have realized that monitoring and understanding SC performances have become essential to compete in continuously changing environments (Taticchi, Tonelli, & Cagnazzo, 2010). This section summarizes research related to the performance measurement at the SC, not an individual organization.
SC measures can be used in the decision making process, help to define, test and implement new strategies (Gunasekaran, Patel, & Tirtiroglu, 2001). Selecting the appropriate performance measures is challenging, due to the inherent complexity and the SC interdependence (Flynn, Huo, & Zhao, 2010). Many authors discuss the financial indicator as the only performance measures and organizations continue to use financial performance measures. Beamon (1999) suggested that SC performance measurement should include operational indicators, such as customer service and the ability to respond to a changing environment. Neely, Gregory, and Platts (1995) listed cost, time, quality, delivery and flexibility as important measures of operational performance. Now organizations realize the importance of financial and non-financial performance measures; however, they fail to represent them in a balanced framework (Gunasekaran et al., 2001; Gunasekaran, Patel, & McGaughey, 2004).
Three main classes of performance measures are discussed by Martin and Patterson (2009): inventory, cycle time and finances. Gunasekaran and Kobu (2007) offer a comprehensive review and classification for SC measurement and metrics. They treat a number of metrics in five classes: order planning, supplier evaluation, production level, delivery and customer. Sodhi and Son (2009) have modelled the strategic as well as the operational dimension of performance of supplier–retailer partnerships in terms of five factors, including: information exchange, trust, joint partnership management, relationship-specific assets and partner asymmetry.
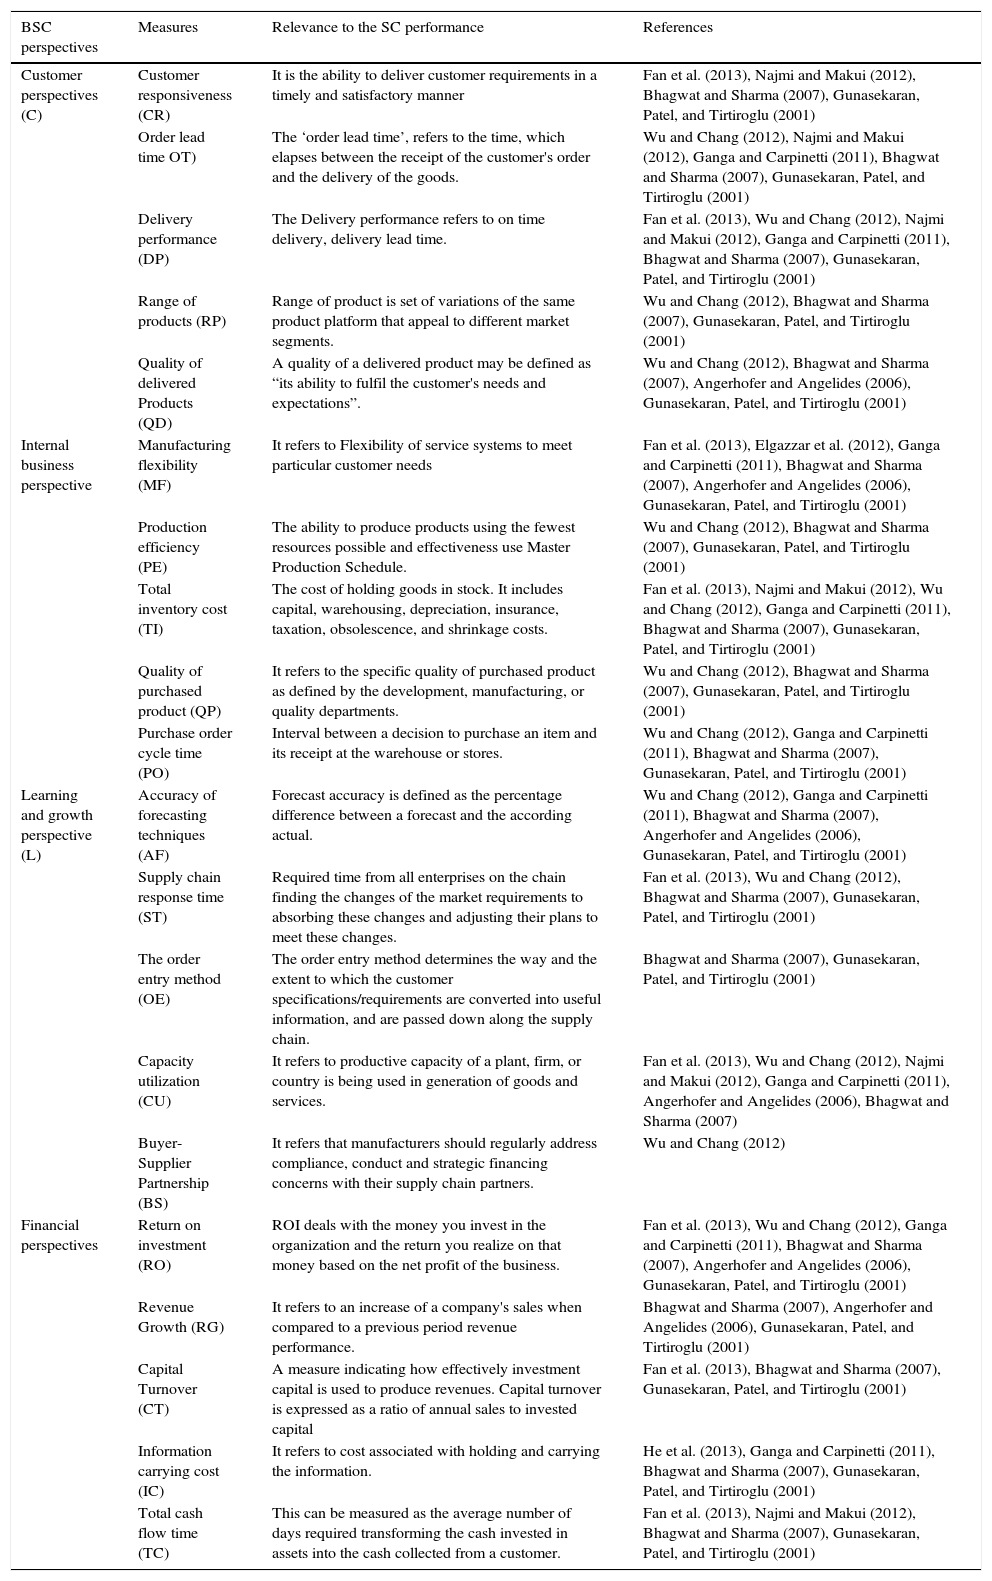
Ou, Fang, Hung, and David (2010) investigated the relationships among SC management practices and their impacts on organizational financial and non-financial performances. In this regard, they considered seven factors, namely, human resource, quality data and reporting, design management, process management, internal operational performance, customer satisfaction and organizational financial performance. For SC performance measurement, measurement goals should be set in accordance with the organizational strategy. Performance criteria should be coordinated and evaluated based on the organization's strategy (Najmi & Makui, 2012). Through literature review total 25 SC performance measures were identified and after discussion with an expert team these measures were finalized as SC performance measures for this study. These SC performance measures along with its relevance are presented in Table 2.
BSC perspectives and SC performance measures.
| BSC perspectives | Measures | Relevance to the SC performance | References |
|---|---|---|---|
| Customer perspectives (C) | Customer responsiveness (CR) | It is the ability to deliver customer requirements in a timely and satisfactory manner | Fan et al. (2013), Najmi and Makui (2012), Bhagwat and Sharma (2007), Gunasekaran, Patel, and Tirtiroglu (2001) |
| Order lead time OT) | The ‘order lead time’, refers to the time, which elapses between the receipt of the customer's order and the delivery of the goods. | Wu and Chang (2012), Najmi and Makui (2012), Ganga and Carpinetti (2011), Bhagwat and Sharma (2007), Gunasekaran, Patel, and Tirtiroglu (2001) | |
| Delivery performance (DP) | The Delivery performance refers to on time delivery, delivery lead time. | Fan et al. (2013), Wu and Chang (2012), Najmi and Makui (2012), Ganga and Carpinetti (2011), Bhagwat and Sharma (2007), Gunasekaran, Patel, and Tirtiroglu (2001) | |
| Range of products (RP) | Range of product is set of variations of the same product platform that appeal to different market segments. | Wu and Chang (2012), Bhagwat and Sharma (2007), Gunasekaran, Patel, and Tirtiroglu (2001) | |
| Quality of delivered Products (QD) | A quality of a delivered product may be defined as “its ability to fulfil the customer's needs and expectations”. | Wu and Chang (2012), Bhagwat and Sharma (2007), Angerhofer and Angelides (2006), Gunasekaran, Patel, and Tirtiroglu (2001) | |
| Internal business perspective | Manufacturing flexibility (MF) | It refers to Flexibility of service systems to meet particular customer needs | Fan et al. (2013), Elgazzar et al. (2012), Ganga and Carpinetti (2011), Bhagwat and Sharma (2007), Angerhofer and Angelides (2006), Gunasekaran, Patel, and Tirtiroglu (2001) |
| Production efficiency (PE) | The ability to produce products using the fewest resources possible and effectiveness use Master Production Schedule. | Wu and Chang (2012), Bhagwat and Sharma (2007), Gunasekaran, Patel, and Tirtiroglu (2001) | |
| Total inventory cost (TI) | The cost of holding goods in stock. It includes capital, warehousing, depreciation, insurance, taxation, obsolescence, and shrinkage costs. | Fan et al. (2013), Najmi and Makui (2012), Wu and Chang (2012), Ganga and Carpinetti (2011), Bhagwat and Sharma (2007), Gunasekaran, Patel, and Tirtiroglu (2001) | |
| Quality of purchased product (QP) | It refers to the specific quality of purchased product as defined by the development, manufacturing, or quality departments. | Wu and Chang (2012), Bhagwat and Sharma (2007), Gunasekaran, Patel, and Tirtiroglu (2001) | |
| Purchase order cycle time (PO) | Interval between a decision to purchase an item and its receipt at the warehouse or stores. | Wu and Chang (2012), Ganga and Carpinetti (2011), Bhagwat and Sharma (2007), Gunasekaran, Patel, and Tirtiroglu (2001) | |
| Learning and growth perspective (L) | Accuracy of forecasting techniques (AF) | Forecast accuracy is defined as the percentage difference between a forecast and the according actual. | Wu and Chang (2012), Ganga and Carpinetti (2011), Bhagwat and Sharma (2007), Angerhofer and Angelides (2006), Gunasekaran, Patel, and Tirtiroglu (2001) |
| Supply chain response time (ST) | Required time from all enterprises on the chain finding the changes of the market requirements to absorbing these changes and adjusting their plans to meet these changes. | Fan et al. (2013), Wu and Chang (2012), Bhagwat and Sharma (2007), Gunasekaran, Patel, and Tirtiroglu (2001) | |
| The order entry method (OE) | The order entry method determines the way and the extent to which the customer specifications/requirements are converted into useful information, and are passed down along the supply chain. | Bhagwat and Sharma (2007), Gunasekaran, Patel, and Tirtiroglu (2001) | |
| Capacity utilization (CU) | It refers to productive capacity of a plant, firm, or country is being used in generation of goods and services. | Fan et al. (2013), Wu and Chang (2012), Najmi and Makui (2012), Ganga and Carpinetti (2011), Angerhofer and Angelides (2006), Bhagwat and Sharma (2007) | |
| Buyer-Supplier Partnership (BS) | It refers that manufacturers should regularly address compliance, conduct and strategic financing concerns with their supply chain partners. | Wu and Chang (2012) | |
| Financial perspectives | Return on investment (RO) | ROI deals with the money you invest in the organization and the return you realize on that money based on the net profit of the business. | Fan et al. (2013), Wu and Chang (2012), Ganga and Carpinetti (2011), Bhagwat and Sharma (2007), Angerhofer and Angelides (2006), Gunasekaran, Patel, and Tirtiroglu (2001) |
| Revenue Growth (RG) | It refers to an increase of a company's sales when compared to a previous period revenue performance. | Bhagwat and Sharma (2007), Angerhofer and Angelides (2006), Gunasekaran, Patel, and Tirtiroglu (2001) | |
| Capital Turnover (CT) | A measure indicating how effectively investment capital is used to produce revenues. Capital turnover is expressed as a ratio of annual sales to invested capital | Fan et al. (2013), Bhagwat and Sharma (2007), Gunasekaran, Patel, and Tirtiroglu (2001) | |
| Information carrying cost (IC) | It refers to cost associated with holding and carrying the information. | He et al. (2013), Ganga and Carpinetti (2011), Bhagwat and Sharma (2007), Gunasekaran, Patel, and Tirtiroglu (2001) | |
| Total cash flow time (TC) | This can be measured as the average number of days required transforming the cash invested in assets into the cash collected from a customer. | Fan et al. (2013), Najmi and Makui (2012), Bhagwat and Sharma (2007), Gunasekaran, Patel, and Tirtiroglu (2001) |
The BSC concept is based on the assumption that competitive advantages are not only derived from quantifiable “hard facts” referring primarily to the efficient use of fixed capital, but that also rather “soft” and intangible assets like intellectual property, employees’ knowledge and abilities or customer relationships have to be measured and managed. The balanced scorecard methodology by Kaplan and Norton (1993, 1996a), rooted in their 1993 work, still lies at the heart of today's performance management system (Akyuz & Erkan, 2010). The BSC model is more than a collection of financial and non-financial measurements, and represents a translation of business unit strategy into a linked set of measures that define both long-term strategic objectives and the mechanisms for achieving and obtaining feedback regarding those objectives (Kaplan & Norton, 1996a).
It seeks balanced measures to buttress organization strategy. BSC is widely adopted because of its simplicity, clear objective definition and comprehensiveness (Fan et al., 2013). BSC approach comprises four perspectives: customer, internal business process, learning and growth, and financial (Kaplan & Norton, 1993, 1996a, 1996b).
The objective of this study is to measure the SC performance; with respect to this objective relevance of the BSC perspectives is as follows:
• Customer perspective: Customers are mainly concerned about time, quality, service, and cost of offerings; thus, it is important to understand how a SC is performing against these criteria from their customers’ point of view. The task is to evaluate what they really value, today and in the future, and translate this into value propositions that lead to customer satisfaction and retention. This perspective asks (Kaplan & Norton, 1996a): “To achieve our vision, how should we appear to our customers?”
• Internal business process perspective: It defines what the SC must do to provide attractive customer value propositions and realize an adequate financial performance for shareholders. The question is (Kaplan & Norton, 1996a): “To satisfy our shareholders and customers, what business processes must we excel at?”
• Learning and growth: The ability of SC learning is based on employees, information technology (IT) systems and organizational quality. The innovation and learning perspective identifies the infrastructure underlying the other three perspectives. This infrastructure is crucial to make a SC become a learning chain. It asks (Kaplan & Norton, 1996a): “To achieve our vision, how will we sustain our ability to change and improve?”
• Financial perspective: In the hierarchical BSC concept all perspectives are directed towards the financial perspective of which measures control for bottom-line improvements through strategy implementation and execution. The objectives and measures refer to return on investment, revenue growth and cash flow generation.
The SC performance measures identified through literature review (Section 2.2) fitted into these four BSC perspectives are listed in Table 2.
3.2Fuzzy setsDecision making is very difficult for vague and uncertain environment. This vagueness and uncertainty can be handled by using fuzzy set theory, which was proposed by Zadeh (1965). A fuzzy set is defined by a membership function that maps elements to degrees of membership within a certain interval, which is usually [0,1]. If the value assigned is zero, the element does not belong to the set (it has no membership). If the value assigned is one, the element belongs completely to the set (it has total membership). Finally, if the value lies within the interval, the element has a certain degree of membership.
In particular, to tackle the ambiguities involved in the process of linguistic estimation, it is a beneficial way to convert these linguistic terms into fuzzy numbers. In practice, linguistic values can be represented by fuzzy numbers, and the TFN is commonly used. TFN represented with three points of triangular element. A character tilde “∼” is placed above a symbol if the symbol represents a fuzzy set. In the following, we briefly review some essential definitions of fuzzy logic.Definition 1 A fuzzy set A˜ is a subset of a universe of discourse X, which is a set of ordered pairs and is characterized by a membership function uA˜(x) representing a mapping uA˜:x→[0,1]. The function value of for the fuzzy set A˜ is called the membership value of x in A˜, which represents the degree of truth that x is an element of the fuzzy set A˜. It is assumed that uA˜(x)∈[0,1], where uA˜(x)=1 reveals that x completely belongs to A˜, while uA˜(x)=0 indicates that x does not belong to the fuzzy set A˜.

A fuzzy set A˜ of the universe of discourse X is convex if
Definition 3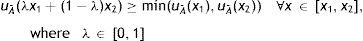
A fuzzy set A˜ of the universe of discourse X is normal if
Definition 4
A fuzzy number N˜ is a fuzzy subset in the universe of discourse X, which is both convex and normal.
Definition 5The α-cut of the fuzzy set A˜ of the universe of discourse X is defined as
Definition 6
It is a TFN if the membership function uA˜(x) of fuzzy set A˜=(l,m,u) in universe X is defined as follows, where l,m,u are real numbers and l≤m≤u
Definition 7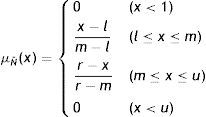
Alternatively, by defining the interval of confidence level α, the TFN can be characterized using the following equation:
Definition 8
Suppose a=(a1, a2, a3) and b=(b1, b2, b3) are two TFNs, the distance between them is calculated as
3.3Fuzzy ANP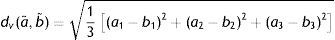
ANP is a general form of the analytical hierarchy process (AHP) first introduced by Saaty (1996). While the AHP employs a unidirectional hierarchical relationship among decision levels, the ANP enables interrelationships among the decision levels and attributes in a more general form. The purpose of the ANP approach is to solve problems involving interdependence and feedback among criteria or alternative solutions (Chen & Chen, 2010). The ANP is a coupling of two parts, where the first consists of a control hierarchy or network of criteria and sub-criteria that controls the interactions, while the second part is a network of influences among the elements and clusters. In fact, ANP uses a network without a need to specify levels as in a hierarchy (Hung, 2011; Saaty, 1996; Tsai & Chou, 2009).
The inability of ANP to deal with the imprecise or uncertain judgments has been removed in fuzzy ANP (Tavana et al., 2013). Instead of a crisp value, fuzzy ANP applies a range of values to incorporate the decision maker's imprecise or uncertain judgments in the pairwise comparison process. Hence fuzzy ANP was used in this study. Recent applications of the fuzzy ANP are: Activity-based divergent SC planning (Hung, 2011), strategy selection in the airline industry (Sevkli et al., 2012), Shipyard location selection (Guneri, Cengiz, & Seker, 2009), performance evaluation of Taiwanese higher education (Chen & Chen, 2010), ERP software selection (Ayag & Ozdemir, 2007) and social media platform selection (Tavana et al., 2013).
3.4Applications of BSC-ANP modelsThis research is a new application of integrated BSC-ANP approach to evaluate the impact of KM adoption in SC. In order to place the contribution of this paper into proper background, it is necessary to understand previous research that has utilized the BSC-ANP approach in other areas. Table 3 shows the comparisons of previous studies that have combined the BSC and ANP. Previous work combining BSC and ANP has the important applications, but none of the previous paper used this combination in the KM adoption in the SC area.
Comparisons of previous studies that have combined the BSC and ANP.
| Study | Context of applications | Method used for analysis | Objectives of the integration of BSC and ANP. |
|---|---|---|---|
| Tjader, Maya, Shang, Vargas, and Gao (2013) | Outsourcing decision making | BSC, ANP | To build a cohesive decision model for determining firm levels IT outsourcing strategy in the Pittsburgh area. |
| Bhattacharya et al. (2013) | Green supply chain performance measurement | collaborative decision-making (CDM), ANP,BSC | To delineate a green supply chain (GSC) performance measurement framework. |
| Viglas, Fitsilis, and Kameas (2011) | Quality management information system | BSC, ANP | To select Quality management information system for large Greek retailer. |
| Hsu et al. (2011) | Sustainability balanced scorecard for the semiconductor industry | BSC, Fuzzy Delphi Method (FDM), ANP | To construct a sustainability BSC for the semiconductor industry. |
| Yüksel and Dagdeviren (2010) | Performance of a manufacturing firm | BSC, ANP | To determine the performance of a manufacturing firm in Ankara. |
| Tsai and Chou (2009) | Management systems for sustainable development in SMEs | Decision making trial and evaluation laboratory (DEMATEL), ANP, zero–one goal programming (ZOOGP), BSC | To select management systems for sustainable development in SMEs. |
| Thakkar, Deshmukh, Gupta, and Shankar (2007) | Real life case company | BSC, ANP, Interpretive Structural Modelling (ISM) | To propose an integrated qualitative and quantitative approach to the development of a BSC for a real life case company KVIC (Khadi and Village Industries Commission, organic food sector, India). |
| Ravi, Shankar, and Tiwari (2005) | Reverse Logistic for end-of-life computers | BSC, ANP | To Analyze alternatives in reverse logistics for end-of-life computers. |
The proposed model BSC-FANP framework to determine the performance level of SC based on KM adoption phased as follows (Fig. 1):

Step 1: Establish cross-functional decision group
Form a decision group of expert panel which comprises senior managers, IT representatives, KM project representatives, senior executives of SC members, and determine the vision.
Step 2: BSC-ANP Model development
In this step, firstly identify and categorize the KM adoption in SCs enablers through literature review and discussion with decision group. These enablers will work as a KM adoption in SC strategies to achieve the vision. Then finalize the BSC perspectives and SC performance measures with respect to BSC perspective through literature review and discussion with decision group. Then, structure the BSC-FANP model hierarchy to achieve the vision. The hierarchy was composed of the components such as Vision, KM adoption in SC enabler's perspectives, BSC perspectives and SC performance measures.
Step 3: Defining scale of relative importance used in the pairwise comparison matrix
In particular, to tackle the ambiguities involved in the process of linguistic estimation, it is a beneficial way to convert these linguistic terms into fuzzy numbers. In practice, linguistic values can be represented by fuzzy numbers, and the Triangular Fuzzy Number (TFN) is commonly used. In this study, the triangular fuzzy numbers (TFNs), 1˜ to 9˜, are utilized to improve the conventional nine-point scaling scheme (Table 4). In order to take the imprecision of human qualitative assessments into consideration, the five TFNs (1˜,3˜,5˜,7˜,9˜) are defined with the corresponding membership function. All attributes and alternatives are linguistically depicted in Fig. 2.
Scale of relative importance used in the pairwise comparison matrix.
| Intensity of importance | Fuzzy number | Linguistic variables | Membership function |
|---|---|---|---|
| 1 | 1˜ | Equally important/preferred | (1, 1, 3) |
| 3 | 3˜ | Weakly important/preferred | (1, 3, 5) |
| 5 | 5˜ | Strongly more important/preferred | (3, 5, 7) |
| 7 | 7˜ | Very strongly important/preferred | (5, 7, 9) |
| 9 | 9˜ | Extremely more important/preferred | (7, 9,11) |

Step 4: Calculate the local weights of KM adoption in SCs enabler's perspectives, BSC perspectives and SC performance measures
- (a)
Fuzzy Pairwise comparison matrix
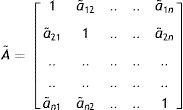
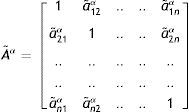
In this step, the decision maker is asked to respond to a series of pairwise comparisons by using TFNs (1˜,3˜,5˜,7˜,9˜), where two KM adoption in SC enablers perspectives at a time are compared with respect to an upper level criterion i.e. vision. These comparisons are made so as to establish the relative importance of enablers perspectives in achieving the vision. A fuzzy comparison matrix A˜ is pairwise comparison.
whereas a˜ij=1, If i equals to j and a˜ij=(1˜,3˜,5˜,7˜,9˜) or 1˜−1,3˜−1,5˜−1,7˜−1,9˜−1 if i is not equal to j. When scoring is conducted for a pair, a reciprocal value is automatically assigned to the reverse comparison within the matrix. That is, if a˜ij is a matrix value assigned to the relationship of component i to component j, then a˜ij is equal to 1/a˜ij. - (b)
Converting the fuzzy comparison matrix into a crisp comparison matrix
Adamo (1980) proposed α-cut method to rank the fuzzy numbers. The α-cut is known to incorporate the experts or decision-maker(s) confidence over his/her preference or the judgments. It will yield an interval set of values from a fuzzy number. For example, α=0.5 will yield a set α0.5=(2,3,4).
While α is fixed, the following α-cut comparison matrix can be obtained from a fuzzy comparison matrix, after setting the index of optimism, μ, in order to estimate the degree of satisfaction.
Degree of satisfaction of the judgement matrix is estimated by the index of optimism μ determined by the decision-maker. The larger value of index μ indicates the highest degree of optimism. The index of optimism is a linear convex combination as defined in the following equation (Lee, Pham, & Zhang, 1999).
The α-cut fuzzy comparison matrix is converted into their crisp comparison matrix A by plugging the value of μ in Eq. (10)
- (c)
Check consistency
The consistency ratio (CR) for each of the matrix and overall inconsistency for the hierarchy are calculated in order to control the results of this method. When the crisp comparison matrix A is consistent, it means the fuzzy comparison matrix A˜ is also consistent. The consistency can be checked as follows:
- (i)
Calculate e-vector and largest Eigen value of the matrix by using Eq. (12)
where w, e-vector (local priority vector); λmax=Largest Eigen value. - (ii)
The Consistency Ratio (CR) is used to estimate directly the consistency of pair wise comparisons. The CR is computed by using Eq. (13)
where CI, consistency index; RI, random index, which is shown in Table 5, n is matrix size.
As a rule, only if the CR≤0.10, the consistency of the matrix is considered as acceptable, otherwise the decision maker is required to revise the original values in the pairwise comparison matrix. This process is repeated for all KM enabler's perspectives, BSC perspectives and SC performance measures (assume that there is no dependence among the BSC perspectives).
- (i)


Step 5: Calculate the global weights of the BSC perspectives
Calculate the global weights of the BSC perspectives by multiplying local weights of the BSC perspectives with KM enabler's perspectives weights.
Step 6: Calculate the interdependent weights of the BSC perspectives
Inner dependence is the relation between elements within the cluster. In this step, decision group is asked to make a pairwise comparison matrix (inner dependence matrix) of each BSC perspective with respect to other BSC perspectives with fuzzy scale (Table 4). Calculate interdependent weights of the BSC perspectives by multiplying the inner dependence matrix with the global weights of the BSC perspectives, which is determined in step 5.
Step 7: Calculate the global weights of the SC performance measure
Calculate the global SC performance measure weights by multiplying local weights of the SC performance measures with interdependent weights of the SC performance measures.
Step 8: Determine the performance of the SC performance measure
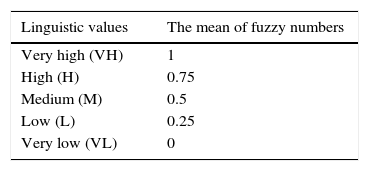
For each SC performance measures the decision group is asked to express their subjective judgments by linguistic variable regarding the performance of the SC performance measures for the specific period (Yüksel & Dagdeviren, 2010). The membership functions of these linguistic variables are shown in Fig. 3, and the average values related to these variables are shown in Table 6.

Step 9: Calculate the SC performance Score
Calculate the SC performance score for a specified period by multiplying the global weights of SC performance measures (step 7) with the linguistic values of SC performance measures (step 8).
5An application of the proposed BSC-FANP framework5.1Problem descriptionNowadays, more and more Indian organizations realize that knowledge plays an important role in business success and KM adoption in SC is becoming a core activity. Few Indian organizations have implemented KM practices in integration with SC. It requires huge investments as well as cultural and strategic changes in the organization. Hence it is essential to measure the impact of KM adoption on SC performance, so, Indian organizations can take the decision about whether to continue the KM adoption in SC or not.
The case organization X adopted KM in their SC. They have invested huge money to implement KM in SC. An Indian organization under study is in confusion about whether to continue the KM adoption in SC or not. CEO of the case organization has interest in evaluating the performance of the KM adoption on SC performance, Hence this organization has been selected for this study.
Organization X is an Indian organization with more than 50 corers and over 150 employees and 26 suppliers and vendors. This organization engages in the design, manufacture and sale of Hydraulic Radial Piston Pumps, Industrial & Mobile Hydraulics Valves and Accessories. Interview technique has been used to collect data from experts.
5.2Case analysisThe implementation of the proposed BSC-FANP framework in the case organization X is presented below.
Step 1: First of all the case organization was formed the cross-functional team consisting of 15 experts which comprise four senior managers, two IT representatives, three KM project representatives, three senior executives of SC members, and three customers and this finalized the vision as “Improve the SC Performance”.
Step 2: In this step, 25 KM adoption in SC enablers was identified on the basis of the literature review and discussion with decision group. These enablers were then clustered into 5 perspectives as employee perspectives (EP), organizational perspectives (OP), cultural perspectives (CP), Technological perspectives (TP) and Managerial perspectives (MP) (see Table 1). These five perspectives were finalized as KM adoption in SC strategies to achieve the vision i.e. to improve the SC performance and the case organization has already implemented these enablers under the KM adoption in SC.
BSC perspectives suggested by Kaplan and Norton (1992) were taken as basis. These BSC perspectives were customer (C), internal business process (I), learning and growth (L) and finance (F). After an extensive literature review and discussion with decision group 25 SC performance measures were finalized and categorized with respect to four BSC perspectives (Table 2).
Then hierarchical BSC-FANP model was formed where the vision to improve the SC performance is at first level (Fig. 4). As the KM adoption in SC enablers helps to achieve the vision at the third level of hierarchy, four BSC perspectives were placed which help to categorize financial and non-financial SC performance measures. The SC performance measures with respect to BSC perspectives were placed at the fourth level.

Step 3: In this study TFNs (1˜,3˜,5˜,7˜,9˜) are used in pairwise comparisons (Table 4.)
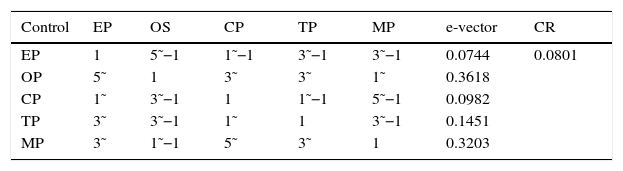
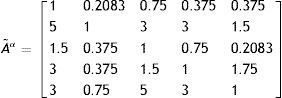
Step 4: Decision group was constructed by a fuzzy comparison matrix of the KM adoption in SC enabler's perspectives with respect to the vision by using a fuzzy scale given in Table 4. The fuzzy comparison matrix for the relative importance of the KM adoption in SC enabler's perspectives is shown in Table 7.
In this step, the first task is to define the lower limit and an upper limit of fuzzy numbers with respect to α-cut values by applying Eq. (6). That is,

Let us take α=0.5; that is decision maker has an average confidence on the judgement made during construction of fuzzy comparison matrix. By substituting the value of α into above expressions fuzzy comparison matrix A˜ is converted in to α-cut comparison matrix A˜α. Because of the space limitation, calculation parts of only KM adoption in SC enablers perspectives are shown in this paper. The fuzzy comparison matrix of A˜ is converted into α-cut comparison matrix A˜α

For this study μ has taken 0.5 as the value of index of optimism. This means that judgments are neither too optimistic nor too pessimistic. By putting the value of μ in Eq. (10) α-cut comparison matrix A˜α is converted into crisp comparison matrix A.
For determinants we find out these Eigen values:


In this all Eigen values we find: λmax=λ1=5.3561
So Consistency Index (CI):

From Table 5, for n=5, RI=1.11, so

Since CR<0.1 so, this crisp comparison matrix for the determinant is acceptable. When the crisp comparison matrix X of KM adoption in SC enabler's perspectives is consistent, it means the fuzzy comparison matrix A˜ of KM adoption in SC enablers perspectives is also consistent. KM adoption in SC enabler's perspectives local weights is also calculated (See Table 7).
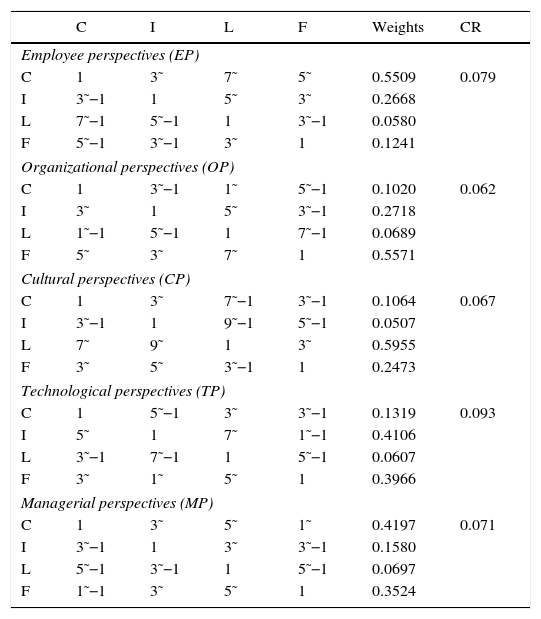
Then following the same method and BSC perspectives weights are defined on the basis of KM adoption SC enabler's perspectives. Table 8 shows the fuzzy comparison matrix of the BSC perspectives with respect to KM adoption SC enabler's perspectives along with calculated local weights.
Local weights and pairwise comparison matrix of BSC perspectives.
| C | I | L | F | Weights | CR | |
|---|---|---|---|---|---|---|
| Employee perspectives (EP) | ||||||
| C | 1 | 3˜ | 7˜ | 5˜ | 0.5509 | 0.079 |
| I | 3˜−1 | 1 | 5˜ | 3˜ | 0.2668 | |
| L | 7˜−1 | 5˜−1 | 1 | 3˜−1 | 0.0580 | |
| F | 5˜−1 | 3˜−1 | 3˜ | 1 | 0.1241 | |
| Organizational perspectives (OP) | ||||||
| C | 1 | 3˜−1 | 1˜ | 5˜−1 | 0.1020 | 0.062 |
| I | 3˜ | 1 | 5˜ | 3˜−1 | 0.2718 | |
| L | 1˜−1 | 5˜−1 | 1 | 7˜−1 | 0.0689 | |
| F | 5˜ | 3˜ | 7˜ | 1 | 0.5571 | |
| Cultural perspectives (CP) | ||||||
| C | 1 | 3˜ | 7˜−1 | 3˜−1 | 0.1064 | 0.067 |
| I | 3˜−1 | 1 | 9˜−1 | 5˜−1 | 0.0507 | |
| L | 7˜ | 9˜ | 1 | 3˜ | 0.5955 | |
| F | 3˜ | 5˜ | 3˜−1 | 1 | 0.2473 | |
| Technological perspectives (TP) | ||||||
| C | 1 | 5˜−1 | 3˜ | 3˜−1 | 0.1319 | 0.093 |
| I | 5˜ | 1 | 7˜ | 1˜−1 | 0.4106 | |
| L | 3˜−1 | 7˜−1 | 1 | 5˜−1 | 0.0607 | |
| F | 3˜ | 1˜ | 5˜ | 1 | 0.3966 | |
| Managerial perspectives (MP) | ||||||
| C | 1 | 3˜ | 5˜ | 1˜ | 0.4197 | 0.071 |
| I | 3˜−1 | 1 | 3˜ | 3˜−1 | 0.1580 | |
| L | 5˜−1 | 3˜−1 | 1 | 5˜−1 | 0.0697 | |
| F | 1˜−1 | 3˜ | 5˜ | 1 | 0.3524 | |
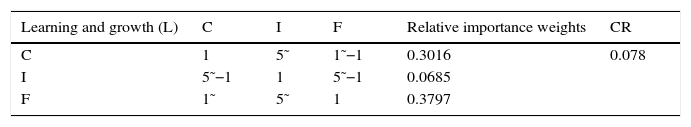
In the last phase of this step, local weights of the SC performance measures are determined by using the fuzzy pairwise comparison matrices listed in Table 9.
Local weights of SC performance measures.
| Customer (C) | CR | OT | DP | RP | QD | Weights | CR |
|---|---|---|---|---|---|---|---|
| CR | 1 | 1˜ | 3˜ | 9˜ | 3˜ | 0.3937 | 0.088 |
| OT | 1˜−1 | 1 | 3˜ | 3˜ | 1˜ | 0.2431 | |
| DP | 3˜−1 | 3˜−1 | 1 | 3˜ | 3˜−1 | 0.1076 | |
| RP | 9˜−1 | 3˜−1 | 3˜−1 | 1 | 5˜−1 | 0.0509 | |
| QD | 3˜−1 | 1˜−1 | 3˜ | 5˜ | 1 | 0.2045 |
| Internal business process (I) | MF | PE | TI | QP | PO | Weights | CR |
|---|---|---|---|---|---|---|---|
| MF | 1 | 3˜ | 5˜ | 9˜ | 1˜−1 | 0.3476 | 0.090 |
| PE | 3˜−1 | 1 | 1˜ | 5˜ | 3˜−1 | 0.1417 | |
| TI | 5˜−1 | 1˜−1 | 1 | 5˜ | 5˜−1 | 0.1040 | |
| QP | 9˜−1 | 5˜−1 | 5˜−1 | 1 | 5˜−1 | 0.0399 | |
| PO | 1˜ | 3˜ | 5˜ | 5˜ | 1 | 0.3666 |
| Learning and growth (L) | AF | ST | OE | CU | BS | Weights | CR |
|---|---|---|---|---|---|---|---|
| AF | 1 | 1˜−1 | 5˜ | 5˜−1 | 3˜ | 0.1666 | 0.080 |
| ST | 1˜ | 1 | 7˜ | 3˜−1 | 3˜ | 0.2231 | |
| OE | 5˜−1 | 7˜−1 | 1 | 7˜−1 | 3˜−1 | 0.0404 | |
| CU | 5˜ | 3˜ | 7˜ | 1 | 5˜ | 0.4824 | |
| BS | 3˜−1 | 3˜−1 | 3˜ | 5˜−1 | 1 | 0.0872 |
| Finance (F) | RO | RG | CT | IC | TC | Weights | CR |
|---|---|---|---|---|---|---|---|
| RO | 1 | 3˜−1 | 5˜ | 3˜ | 7˜ | 0.287492 | 0.091 |
| RG | 3˜ | 1 | 5˜ | 3˜ | 7˜ | 0.431483 | |
| CT | 5˜−1 | 5˜−1 | 1 | 3˜−1 | 3˜ | 0.078499 | |
| IC | 3˜−1 | 3˜−1 | 3 | 1 | 5˜ | 0.163095 | |
| TC | 7˜−1 | 7˜−1 | 3˜−1 | 5˜−1 | 1 | 0.039431 |
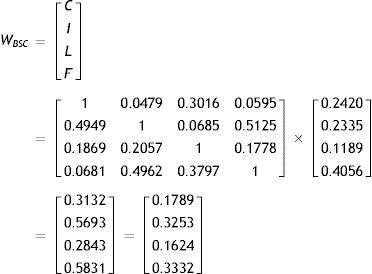
Step 5: The global weights of the BSC perspectives are calculated by multiplying local weights of the BSC perspectives listed in Table 8 with KM adoption in SC enablers perspectives (strategy) weights:

Step 6: Then to reveal interdependencies in the network, based on the dependencies presented in Fig. 3, fuzzy comparison matrices for the BSC perspectives are constructed (Tables 10–13).
Using the computed relative weights, the dependence matrix of the BSC perspectives is formed. The independent weights of the BSC perspectives are computed by multiplying the inner dependence matrix with the local weights of the BSC perspectives obtained from step 5. The interdependent weights (in terms of percentage) of the BSC perspectives are calculated as follows:
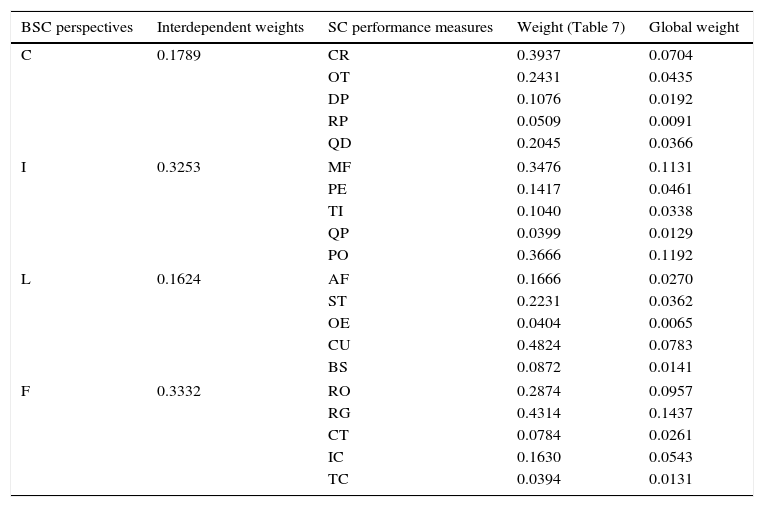
Step 7: The global SC performance measure weights are computed by multiplying local weights of the SC performance measures (Table 9) with interdependent weights of the SC performance measures (step 6). Computed values are shown in Table 14.
Computed global weights of SC performance measures.
| BSC perspectives | Interdependent weights | SC performance measures | Weight (Table 7) | Global weight |
|---|---|---|---|---|
| C | 0.1789 | CR | 0.3937 | 0.0704 |
| OT | 0.2431 | 0.0435 | ||
| DP | 0.1076 | 0.0192 | ||
| RP | 0.0509 | 0.0091 | ||
| QD | 0.2045 | 0.0366 | ||
| I | 0.3253 | MF | 0.3476 | 0.1131 |
| PE | 0.1417 | 0.0461 | ||
| TI | 0.1040 | 0.0338 | ||
| QP | 0.0399 | 0.0129 | ||
| PO | 0.3666 | 0.1192 | ||
| L | 0.1624 | AF | 0.1666 | 0.0270 |
| ST | 0.2231 | 0.0362 | ||
| OE | 0.0404 | 0.0065 | ||
| CU | 0.4824 | 0.0783 | ||
| BS | 0.0872 | 0.0141 | ||
| F | 0.3332 | RO | 0.2874 | 0.0957 |
| RG | 0.4314 | 0.1437 | ||
| CT | 0.0784 | 0.0261 | ||
| IC | 0.1630 | 0.0543 | ||
| TC | 0.0394 | 0.0131 | ||
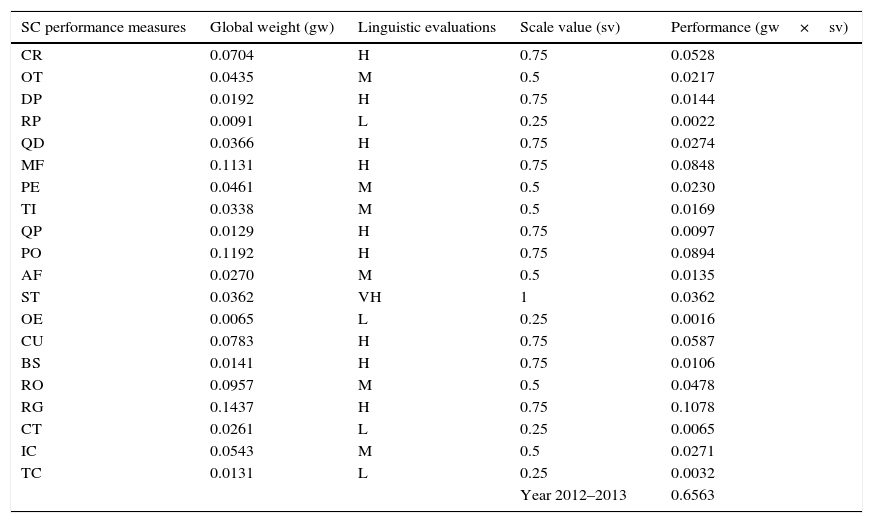
Step 8: The decision group was asked to express their subjective judgments by linguistic variable (Table 6) regarding the case organizations performance of the SC performance measures for the year 2012–2013 (Table 15). These linguistic evaluations were finalized as the performance each SC performance measure for the above specified period.
SC performance measured after KM adoption by using the proposed BSC-FANP framework.
| SC performance measures | Global weight (gw) | Linguistic evaluations | Scale value (sv) | Performance (gw×sv) |
|---|---|---|---|---|
| CR | 0.0704 | H | 0.75 | 0.0528 |
| OT | 0.0435 | M | 0.5 | 0.0217 |
| DP | 0.0192 | H | 0.75 | 0.0144 |
| RP | 0.0091 | L | 0.25 | 0.0022 |
| QD | 0.0366 | H | 0.75 | 0.0274 |
| MF | 0.1131 | H | 0.75 | 0.0848 |
| PE | 0.0461 | M | 0.5 | 0.0230 |
| TI | 0.0338 | M | 0.5 | 0.0169 |
| QP | 0.0129 | H | 0.75 | 0.0097 |
| PO | 0.1192 | H | 0.75 | 0.0894 |
| AF | 0.0270 | M | 0.5 | 0.0135 |
| ST | 0.0362 | VH | 1 | 0.0362 |
| OE | 0.0065 | L | 0.25 | 0.0016 |
| CU | 0.0783 | H | 0.75 | 0.0587 |
| BS | 0.0141 | H | 0.75 | 0.0106 |
| RO | 0.0957 | M | 0.5 | 0.0478 |
| RG | 0.1437 | H | 0.75 | 0.1078 |
| CT | 0.0261 | L | 0.25 | 0.0065 |
| IC | 0.0543 | M | 0.5 | 0.0271 |
| TC | 0.0131 | L | 0.25 | 0.0032 |
| Year 2012–2013 | 0.6563 |
Step 9: The total SC performance score is calculated by multiplying the global weights of the (step 7) and scale values of the SC performance measure and then summing the resulting performance level (Table 15). The BSC-FANP framework has calculated case organizations SC performance score (65.63%).
6Result and discussionIn the era of KM adoption in SC, it is essential for the organization to exploit the benefits associated with KM adoption in SC to improve their SC performance. In this empirical study, a BSC-FANP framework was used to determine the SC performance level of the Indian case organization on the basis of KM adoption. This model integrates and relies on the various KM adoptions in SC enabler's perspectives, BSC perspectives and SC performance measures with respect to these perspectives. This BSC-FANP model has used 5 KM adoption in SC enabler's perspectives as an employee, organizational, cultural, technological, and managerial as KM adoption in SC strategies to achieve the vision of improvement in SC performance. This model has used four BSC perspectives along with 25 SC performance measures. The four BSC perspectives used in this model are a customer, internal business process, learning and growth, and financial.
6.1Significant findingsFor the case organization undertaken in this study, the results indicate that, among the BSC perspectives financial perspectives (33.32%) have been determined to be the most important BSC perspectives. This perspective followed by an internal business process (32.53%), customer perspectives (17.89%) and learning and growth (16.24%), respectively. It indicates case organization still giving prime importance to the financial SC performance measures.
Table 15 shows the performance of the SC performance measures. The most important performance measure that has a positive effect on the SC performance has been determined as revenue growth (RG=0.78%). The case organization has adopted KM enablers such as mining customer knowledge, trustworthy team work which in turn enhances the customer satisfaction. This resulted in increase in the sales of the organization (revenue). The second important performance measure is purchased order cycle time (PO=8.94%). Due to the KM adoption in SC enablers such as supplier development (SD) programme and service exchange, decision knowledge sharing the mutual trust between organizations and SC is increased, which has resulted in minimizing the purchased order cycle time.
Similarly most important performance measures that have a negative effect on SC performance have been determined as order entry method (OE=0.1%), range of products (RP=0.2%), and the total cash flow (TC=0.3%).
The case organization should concentrate on SC performance measures with high weight and try to improve these measures. The results indicate that the total SC performance score of the case organization is 65.63% (Table 15).
6.2Evaluation of SC performance after KM adoption in SCThe aim of this study is to evaluate the impact of KM adoption on SC performance rather than comparing the SC performance before and after KM adoption. The case organization has done huge investment for KM adoption in their SC. Hence, it is essential to analyze the difference of the SC performance before and after KM adoption. Fig. 5 shows the BSC-FANP model to evaluate the SC performance before KM adoption. This model was applied in 2010–2011 before the case organization has adopted KM in their SC. The SC performance has shown in Table 16.

SC performance measured before KM adoption by using the proposed BSC-FANP framework.
| SC performance measures | Global weight (gw) | Linguistic evaluations | Scale value (sv) | Performance (gw×sv) |
|---|---|---|---|---|
| CR | 0.0940 | M | 0.5 | 0.0470 |
| OT | 0.0580 | M | 0.5 | 0.0290 |
| DP | 0.0257 | M | 0.5 | 0.0128 |
| RP | 0.0121 | L | 0.25 | 0.0030 |
| QD | 0.0488 | H | 0.75 | 0.0366 |
| MF | 0.0878 | M | 0.5 | 0.0439 |
| PE | 0.0358 | M | 0.5 | 0.0179 |
| TI | 0.0262 | M | 0.5 | 0.0131 |
| QP | 0.0100 | H | 0.75 | 0.0075 |
| PO | 0.0926 | M | 0.5 | 0.0463 |
| AF | 0.0367 | H | 0.75 | 0.0275 |
| ST | 0.0491 | H | 0.75 | 0.0368 |
| OE | 0.0089 | L | 0.25 | 0.0022 |
| CU | 0.1063 | M | 0.5 | 0.0531 |
| BS | 0.0192 | M | 0.5 | 0.0096 |
| RO | 0.0827 | L | 0.25 | 0.0206 |
| RG | 0.1242 | M | 0.5 | 0.0621 |
| CT | 0.0225 | L | 0.25 | 0.0056 |
| IC | 0.0469 | M | 0.5 | 0.0234 |
| TC | 0.0113 | L | 0.25 | 0.0028 |
| Year 2010–2011 | 0.5017 |
The case organization used practices such as Vendor Managed Inventory (VMI), Collaborative Planning, Forecasting and Replenishment (CPFR), Focus on the Consumer (FC), Employ Industry Standards (ES), Use IT resources (UR) to improve the SC performance before KM adoption and FANP implemented. Resulted SC performance before KM adoption score was 50.17%. Then next year case organization has implemented KM and its elements such as Employee Perspectives (EP), Organizational Perspectives (OP), Cultural Perspectives (CP), Technological Perspectives (TP), and Managerial Perspectives (MP). FANP has been implemented after KM adoption, which has resulted SC performance after KM adoption is 65.63%.
Both FANP models (before and after KM adoption) are different one, and implemented in two different years; hence set of enablers used are also different. And both models are not compared; rather evaluate the impact of KM adoption on SC performance. The case organization's total SC performance score before KM adoption was 50.17% and after KM adoption the SC performance score is 65.63%. It shows significant improvement (15%) in the SC performance of the case organization due to KM adoption in SC. It shows that KM adoption in SC has a positive impact on the SC performance. Hence, the case organization should continue the KM adoption in their SC.
The practical implication of this research is the management of the organizations would benefit in terms of decision-making regarding KM adoption in SC. The better decision-making should result in improved SC performance.
6.3Sensitivity analysisA sensitivity analysis is conducted in order to monitor the robustness of SC performance level to changes in BSC perspectives weights. The overall objective of sensitivity analysis is to see the robustness of proposed frameworks due to variation in the expert opinion in assigning the weights during the comparison. Twelve experiments were conducted for sensitivity analysis. Table 17 presents the detail of the experiment; in all twelve experiments the weights of the four BSC perspectives are interchanged.
Experiments for sensitivity analysis.
| Expt. no. | BSC perspectives weights | CR | OT | DP | RP | QD | MF | PE | TI | QP | PO | AF | ST | OE | CU | BS | RO | RG | CT | IC | TC | SC performance |
|---|---|---|---|---|---|---|---|---|---|---|---|---|---|---|---|---|---|---|---|---|---|---|
| 1. | C=0.3253, I=0.1624, L=0.3332, F=0.1789 | 0.0961 | 0.0395 | 0.0263 | 0.0041 | 0.0499 | 0.0423 | 0.0115 | 0.0084 | 0.0049 | 0.0447 | 0.0278 | 0.0743 | 0.0033 | 0.1205 | 0.0218 | 0.0257 | 0.0578 | 0.0035 | 0.0145 | 0.0017 | 0.6790 |
| 2. | C=0.3253, I=0.1789, L=0.1624, F=0.3332 | 0.0961 | 0.0395 | 0.0263 | 0.0041 | 0.0499 | 0.0467 | 0.0127 | 0.0093 | 0.0054 | 0.0492 | 0.0135 | 0.0362 | 0.0016 | 0.0587 | 0.0106 | 0.0478 | 0.1078 | 0.0065 | 0.0271 | 0.0032 | 0.6526 |
| 3. | C=0.3253, I=0.3332, L=0.1789, F=0.1624 | 0.0961 | 0.0395 | 0.0263 | 0.0041 | 0.0499 | 0.0869 | 0.0236 | 0.0173 | 0.01 | 0.0916 | 0.0149 | 0.0399 | 0.0018 | 0.0647 | 0.0117 | 0.0233 | 0.0525 | 0.0031 | 0.0132 | 0.0016 | 0.6723 |
| 4. | C=0.1789, I=1624, L=0.3332, F=0.3253 | 0.0528 | 0.0217 | 0.0144 | 0.0023 | 0.0274 | 0.0423 | 0.0115 | 0.0084 | 0.0049 | 0.0447 | 0.0278 | 0.0743 | 0.0033 | 0.1205 | 0.0218 | 0.0467 | 0.1052 | 0.0063 | 0.0265 | 0.0032 | 0.6665 |
| 5. | C=0.1789, I=0.3253, L=0.3332, F=0.1624 | 0.0528 | 0.0217 | 0.0144 | 0.0023 | 0.0274 | 0.0848 | 0.023 | 0.0169 | 0.0097 | 0.0895 | 0.0278 | 0.0743 | 0.0033 | 0.1205 | 0.0218 | 0.0233 | 0.0525 | 0.0031 | 0.0132 | 0.0016 | 0.6845 |
| 6. | C=0.1789, I=0.1624, L=0.3253, F=0.3332 | 0.0528 | 0.0217 | 0.0144 | 0.0023 | 0.0274 | 0.0423 | 0.0115 | 0.0084 | 0.0097 | 0.0447 | 0.0271 | 0.0725 | 0.0032 | 0.1177 | 0.0212 | 0.0478 | 0.1078 | 0.0065 | 0.0271 | 0.0032 | 0.6701 |
| 7. | C=0.1624, I=3332, L=0.1789, F=0.3253 | 0.048 | 0.0197 | 0.0131 | 0.0021 | 0.0249 | 0.0869 | 0.0236 | 0.0173 | 0.01 | 0.0916 | 0.0149 | 0.0399 | 0.0018 | 0.0647 | 0.0117 | 0.0467 | 0.1052 | 0.0063 | 0.0265 | 0.0032 | 0.6584 |
| 8. | C=0.1624, I=0.1789, L=0.3253, F=0.3332 | 0.048 | 0.0197 | 0.0131 | 0.0021 | 0.0249 | 0.0467 | 0.0127 | 0.0093 | 0.0054 | 0.0492 | 0.0271 | 0.0725 | 0.0032 | 0.1177 | 0.0212 | 0.0478 | 0.1078 | 0.0065 | 0.0271 | 0.0032 | 0.6656 |
| 9. | C=0.1624,I=0.3253, L=0.3332, F=0.1789 | 0.048 | 0.0197 | 0.0131 | 0.0021 | 0.0249 | 0.0848 | 0.023 | 0.0169 | 0.0097 | 0.0895 | 0.0278 | 0.0743 | 0.0033 | 0.1205 | 0.0218 | 0.0257 | 0.0578 | 0.0035 | 0.0145 | 0.0017 | 0.6831 |
| 10. | C=0.3332, I=0.1789, L=0.3253, F=0.1624 | 0.0984 | 0.0405 | 0.0269 | 0.0042 | 0.0511 | 0.0467 | 0.0127 | 0.0093 | 0.0054 | 0.0492 | 0.0271 | 0.0725 | 0.0032 | 0.1177 | 0.0212 | 0.0233 | 0.0525 | 0.0031 | 0.0132 | 0.0016 | 0.6802 |
| 11. | C=0.3332, I=0.1624, L=0.3253, F=0.1789 | 0.0984 | 0.0405 | 0.0269 | 0.0042 | 0.0511 | 0.0423 | 0.0115 | 0.0084 | 0.0049 | 0.0447 | 0.0271 | 0.0725 | 0.0032 | 0.1177 | 0.0212 | 0.0257 | 0.0578 | 0.0035 | 0.0145 | 0.0017 | 0.6784 |
| 12. | C=0.3332, I=0.3253, L=0.1789, F=0.1624 | 0.0984 | 0.0405 | 0.0269 | 0.0042 | 0.0511 | 0.0848 | 0.023 | 0.0169 | 0.0097 | 0.0895 | 0.0149 | 0.0399 | 0.0018 | 0.0647 | 0.0117 | 0.0233 | 0.0525 | 0.0031 | 0.0132 | 0.0016 | 0.6721 |
Fig. 6 depicts the changes in the individual SC performance measures score as well as the total SC performance score when the weights of the BSC perspectives are changed. It can be seen from Table 17 and Fig. 6 that SC performance score is higher in experiment no. 2 (65.26%), and smallest SC performance score in experiment no. 5 (68.45%). The variation in the SC performance scores due to changes in BSC perspectives weights is very small (3.19%). It shows that the SC performance level is not sensitive to the BSC perspectives weights.
7Conclusion and future scope
In today's globalization KM plays an important role in SC to create, build and maintain competitive advantage through utilization of knowledge and through collaborative practices. In order to improve the SC performance and achieve the competitive advantage many organizations have adopted KM in their SC. Then it is essential to assess the impact of KM adoption on SC performance. This study presents a scientific framework to evaluate the SC performance level based on the KM adoption in SC by using a hybrid multi criteria technique which integrates BSC and FANP.
In this study we show how the BSC works to serve as a basis for evaluating SC performance based on KM adoption. The ANP process offers verified way of selecting and quantifying the relation necessary to actually use the BSC. Using the empirical case study, we demonstrated the feasibility and usefulness of the integrated BSC-FANP approach to evaluate SC performance based on KM adoption. The Empirical results show that the SC performance score of the case organization is improved by 15% after KM adoption in SC. It shows the positive impact of KM adoption on SC performance. Hence, the case organizations should continue to adopt KM in their SC to improve their SC performance.
The present study has the following contributions. First, it is the first to highlight the impact of KM adoption on SC performance. Second, it proposes a new theoretical approach to evaluate the SC performance based on KM adoption. The empirical results provide the theoretical foundation about the positive relation between KM adoption and SC performance. It will encourage the organizations to adopt KM in their SC to improve SC performance. Third, it found that SC performance based on KM adoption remains unchanged with respect to BSC perspectives weight change.
This study is limited to one case organization; hence conclusions are not general but specific to the case organization. Some future studies have been identified. The proposed framework can apply in another organization. Note that the set of performance variables might have to be modified in order to be used in another organization, since it is developed with respect to a specific organization under study.
