


The paper examines the long-run relationship between bond market development and economic growth in G-20 countries for the period 1990–2011. We use four sets of bond market indicators for studying this relationship. Using vector autoregressive (VAR) model for testing the Granger causalities, the study finds the presence of both unidirectional and bidirectional causality between bond market development and economic growth. The policy implication of this study is that the economic policies should recognize the differences in the development of bond market and economic growth in order to maintain sustainable development in the G-20 countries.
Following the seminal papers by King and Levine (1993a, 1993b), there has been a large body of evidence showing a causal effect from financial development to economic growth (see, for instance, Ang, 2008a, 2008b; Levine, 2005). Countries with well-developed financial systems, e.g., large banks, growing stock markets, and other active financial markets, have high promise of future economic growth (see, for instance, Anwar & Cooray, 2012; Gochoco-Bautista, Sotocinal, & Wang, 2014; Jedidia, Boujelbene, & Helali, 2014; Samargandi, Fidrmuc, & Ghosh, 2015; Yang & Yi, 2008).
In this paper, we analyze the relationship between economic growth and four dimensions of bond market development,1 a sub-sector of the financial sector development.2 Most of the financial literature offers wide attention on financial development,3 particularly with reference to both banking sector and stock markets development, and their link to economic growth. However, the inclusion of bond market development4 in economic growth enhancing process is having low coverage and has received much less attention than that of banks and stock markets development (see, for instance, Sharma, 2001; Thumrongvit, Kim, & Pyun, 2013). Bond market is a late development industry, causing the difficulties on assessing the role of bond markets in the development process (see, for instance, Herring & Chatusripitak, 2001). This study adds the bond market5 coverage to the finance literature by addressing two important questions: first, the existence of cointegration between the bond market development (BOMD) and per capita economic growth (PGDP); and second, the presence of long-run and short-run directions of causality between BOMD and PGDP. The focus of this study is on G-20 countries during the period 1990–2011.
The asseveration is that, like banks and stock markets development, the bond market development6 is a key to economic growth. Bond market development contributes economic growth in four dimensions of the financial system – size, access, efficiency and stability (see, for, instance, World Bank, 2006). Therefore, it is the urgent need for policymakers to develop the bond market7 and to understand the linkage between bond market development and economic growth (DeBondt, 2002; Fink, Haiss, Kirchner, & Moser, 2006; Matei, 2013a). In analogy to other financial sectors development like banks and stock markets development, the link between bond market development and economic growth can be classified in terms of four probable hypotheses (see, for instance, Fink, Haiss, Kirchner, & Moser, 2007; Kapingura & Makhetha-Kosi, 2014; Matei, 2013b; Puente-Ajovin & Sanso-Navarro, 2015).
The first strand is the supply-leading hypothesis (SLH) which contends that bond market development is the pre-requisite for achieving high economic growth. Here, the causality is unidirectional in nature and it runs from bond market development to economic growth only. The supporters of the supply-leading hypothesis suggest that bond market development plays a major role in economic growth and that is through variety of ways like ameliorating risk, reducing information asymmetries, monitoring firms and exerting corporate governance, easing the exchange of goods and services, and mobilizing savings and so forth (see, for instance, Peia & Roszbach, 2015; Samargandi, Fidrmuc, & Ghosh, 2014; Uddin, Sjo, & Shahbaz, 2013; Vithessonthi, 2014; Zhang, Wang, & Wang, 2012).
A second strand is the demand-following hypothesis (DFH) which suggests that causality runs instead from economic growth to bond market development. Here, the causality is again unidirectional in nature and it runs from economic growth to bond market development only. The supporters of the demand-following hypothesis suggest that bond market development plays only a minor role in economic growth and that is merely an outcome of economic growth in the real side of the economy. The idea is that as an economy grows, additional bond coverage may emerge in the financial markets in response to higher demand for financial services.
The third strand is the feedback hypothesis (FBH) which suggests that economic growth and bond market development can complement and reinforce each other, making bond market development and real economic growth mutually causal. The argument in favour of the bidirectional causality is that bond market development is indispensable to economic growth and economic growth inevitably requires the bond market development.
The fourth strand is the neutrality hypothesis (NLH) which suggests that bond market development and economic growth are independent to each other. The proponents of this hypothesis maintain that bond market development has no role towards economic growth. That means they are independent to each other.
The studies that support these four hypotheses are Puente-Ajovin and Sanso-Navarro (2015), Marques, Correa, and Sapriza (2013) and Fink et al. (2006).
The paper is organized as follows. Section 1 discusses the proposed hypothesis and sample. Section 2 presents a brief outline of bond market in G-20 countries. Section 3 describes the proposed model and econometrics estimation. Section 4 describes the empirical results. Finally, we summarize and conclude in Section 5.
2An outline of bond market in the G-20 countriesBond market is an integral part of the financial development and can be monitored by four dimensions of the financial system such as size, access, efficiency and stability (see, for instance, World Bank, 2006). However, this paper specifically uses bond market size to examine the status of bond market development and its link with economic growth in the G-20 countries. This is because the size dimension comprises the most commonly used measures of bond markets development, notwithstanding that the other three dimensions can be equally important.
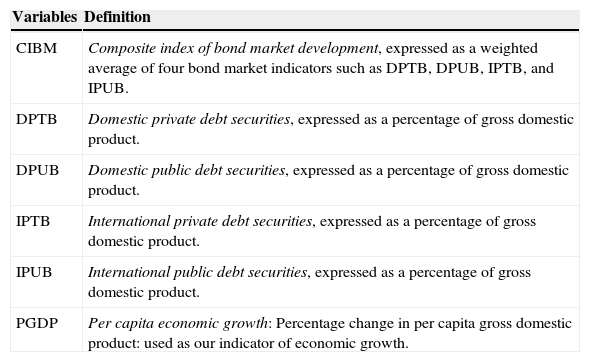
The size of bond markets includes both domestic as well as international coverage. There are four different ways we can examine the size of the bond market. These include domestic private debt securities (DPTB), domestic public debt securities (DPUB), international private debt securities (IPTB), and intentional public debt securities (IPUB). The detail descriptions of these indicators are available in Table 1.
Definition of variables.
| Variables | Definition |
|---|---|
| CIBM | Composite index of bond market development, expressed as a weighted average of four bond market indicators such as DPTB, DPUB, IPTB, and IPUB. |
| DPTB | Domestic private debt securities, expressed as a percentage of gross domestic product. |
| DPUB | Domestic public debt securities, expressed as a percentage of gross domestic product. |
| IPTB | International private debt securities, expressed as a percentage of gross domestic product. |
| IPUB | International public debt securities, expressed as a percentage of gross domestic product. |
| PGDP | Per capita economic growth: Percentage change in per capita gross domestic product: used as our indicator of economic growth. |
Note: 1. All monetary measures are in US dollars. 2. All these bond market indicators are used here as a proxy for the “bond market development (BOMD)”.
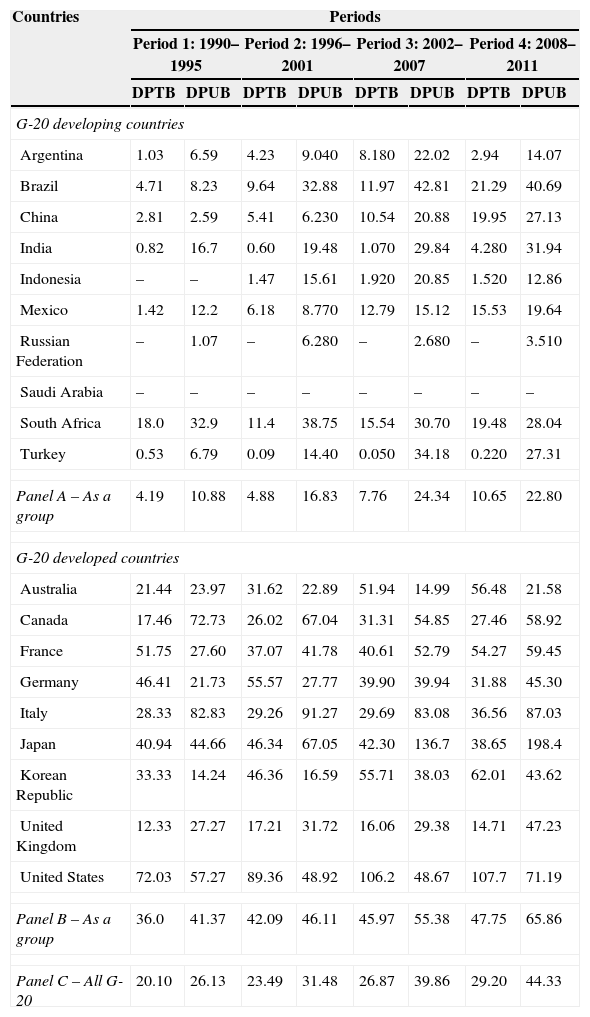
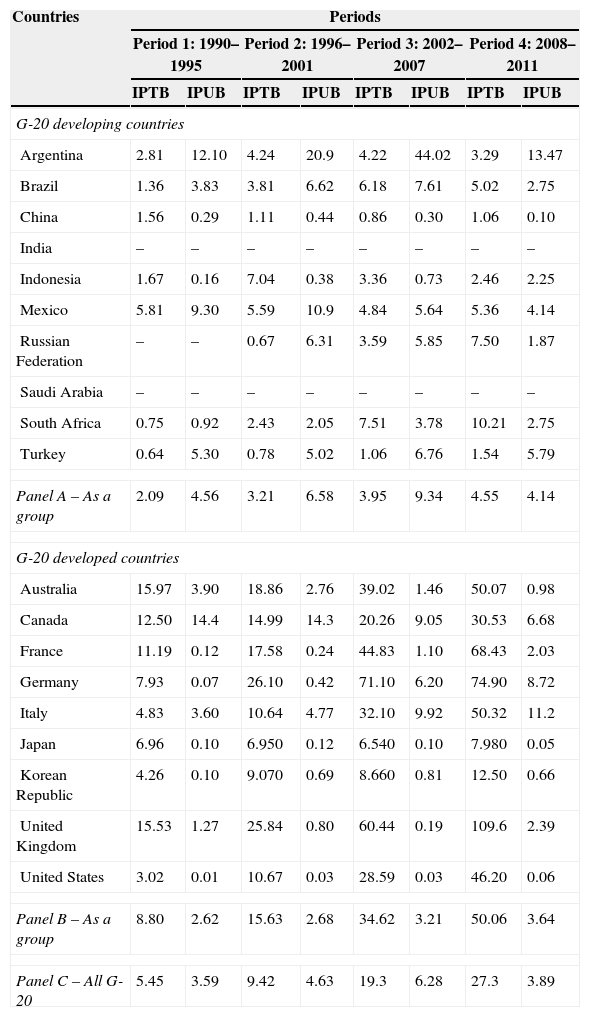
Tables 2 and 3 provide the overall status of bond market size. Table 2 presents the trends of domestic flows of bond market coverage, while Table 3 presents the trends of international flows of bond market coverage. The status of DPTB, DPUB, IPTB and IPUB are observed here at four different time periods from 1990 to 2011 (see, Tables 2 and 3). These include 1990–1995, 1996–2001, 2002–2007, and 2008–2011. The main outlines of this bond market coverage are as follows:
- •
First, the flows of public debt securities are fairly high in comparison to private debt securities. This is true for most of the countries and for both domestic and international flows.
- •
Second, the average flows are much higher in developed countries in contrast to developing countries. This is true for both domestic flows and international flows.
- •
Third, the average trend has been increasing over the years in most of the countries with little impact on global financial crisis in 2007.
- •
Fourth, domestic debt securities (both private and public) are comparatively high in Brazil, India, South Africa and Turkey. On the contrary, the coverage is high in USA, Japan, Italy and Canada among the developed countries.
- •
Fifth, the international debt securities (both private and public) are relatively high in Argentina, Mexico, Brazil and Turkey among the developing countries. On the other hand, the coverage is high in UK, France, Germany, USA and Italy among the developed countries.
The trends of domestic bond flows in G-20 countries.
| Countries | Periods | |||||||
|---|---|---|---|---|---|---|---|---|
| Period 1: 1990–1995 | Period 2: 1996–2001 | Period 3: 2002–2007 | Period 4: 2008–2011 | |||||
| DPTB | DPUB | DPTB | DPUB | DPTB | DPUB | DPTB | DPUB | |
| G-20 developing countries | ||||||||
| Argentina | 1.03 | 6.59 | 4.23 | 9.040 | 8.180 | 22.02 | 2.94 | 14.07 |
| Brazil | 4.71 | 8.23 | 9.64 | 32.88 | 11.97 | 42.81 | 21.29 | 40.69 |
| China | 2.81 | 2.59 | 5.41 | 6.230 | 10.54 | 20.88 | 19.95 | 27.13 |
| India | 0.82 | 16.7 | 0.60 | 19.48 | 1.070 | 29.84 | 4.280 | 31.94 |
| Indonesia | – | – | 1.47 | 15.61 | 1.920 | 20.85 | 1.520 | 12.86 |
| Mexico | 1.42 | 12.2 | 6.18 | 8.770 | 12.79 | 15.12 | 15.53 | 19.64 |
| Russian Federation | – | 1.07 | – | 6.280 | – | 2.680 | – | 3.510 |
| Saudi Arabia | – | – | – | – | – | – | – | – |
| South Africa | 18.0 | 32.9 | 11.4 | 38.75 | 15.54 | 30.70 | 19.48 | 28.04 |
| Turkey | 0.53 | 6.79 | 0.09 | 14.40 | 0.050 | 34.18 | 0.220 | 27.31 |
| Panel A – As a group | 4.19 | 10.88 | 4.88 | 16.83 | 7.76 | 24.34 | 10.65 | 22.80 |
| G-20 developed countries | ||||||||
| Australia | 21.44 | 23.97 | 31.62 | 22.89 | 51.94 | 14.99 | 56.48 | 21.58 |
| Canada | 17.46 | 72.73 | 26.02 | 67.04 | 31.31 | 54.85 | 27.46 | 58.92 |
| France | 51.75 | 27.60 | 37.07 | 41.78 | 40.61 | 52.79 | 54.27 | 59.45 |
| Germany | 46.41 | 21.73 | 55.57 | 27.77 | 39.90 | 39.94 | 31.88 | 45.30 |
| Italy | 28.33 | 82.83 | 29.26 | 91.27 | 29.69 | 83.08 | 36.56 | 87.03 |
| Japan | 40.94 | 44.66 | 46.34 | 67.05 | 42.30 | 136.7 | 38.65 | 198.4 |
| Korean Republic | 33.33 | 14.24 | 46.36 | 16.59 | 55.71 | 38.03 | 62.01 | 43.62 |
| United Kingdom | 12.33 | 27.27 | 17.21 | 31.72 | 16.06 | 29.38 | 14.71 | 47.23 |
| United States | 72.03 | 57.27 | 89.36 | 48.92 | 106.2 | 48.67 | 107.7 | 71.19 |
| Panel B – As a group | 36.0 | 41.37 | 42.09 | 46.11 | 45.97 | 55.38 | 47.75 | 65.86 |
| Panel C – All G-20 | 20.10 | 26.13 | 23.49 | 31.48 | 26.87 | 39.86 | 29.20 | 44.33 |
Note: 1. DPTB is domestic private debt securities; and DPUB is domestic public debt securities. 2. Panel A comprises the G-20 developing countries; Panel B comprises the G-20 developed countries; Panel C is the G-20 countries combined. 3. Values reported here are the natural logs of the variables.
The trends of international bond flows in G-20 countries.
| Countries | Periods | |||||||
|---|---|---|---|---|---|---|---|---|
| Period 1: 1990–1995 | Period 2: 1996–2001 | Period 3: 2002–2007 | Period 4: 2008–2011 | |||||
| IPTB | IPUB | IPTB | IPUB | IPTB | IPUB | IPTB | IPUB | |
| G-20 developing countries | ||||||||
| Argentina | 2.81 | 12.10 | 4.24 | 20.9 | 4.22 | 44.02 | 3.29 | 13.47 |
| Brazil | 1.36 | 3.83 | 3.81 | 6.62 | 6.18 | 7.61 | 5.02 | 2.75 |
| China | 1.56 | 0.29 | 1.11 | 0.44 | 0.86 | 0.30 | 1.06 | 0.10 |
| India | – | – | – | – | – | – | – | – |
| Indonesia | 1.67 | 0.16 | 7.04 | 0.38 | 3.36 | 0.73 | 2.46 | 2.25 |
| Mexico | 5.81 | 9.30 | 5.59 | 10.9 | 4.84 | 5.64 | 5.36 | 4.14 |
| Russian Federation | – | – | 0.67 | 6.31 | 3.59 | 5.85 | 7.50 | 1.87 |
| Saudi Arabia | – | – | – | – | – | – | – | – |
| South Africa | 0.75 | 0.92 | 2.43 | 2.05 | 7.51 | 3.78 | 10.21 | 2.75 |
| Turkey | 0.64 | 5.30 | 0.78 | 5.02 | 1.06 | 6.76 | 1.54 | 5.79 |
| Panel A – As a group | 2.09 | 4.56 | 3.21 | 6.58 | 3.95 | 9.34 | 4.55 | 4.14 |
| G-20 developed countries | ||||||||
| Australia | 15.97 | 3.90 | 18.86 | 2.76 | 39.02 | 1.46 | 50.07 | 0.98 |
| Canada | 12.50 | 14.4 | 14.99 | 14.3 | 20.26 | 9.05 | 30.53 | 6.68 |
| France | 11.19 | 0.12 | 17.58 | 0.24 | 44.83 | 1.10 | 68.43 | 2.03 |
| Germany | 7.93 | 0.07 | 26.10 | 0.42 | 71.10 | 6.20 | 74.90 | 8.72 |
| Italy | 4.83 | 3.60 | 10.64 | 4.77 | 32.10 | 9.92 | 50.32 | 11.2 |
| Japan | 6.96 | 0.10 | 6.950 | 0.12 | 6.540 | 0.10 | 7.980 | 0.05 |
| Korean Republic | 4.26 | 0.10 | 9.070 | 0.69 | 8.660 | 0.81 | 12.50 | 0.66 |
| United Kingdom | 15.53 | 1.27 | 25.84 | 0.80 | 60.44 | 0.19 | 109.6 | 2.39 |
| United States | 3.02 | 0.01 | 10.67 | 0.03 | 28.59 | 0.03 | 46.20 | 0.06 |
| Panel B – As a group | 8.80 | 2.62 | 15.63 | 2.68 | 34.62 | 3.21 | 50.06 | 3.64 |
| Panel C – All G-20 | 5.45 | 3.59 | 9.42 | 4.63 | 19.3 | 6.28 | 27.3 | 3.89 |
Note: 1. IPTB is international private debt securities; and IPUB is international public debt securities. 2. Panel A comprises the G-20 developing countries; Panel B comprises the G-20 developed countries; Panel C is the G-20 countries combined. 3. Values reported here are the natural logs of the variables.
In this study, we use Granger causality test to study the relationship between bond market development and economic growth using a sample of G-20 countries over the period 1990 to 2011. We also use cointegration tests to reveal whether these variables are cointegrated, that is, whether there is a long-run equilibrium relationship between them.
The main features of this study are that: (a) it uses a large sample of countries, being both developed and developing, over a current span of time; and (b) it utilizes passably sophisticated econometrics tool – and certainly empirical approaches until now are not taken in these literatures – to answer questions concerning the nature of the causal relationship between the variables both in the short-run and long-run. The study intends to test the following hypotheses:H1 Bond market development (BOMD) in any year Granger causes economic growth. This is termed the BOMD-led economic growth hypothesis. Economic growth (PGDP) in any year Granger causes bond market development. This is termed the PGDP-led BOMD hypothesis.
To test these two hypotheses, the following variables are used: growth rate of real per capita income (variable: PGDP) and bond market development (variable: BOMD). BOMD is used here in two forms – by a composite index (CIBM) and its individual bond market indicators such as DPTB, DPUB, IPTB, and IPUB. We use principal components analysis (PCA8) to derive the composite index of CIBM.9 The detailed descriptions of this index construction are available in Pradhan, Arvin, Norman, and Hall (2014), Owusu and Odhiambo (2014), and Hosseini and Kaneko (2011).
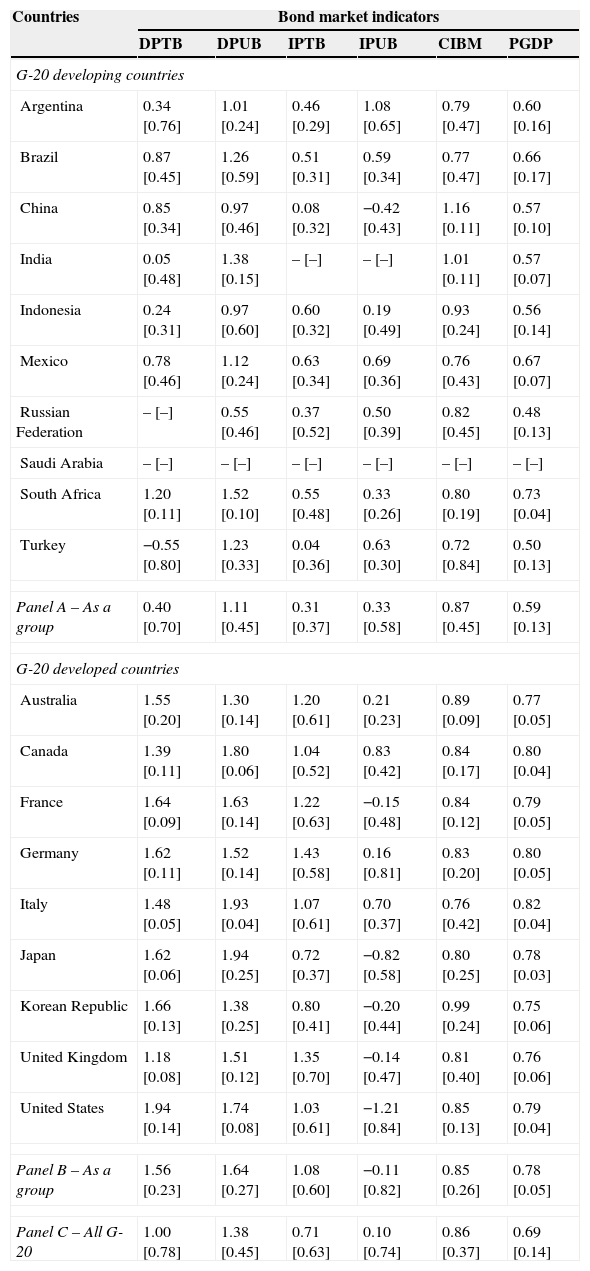
Table 1 presents the detailed description of these variables, while the summary statistics of the variables10 are presented in Table 4.
Descriptive statistics on the variables.
| Countries | Bond market indicators | |||||
|---|---|---|---|---|---|---|
| DPTB | DPUB | IPTB | IPUB | CIBM | PGDP | |
| G-20 developing countries | ||||||
| Argentina | 0.34 [0.76] | 1.01 [0.24] | 0.46 [0.29] | 1.08 [0.65] | 0.79 [0.47] | 0.60 [0.16] |
| Brazil | 0.87 [0.45] | 1.26 [0.59] | 0.51 [0.31] | 0.59 [0.34] | 0.77 [0.47] | 0.66 [0.17] |
| China | 0.85 [0.34] | 0.97 [0.46] | 0.08 [0.32] | −0.42 [0.43] | 1.16 [0.11] | 0.57 [0.10] |
| India | 0.05 [0.48] | 1.38 [0.15] | – [–] | – [–] | 1.01 [0.11] | 0.57 [0.07] |
| Indonesia | 0.24 [0.31] | 0.97 [0.60] | 0.60 [0.32] | 0.19 [0.49] | 0.93 [0.24] | 0.56 [0.14] |
| Mexico | 0.78 [0.46] | 1.12 [0.24] | 0.63 [0.34] | 0.69 [0.36] | 0.76 [0.43] | 0.67 [0.07] |
| Russian Federation | – [–] | 0.55 [0.46] | 0.37 [0.52] | 0.50 [0.39] | 0.82 [0.45] | 0.48 [0.13] |
| Saudi Arabia | – [–] | – [–] | – [–] | – [–] | – [–] | – [–] |
| South Africa | 1.20 [0.11] | 1.52 [0.10] | 0.55 [0.48] | 0.33 [0.26] | 0.80 [0.19] | 0.73 [0.04] |
| Turkey | −0.55 [0.80] | 1.23 [0.33] | 0.04 [0.36] | 0.63 [0.30] | 0.72 [0.84] | 0.50 [0.13] |
| Panel A – As a group | 0.40 [0.70] | 1.11 [0.45] | 0.31 [0.37] | 0.33 [0.58] | 0.87 [0.45] | 0.59 [0.13] |
| G-20 developed countries | ||||||
| Australia | 1.55 [0.20] | 1.30 [0.14] | 1.20 [0.61] | 0.21 [0.23] | 0.89 [0.09] | 0.77 [0.05] |
| Canada | 1.39 [0.11] | 1.80 [0.06] | 1.04 [0.52] | 0.83 [0.42] | 0.84 [0.17] | 0.80 [0.04] |
| France | 1.64 [0.09] | 1.63 [0.14] | 1.22 [0.63] | −0.15 [0.48] | 0.84 [0.12] | 0.79 [0.05] |
| Germany | 1.62 [0.11] | 1.52 [0.14] | 1.43 [0.58] | 0.16 [0.81] | 0.83 [0.20] | 0.80 [0.05] |
| Italy | 1.48 [0.05] | 1.93 [0.04] | 1.07 [0.61] | 0.70 [0.37] | 0.76 [0.42] | 0.82 [0.04] |
| Japan | 1.62 [0.06] | 1.94 [0.25] | 0.72 [0.37] | −0.82 [0.58] | 0.80 [0.25] | 0.78 [0.03] |
| Korean Republic | 1.66 [0.13] | 1.38 [0.25] | 0.80 [0.41] | −0.20 [0.44] | 0.99 [0.24] | 0.75 [0.06] |
| United Kingdom | 1.18 [0.08] | 1.51 [0.12] | 1.35 [0.70] | −0.14 [0.47] | 0.81 [0.40] | 0.76 [0.06] |
| United States | 1.94 [0.14] | 1.74 [0.08] | 1.03 [0.61] | −1.21 [0.84] | 0.85 [0.13] | 0.79 [0.04] |
| Panel B – As a group | 1.56 [0.23] | 1.64 [0.27] | 1.08 [0.60] | −0.11 [0.82] | 0.85 [0.26] | 0.78 [0.05] |
| Panel C – All G-20 | 1.00 [0.78] | 1.38 [0.45] | 0.71 [0.63] | 0.10 [0.74] | 0.86 [0.37] | 0.69 [0.14] |
Note: 1. DPTB is domestic private debt securities; DPUB is domestic public debt securities; IPTB is international private debt securities; IPUB is international public debt securities; CIBM is composite index bond market development; and PGDP is per capita economic growth. 2. Panel A comprises the G-20 developing countries; Panel B comprises the G-20 developed countries; Panel C is the G-20 countries combined. 3. Open values represent the mean of the variables, while [] represents the standard deviation of the variables. 4. Values reported here are the natural logs of the variables.
The samples are annual data ranging from 1990 to 2011 for the group of twenty (G-20) countries and are obtained from the World Development Indicators of the World Bank. The G-20 consists of 19 member countries plus the European Union, which is represented by the President of the European Council and by the European Central Bank (for details see: http://www.g20.org). The group of twenty is a pool of countries from different development stages; i.e., they include advanced, developing and emerging countries. Most importantly, they together represent about 90% global gross domestic product, 80% of global trade, and two-thirds of world's population (see, for instance, Halkos & Tzeremes, 2013). That is the reason we focus this group in order to examine the bond market development – economic growth nexus. Moreover, another reason to choose this group is mostly because of data availability of bond markets in most of the countries.
Although we look for G-20, within this group of developing and developed countries, we observed only 1811 member nations to our analysis.12 It is further divide into two sub-clusters. First, G-20 developing countries, which comprise nine countries: Argentina, Brazil, China, India, Indonesia, Mexico, the Russian Federation, South Africa, and Turkey (hereafter, Panel A). Second, G-20 developed countries, which comprise nine countries: Australia, Canada, France, Germany, Italy, Japan, the Korean Republic, the United Kingdom, and the United States.
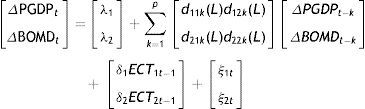
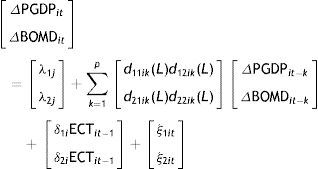
The study used the following model to detect the long-run and short-run causal relationships between PGDP and BOMD:
where PGDP is per capita economic growth; BOMD is the bond market development (it is representative for both composite index (CIBM) and its individual indicators such as DPTB, DPUB, IPTB and IPUB (the variables details are available in Table 1); i=1, 2, … N represents country in the G-20 panel; t=1, 2, … T refers to the time period in the panel; and ζit (for i=1 and 2) is an independently and normally distributed random error with a zero mean and a finite heterogeneous variance (σi2).
Of course, other variations of equation (1) are also entertained to change the dependent variable from PGDP to BOMD.13 When we looked for individual country analysis, the subscript ‘i’ was then removed from Eq. (1). The parameter β1PGDP represents the long-run elasticity estimates of PGDP with respect to BOMD. The task was to estimate the parameters in Eq. (1) and conduct panel tests on the causal nexus between these two variables. It is postulated that β1PGDP>0, which suggests that bond market development affects economic growth positively.
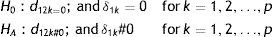
Furthermore, the Granger causality test is applied to know the direction of causality between bond market development and economic growth. We use Granger causality (GC) test for both individual country analysis and at the panel setting. The traditional GC model (Granger, 1988) and panel VAR14 model (Arellano & Bond, 1991) are used for the individual country analysis and the panel analysis, respectively. We use the below prescribed models for detecting the causal nexus between bond market development and economic growth.
- •
Model 1: For Individual country analysis
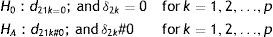
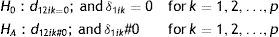
The null hypothesis is to test the following:where ECT15 is error correction term, which is derived from the long-run cointegration equation; p is the number of lags selected for the estimation; Δ is the first difference filter; and other notations are defined earlier. - •
Model 2: For panel data analysis
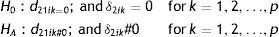
The null hypothesis is to test the following:
It can be noted that the choice of a particular model depends on the order of integration and the cointegrating relationship. We deploy unit root test and cointegration test, both at individual country and the panel setting, for knowing the order of integration and the presence of cointegrating relationship.
The traditional Phillips and Perron (PP) unit root test (PP; Phillips & Perron, 1988) is used for individual country analysis, while Im-Pesaran-Shin (IPS) panel unit root test (IPS; Im, Pesaran, & Shin, 2003) is used for the panel settings. On the other hand, Johansen (Johansen, 1988) cointegration test is used at the individual country analysis, while the Fisher-Maddala cointegration test (Maddala & Wu, 1999) is used at the panel setting. The details of these tests (unit root and cointegration) are not discussed here due to space constraints and can be incorporated, if there is any necessity.
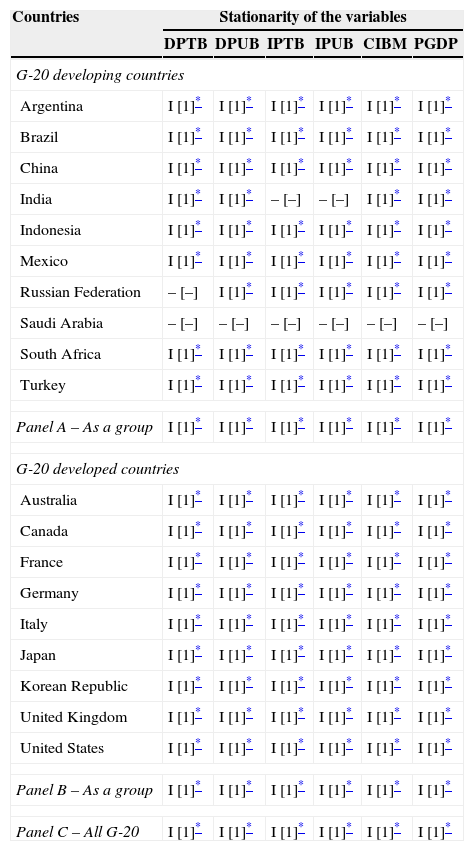
The discussion begins with the integration and cointegration between per capita economic growth (PGDP) and bond market development (BOMD).16 In the first step, using unit root (PP test at each of the individual country and IPS at the panel setting), we reject the null hypothesis of unit root at the first difference but not for the levels. The summary of the results of both the tests is reported in Table 5. With these results, we can declare that the variables of bond market development (CIBM, BPTB, DPUB, IPTB and IPUB) and economic growth (PGDP) are non-stationary at the level data but are stationary at the first difference. This is true for all the G-20 countries, both individually and at the panel setting. This suggests that both bond market development and economic growth are integrated of order one (i.e., I [1]) which opens the possibility of cointegration between them.
Results of unit root test.
| Countries | Stationarity of the variables | |||||
|---|---|---|---|---|---|---|
| DPTB | DPUB | IPTB | IPUB | CIBM | PGDP | |
| G-20 developing countries | ||||||
| Argentina | I [1]* | I [1]* | I [1]* | I [1]* | I [1]* | I [1]* |
| Brazil | I [1]* | I [1]* | I [1]* | I [1]* | I [1]* | I [1]* |
| China | I [1]* | I [1]* | I [1]* | I [1]* | I [1]* | I [1]* |
| India | I [1]* | I [1]* | – [–] | – [–] | I [1]* | I [1]* |
| Indonesia | I [1]* | I [1]* | I [1]* | I [1]* | I [1]* | I [1]* |
| Mexico | I [1]* | I [1]* | I [1]* | I [1]* | I [1]* | I [1]* |
| Russian Federation | – [–] | I [1]* | I [1]* | I [1]* | I [1]* | I [1]* |
| Saudi Arabia | – [–] | – [–] | – [–] | – [–] | – [–] | – [–] |
| South Africa | I [1]* | I [1]* | I [1]* | I [1]* | I [1]* | I [1]* |
| Turkey | I [1]* | I [1]* | I [1]* | I [1]* | I [1]* | I [1]* |
| Panel A – As a group | I [1]* | I [1]* | I [1]* | I [1]* | I [1]* | I [1]* |
| G-20 developed countries | ||||||
| Australia | I [1]* | I [1]* | I [1]* | I [1]* | I [1]* | I [1]* |
| Canada | I [1]* | I [1]* | I [1]* | I [1]* | I [1]* | I [1]* |
| France | I [1]* | I [1]* | I [1]* | I [1]* | I [1]* | I [1]* |
| Germany | I [1]* | I [1]* | I [1]* | I [1]* | I [1]* | I [1]* |
| Italy | I [1]* | I [1]* | I [1]* | I [1]* | I [1]* | I [1]* |
| Japan | I [1]* | I [1]* | I [1]* | I [1]* | I [1]* | I [1]* |
| Korean Republic | I [1]* | I [1]* | I [1]* | I [1]* | I [1]* | I [1]* |
| United Kingdom | I [1]* | I [1]* | I [1]* | I [1]* | I [1]* | I [1]* |
| United States | I [1]* | I [1]* | I [1]* | I [1]* | I [1]* | I [1]* |
| Panel B – As a group | I [1]* | I [1]* | I [1]* | I [1]* | I [1]* | I [1]* |
| Panel C – All G-20 | I [1]* | I [1]* | I [1]* | I [1]* | I [1]* | I [1]* |
Note: 1. DPTB is domestic private debt securities; DPUB is domestic public debt securities; IPTB is international private debt securities; IPUB is international public debt securities; CIBM is composite index bond market development; and PGDP is per capita economic growth. 2. Panel A comprises the G-20 developing countries; Panel B comprises the G-20 developed countries; Panel C is the G-20 countries combined. 3. The unit root test conclusions are reported on the basis of ADF and PP Test statistics for individual country and LLC and IPS Test statistics for panel level analysis. 4. ADF: Augmented Dickey Fuller; PP: Phillips and Perron; LLC: Levine-Lin-Chu; and IPS: Im-Pesearn-Shin. 5. I [1] stands for Integrated of order one.
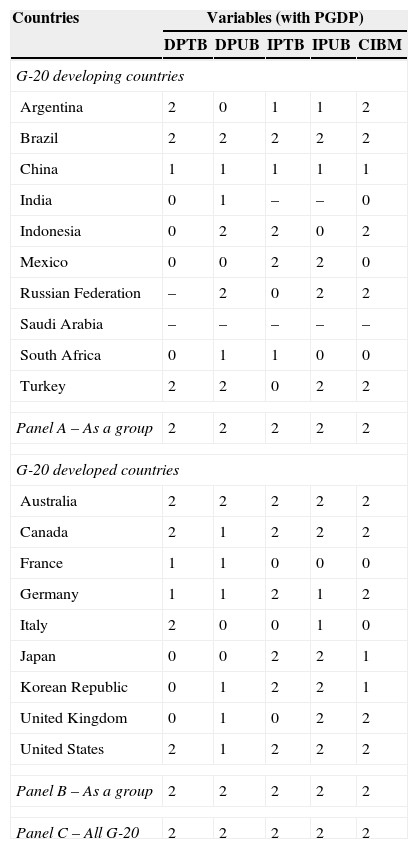
In the second step, using Johansen Maximum Likelihood cointegration test (by λTra and λMax test) at the individual country and Fisher cointegration test (by λTra and λMax test) at the panel setting, we reject the null-hypothesis of no-cointegration between per capita economic growth and bond market development. The summary of the results for both the tests is reported in Table 4. These results indicate that, in most of the cases (both at the individual country and at the panel setting), bond market development and economic growth are cointegrated, suggesting the existence of long-run relationships between them (see, for instance, Engle & Granger, 1987). However, cointegration does not exist between bond market development and economic growth in some cases (see Table 6); for these cases, we can declare the absence of long-run relationship between the bond market development and economic growth. However, in these cases, there may be the presence of short-run Granger causality.
Results of cointegration test.
| Countries | Variables (with PGDP) | ||||
|---|---|---|---|---|---|
| DPTB | DPUB | IPTB | IPUB | CIBM | |
| G-20 developing countries | |||||
| Argentina | 2 | 0 | 1 | 1 | 2 |
| Brazil | 2 | 2 | 2 | 2 | 2 |
| China | 1 | 1 | 1 | 1 | 1 |
| India | 0 | 1 | – | – | 0 |
| Indonesia | 0 | 2 | 2 | 0 | 2 |
| Mexico | 0 | 0 | 2 | 2 | 0 |
| Russian Federation | – | 2 | 0 | 2 | 2 |
| Saudi Arabia | – | – | – | – | – |
| South Africa | 0 | 1 | 1 | 0 | 0 |
| Turkey | 2 | 2 | 0 | 2 | 2 |
| Panel A – As a group | 2 | 2 | 2 | 2 | 2 |
| G-20 developed countries | |||||
| Australia | 2 | 2 | 2 | 2 | 2 |
| Canada | 2 | 1 | 2 | 2 | 2 |
| France | 1 | 1 | 0 | 0 | 0 |
| Germany | 1 | 1 | 2 | 1 | 2 |
| Italy | 2 | 0 | 0 | 1 | 0 |
| Japan | 0 | 0 | 2 | 2 | 1 |
| Korean Republic | 0 | 1 | 2 | 2 | 1 |
| United Kingdom | 0 | 1 | 0 | 2 | 2 |
| United States | 2 | 1 | 2 | 2 | 2 |
| Panel B – As a group | 2 | 2 | 2 | 2 | 2 |
| Panel C – All G-20 | 2 | 2 | 2 | 2 | 2 |
Note: 1. DPTB is domestic private debt securities; DPUB is domestic public debt securities; IPTB is international private debt securities; IPUB is international public debt securities; CIBM is composite index bond market development; and PGDP is per capita economic growth. 2. Panel A comprises the G-20 developing countries; Panel B comprises the G-20 developed countries; Panel C is the G-20 countries combined. 3. The cointegration test conclusions are reported on the basis of Johansen and Juselius test statistics for individual country and Fisher test statistics for panel level analysis. 4. 0: no cointegration between PGDP and bond market development (DPTB/DPUB/IPTB/IPUB/CIBM); 1: one cointegrating vector; and 2: Two cointegrating vectors. 5. The testing is conducted at the 5% level of significance.
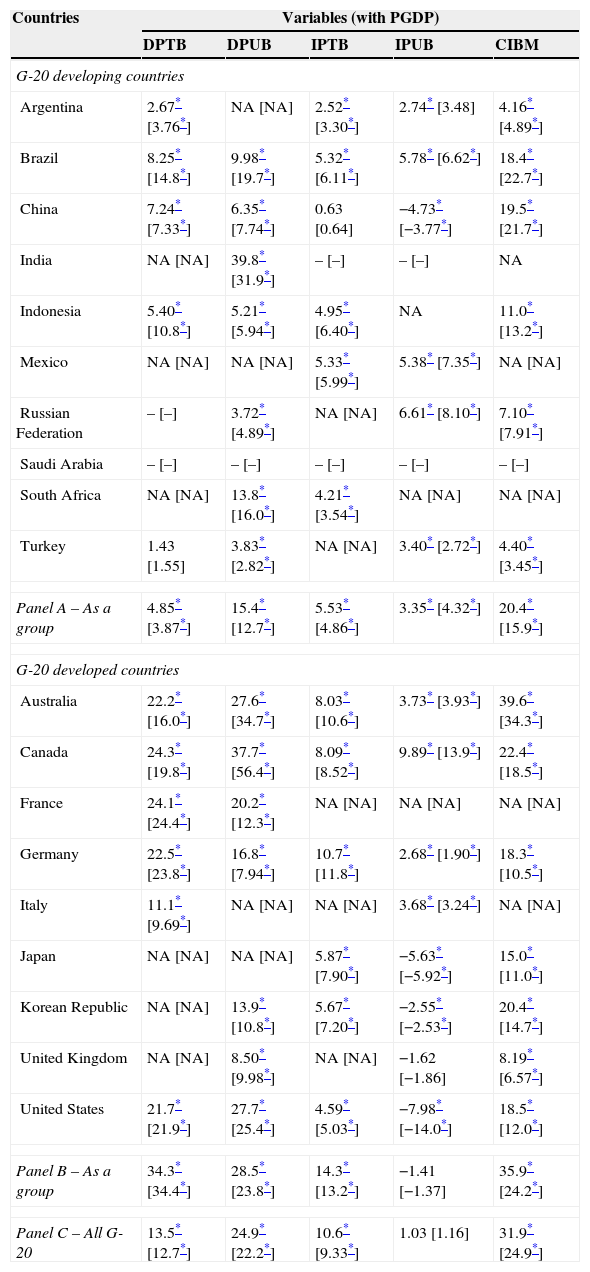
In the third step, having confirmation of the existence of cointegration relationship between per capita economic growth and bond market development, we estimate the associated long-run cointegration parameters by deploying two panel cointegration estimation techniques such as fully modified OLS (FMOLS17) and dynamic OLS (DOLS18). Table A.1 (see Appendix A) reports the estimated results of both FMOLS and DOLS. These results bring to the notice that bond market development significantly influencing the per capita economic growth in most of the cases19 and their impact is positive in nature in maximum cases. However, the degree of impact varies from case to case in a particular country (and a group) and country to country within a particular case.
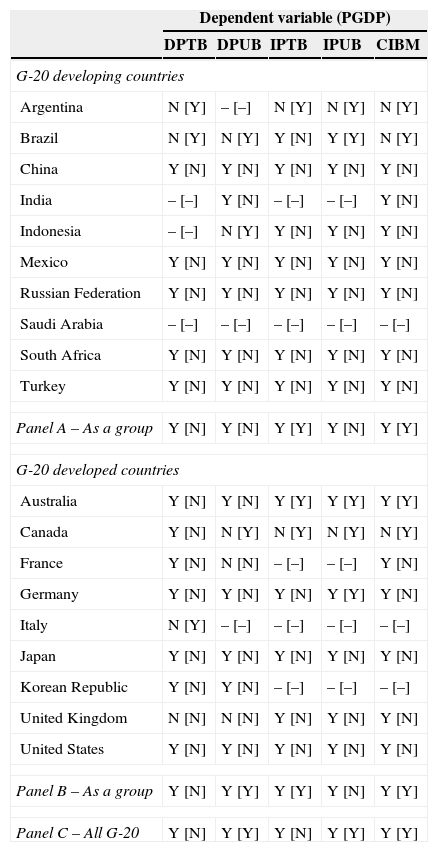
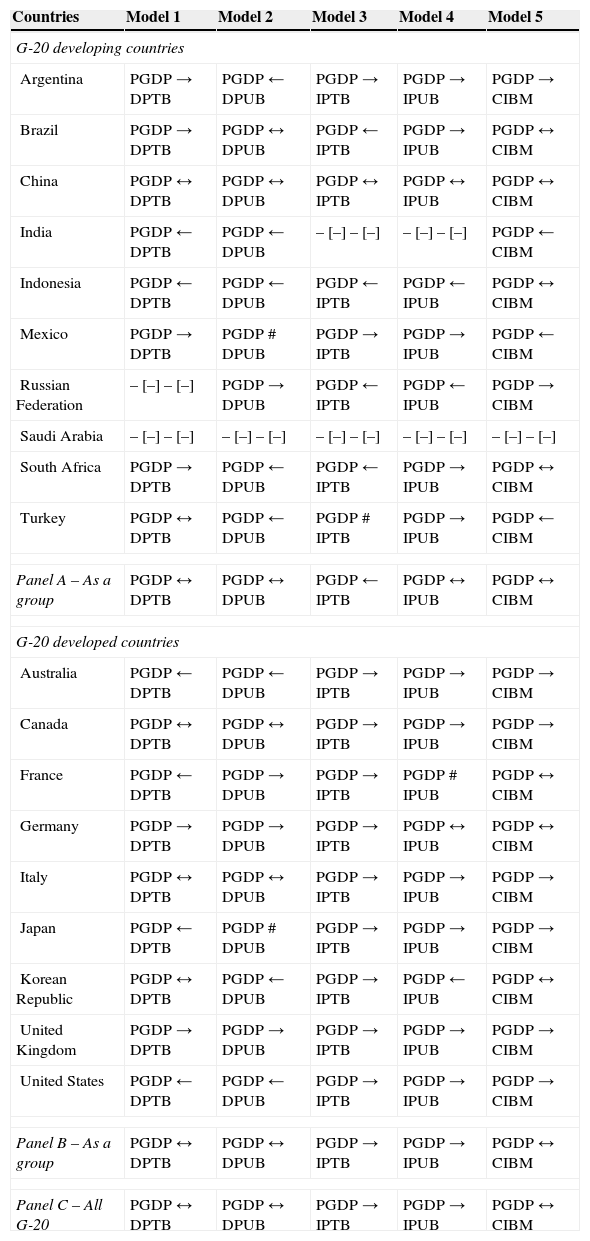
In the fourth step, we use Granger causality to know the direction of causality. The simple vector autoregressive (VAR) model is used where we find the absence of cointegration between economic growth and bond market development and the vector error correction model (VECM) is used where we find the presence of cointegration. The summary of these results is reported in Tables 7 and 8.
Results for the long-run granger causality test.
| Dependent variable (PGDP) | |||||
|---|---|---|---|---|---|
| DPTB | DPUB | IPTB | IPUB | CIBM | |
| G-20 developing countries | |||||
| Argentina | N [Y] | – [–] | N [Y] | N [Y] | N [Y] |
| Brazil | N [Y] | N [Y] | Y [N] | Y [Y] | N [Y] |
| China | Y [N] | Y [N] | Y [N] | Y [N] | Y [N] |
| India | – [–] | Y [N] | – [–] | – [–] | Y [N] |
| Indonesia | – [–] | N [Y] | Y [N] | Y [N] | Y [N] |
| Mexico | Y [N] | Y [N] | Y [N] | Y [N] | Y [N] |
| Russian Federation | Y [N] | Y [N] | Y [N] | Y [N] | Y [N] |
| Saudi Arabia | – [–] | – [–] | – [–] | – [–] | – [–] |
| South Africa | Y [N] | Y [N] | Y [N] | Y [N] | Y [N] |
| Turkey | Y [N] | Y [N] | Y [N] | Y [N] | Y [N] |
| Panel A – As a group | Y [N] | Y [N] | Y [Y] | Y [N] | Y [Y] |
| G-20 developed countries | |||||
| Australia | Y [N] | Y [N] | Y [Y] | Y [Y] | Y [Y] |
| Canada | Y [N] | N [Y] | N [Y] | N [Y] | N [Y] |
| France | Y [N] | N [N] | – [–] | – [–] | Y [N] |
| Germany | Y [N] | Y [N] | Y [N] | Y [Y] | Y [N] |
| Italy | N [Y] | – [–] | – [–] | – [–] | – [–] |
| Japan | Y [N] | Y [N] | Y [N] | Y [N] | Y [N] |
| Korean Republic | Y [N] | Y [N] | – [–] | – [–] | – [–] |
| United Kingdom | N [N] | N [N] | Y [N] | Y [N] | Y [N] |
| United States | Y [N] | Y [N] | Y [N] | Y [N] | Y [N] |
| Panel B – As a group | Y [N] | Y [Y] | Y [Y] | Y [N] | Y [Y] |
| Panel C – All G-20 | Y [N] | Y [Y] | Y [N] | Y [Y] | Y [Y] |
Note: 1. DPTB is domestic private debt securities; DPUB is domestic public debt securities; IPTB is international private debt securities; IPUB is international public debt securities; CIBM is composite index bond market development; and PGDP is per capita economic growth. 2. Panel A comprises the G-20 developing countries; Panel B comprises the G-20 developed countries; Panel C is the G-20 countries combined. 3. The conclusions are drawn on the basis of significance of the lagged error correction term. 4. Y: Yes, indicates the presence of long-run equilibrium relationship; N: No, indicates the absence of long-run equilibrium relationship; []: indicates the presence (Y)/absence (N) of reverse causality between PGDP and bond market development (DPTB/DPUB/IPTB/IPUB/CIBM). 5. Testing is conducted at the 5% level of significance.
Results for the short-run granger causality test.
| Countries | Model 1 | Model 2 | Model 3 | Model 4 | Model 5 |
|---|---|---|---|---|---|
| G-20 developing countries | |||||
| Argentina | PGDP→DPTB | PGDP←DPUB | PGDP→IPTB | PGDP→IPUB | PGDP→CIBM |
| Brazil | PGDP→DPTB | PGDP↔DPUB | PGDP←IPTB | PGDP→IPUB | PGDP↔CIBM |
| China | PGDP↔DPTB | PGDP↔DPUB | PGDP↔IPTB | PGDP↔IPUB | PGDP↔CIBM |
| India | PGDP←DPTB | PGDP←DPUB | – [–] – [–] | – [–] – [–] | PGDP←CIBM |
| Indonesia | PGDP←DPTB | PGDP←DPUB | PGDP←IPTB | PGDP←IPUB | PGDP↔CIBM |
| Mexico | PGDP→DPTB | PGDP # DPUB | PGDP→IPTB | PGDP→IPUB | PGDP←CIBM |
| Russian Federation | – [–] – [–] | PGDP→DPUB | PGDP←IPTB | PGDP←IPUB | PGDP→CIBM |
| Saudi Arabia | – [–] – [–] | – [–] – [–] | – [–] – [–] | – [–] – [–] | – [–] – [–] |
| South Africa | PGDP→DPTB | PGDP←DPUB | PGDP←IPTB | PGDP→IPUB | PGDP↔CIBM |
| Turkey | PGDP↔DPTB | PGDP←DPUB | PGDP # IPTB | PGDP→IPUB | PGDP←CIBM |
| Panel A – As a group | PGDP↔DPTB | PGDP↔DPUB | PGDP←IPTB | PGDP↔IPUB | PGDP↔CIBM |
| G-20 developed countries | |||||
| Australia | PGDP←DPTB | PGDP←DPUB | PGDP→IPTB | PGDP→IPUB | PGDP→CIBM |
| Canada | PGDP↔DPTB | PGDP↔DPUB | PGDP→IPTB | PGDP→IPUB | PGDP→CIBM |
| France | PGDP←DPTB | PGDP→DPUB | PGDP→IPTB | PGDP # IPUB | PGDP↔CIBM |
| Germany | PGDP→DPTB | PGDP→DPUB | PGDP→IPTB | PGDP↔IPUB | PGDP↔CIBM |
| Italy | PGDP↔DPTB | PGDP↔DPUB | PGDP→IPTB | PGDP→IPUB | PGDP→CIBM |
| Japan | PGDP←DPTB | PGDP # DPUB | PGDP→IPTB | PGDP→IPUB | PGDP→CIBM |
| Korean Republic | PGDP↔DPTB | PGDP←DPUB | PGDP→IPTB | PGDP←IPUB | PGDP↔CIBM |
| United Kingdom | PGDP→DPTB | PGDP→DPUB | PGDP→IPTB | PGDP→IPUB | PGDP→CIBM |
| United States | PGDP←DPTB | PGDP←DPUB | PGDP→IPTB | PGDP→IPUB | PGDP→CIBM |
| Panel B – As a group | PGDP↔DPTB | PGDP↔DPUB | PGDP→IPTB | PGDP→IPUB | PGDP↔CIBM |
| Panel C – All G-20 | PGDP↔DPTB | PGDP↔DPUB | PGDP→IPTB | PGDP→IPUB | PGDP↔CIBM |
Note: 1. DPTB is domestic private debt securities; DPUB is domestic public debt securities; IPTB is international private debt securities; IPUB is international public debt securities; CIBM is composite index of bond market development; and PGDP is per capita economic growth. 2. Panel A comprises the G-20 developing countries; Panel B comprises the G-20 developed countries; Panel C is the G-20 countries combined. 3. Model 1: Granger causality between DPTB and PGDP; Model 2: Granger causality between DPUB and PGDP; Model 3: Granger causality between IPTB and PGDP; Model 4: Granger causality between IPUB and PGDP; Model 5: Granger causality between CIBM and PGDP. 4. ←/→ is the presence of unidirectional causality between bond market development and per capita economic growth; ↔ is the presence of bidirectional causality between bond market development and per capita economic growth; and ≠ is the absence of Granger causality between bond market development and per capita economic growth. 5. Testing is conducted at the 5% level of significance.
Table 7 reports the presence of long-run equilibrium relationship20 between economic growth and bond market development (BOMD21), while Table 8 reports the short-run causal links between the two sets of variables. Coming to long-run equilibrium relationship, we find the divergence experience. In some cases, we find the presence of long-run equilibrium relationship, while it is absent in some other cases. Both are different with “Y” and “N” notations. The “Y” notation is used for the presence of long-run relationship between bond market development and economic growth, while “N” notation is used for the absence of long-run relationship between the two.
In the similar line, we have also seen the divergence experience in the context of short-run Granger causality between economic growth and bond market development. The results of this section are presented as follows.
- •
Case 1: Between DPTB and PGDP
For Argentina, Brazil, Mexico, South Africa, Germany, and the United Kingdom, there is a unidirectional causality from per capita economic growth (PGDP) to bond market development (PGDP→DPTB: domestic private debt securities), whereas for India, Indonesia, Australia, France, Japan, and the United States, bond market development Granger causes economic growth (PGDP←DPTB). Furthermore, for China, Turkey, Canada, Italy, South Korea, G-20 developing group, G-20 developed group and G-20 total countries, there is bidirectional causality between bond market development and economic growth (PGDP↔DPTB). In this case, there is support of supply-leading hypothesis (SLH), demand-following hypothesis (DFH) and feedback hypothesis (FBH) between economic growth and bond market development.
- •
Case 2: Between DPUB and PGDP
For Russian Federation, France, Germany, and the United Kingdom, there is a unidirectional causality from economic growth to bond market development (PGDP→DPUB: domestic public debt securities), whereas for Argentina, India, Indonesia, South Africa, Turkey, Australia, the Korean Republic, and the United States, bond market development Granger causes economic growth (PGDP←DPUB). Besides, for Brazil, China, Canada, Italy, G-20 developing group, G-20 developed group and G-20 total countries, there is bidirectional causality between bond market development and economic growth (PGDP↔DPUB), while in the context of Mexico and Japan, economic growth does not Granger cause bond market development (PGDP 〈#〉 DPUB). This follows finance, particularly on domestic public debt securities, and is unimportant for economic growth, i.e., the validity of Lucas neutrality hypothesis of finance-growth nexus.
In sum, case 2 supports all four probable hypotheses such as SLH, DFH, FBH, and neutrality hypothesis (NLH) between economic growth and bond market development. These findings are very similar in lines with Puente-Ajovin and Sanso-Navarro (2015), Marques et al. (2013) and Fink et al. (2006).
- •
Case 3: Between IPTB and PGDP
For Argentina, Mexico, Australia, Canada, France, Germany, Italy, Japan, South Korea, the United Kingdom, the United States, G-20 developed group and G-20 total countries, there is a unidirectional causality from economic growth to bond market development (PGDP→IPTB: international private debt securities), whereas for Brazil, Indonesia, Russian Federation, South Africa, and G-20 developing group, bond market development Granger causes economic growth (PGDP←IPTB). Additionally, for China, there is bidirectional causality between bond market development and economic growth (PGDP↔IPTB), while in the context of Turkey, economic growth does not Granger cause bond market development (PGDP 〈#〉 IPTB). The Case 3 also backs all four possible hypotheses between economic growth and bond market development, such as SLH, DFH, FBH, and NLH. These findings are again supported in lines with Puente-Ajovin and Sanso-Navarro (2015), Marques et al. (2013) and Fink et al. (2006).
- •
Case 4: Between IPUB and PGDP
For, Argentina, Brazil, Mexico, South Africa, Turkey, Australia, Canada, Italy, Japan, the United Kingdom, the United States, G-20 developed group and G-20 total countries, there is a unidirectional causality from economic growth to bond market development (PGDP→IPUB: international public debt securities), whereas for Indonesia, Russian Federation, and south Korea, bond market development Granger causes economic growth (PGDP←IPUB). In addition, for China, Germany, and the G-20 developing group, there is bidirectional causality between bond market development and economic growth (PGDP↔IPUB), while in the context of France, economic growth does not cause bond market development (PGDP 〈#〉 IPUB). The Case 4 also confirms all four potential hypotheses between economic growth and bond market development, such as SLH, DFH, FBH, and NLH. These findings are once more supported in lines with Puente-Ajovin and Sanso-Navarro (2015), Marques et al. (2013) and Fink et al. (2006).
- •
Case 5: Between CIBM and PGDP
For Argentina, Russian Federation, Australia, Canada, Italy, Japan, the United Kingdom, and the United States, there is a unidirectional causality from economic growth to bond market development (PGDP→CIBM: the composite index of bond market development), whereas for India, Mexico, and Turkey, bond market development Granger causes economic growth (PGDP←CIBM). Moreover, for Brazil, China, Indonesia, South Africa, France, Germany, South Korea, G-20 developing group, G-20 developed group and G-20 total countries, there is bidirectional causality between bond market development and economic growth (PGDP↔CIBM). However, we do not find any countries that have no causality between bond market development and economic growth (PGDP 〈#〉 CIBM). The Case 5 finally supports both unidirectional and bidirectional causalities between economic growth and bond market development. That means it is in line with the validity of first three hypotheses, such as SLH, DFH and FBH.
As is evident by these individual country results, the nature of the Granger causal relationship between bond market development and economic growth is more or less country specific and in the specification of bond market indicator(s).22 In some cases, bond market development Granger causes economic growth, while in the latter case, it is the economic growth that brings more bond market development. Again in some cases, they reinforce each other, while in some other cases; they do not cause each other, i.e., they have the neutrality relationship.
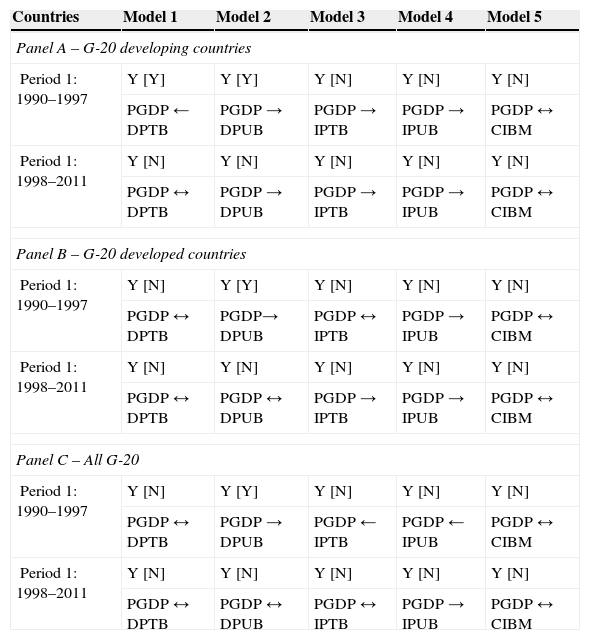
Over and above, the study examines the relationship between bond market development and economic growth in the G-20 countries during the period 1990–2011. However, it can be noted that the world was shocked with the global financial crisis in 2007 and it has left a remarkable impact on most of the countries including the G-20 countries that are sampled in this study. Therefore, we have also tested the relationship between bond market development and per capita economic growth by breaking up the period of study into two sub-periods (i.e., pre- and post-crisis of 2007). This is done at the panel levels only23 and the results are reported in Table A.2 (see Appendix A). The findings of these two periods (pre- and post-crisis of 1997) are more or less same like our full sample. That means we can confirm that global financial crisis in 2007 does not affect the relationship between bond market development and per capita economic growth in the G-20 countries at the panel level.
5Conclusion and policy implicationsThe development of the bond market development should not be overlooked because, like the banking sector development and stock markets development, it plays a vital role in stimulating economic growth (Thumrongvit et al., 2013). This study explored the nexus between bond market development and economic growth for the G-20 countries using time series date from 1990 to 2011. The focal message from our study for the policy-makers and researchers alike is that inferences drawn from research on economic growth that excludes the dynamic interrelation of the two variables will be defective. It is the conjoint interplay between these two variables that makes our study and guides the future research on this topic.
Our study concedes mixed evidence on the interrelationship between the bond market development and economic growth in the G-20 countries, both at the individual country and at the panel setting. In some occasions, economic growth leads to bond market development, lending support of demand-following hypothesis of finance-growth nexus. On the other occasions, it is the bond market development that determines the level of economic growth, lending support of supply-leading hypothesis of finance-growth nexus. There are also cases, where bond market development and economic growth cause each other. That is the situation where both are self-reinforcing and subject to the support of feedback hypothesis of finance-growth nexus. The findings are very similar like Hsueh, Hu, and Tu (2013); they studied ten Asian countries, the Philippines, Malaysia, Indonesia, Korea, India, Singapore, Thailand, Taiwan, China and Japan, for the period 1980–2007 by using four financial development indicators.
The study accordingly suggests that in order to promote economic growth, attention must be paid to policies that promote the bond market development. This, in turn, requires efficient allocation of financial resources combined with sound assurances to bond market development (see, for instance, Felman et al., 2014; Gray, Felman, Carvajal, & Jobst, 2014).
Furthermore, an establishment of a well-developed financial system, including well functioning of financial institutions, particularly with reference to bond market development can facilitate further investment and easier means of raising capital to support the economic activities in the economy. Given the possibility of reverse Granger causality or bidirectional Granger causality for some occasions, policies that increase economic growth (such as actions to fuel investment) would be desirable to bring the bond market development. Therefore, with respect to both policy makers and researchers, this paper implies that bond market really plays a key role that a number of studies in finance usually ignored. So, what is suggestive is that both policy makers and researchers should work together in order to stimulate both bond market development and economic growth (see, for instance, World Bank, 2006; Fink, Haiss, & Mantler, 2005). Finally, the issue this paper has not investigated is the relationship between bond market development and economic growth in a multivariate framework by involving the integration with banks and stock market development. Further research is needed on this area in G-20 countries, as well as in other developing and developed group of countries.
Results of FMOLS and DOLS.
| Countries | Variables (with PGDP) | ||||
|---|---|---|---|---|---|
| DPTB | DPUB | IPTB | IPUB | CIBM | |
| G-20 developing countries | |||||
| Argentina | 2.67* [3.76*] | NA [NA] | 2.52* [3.30*] | 2.74* [3.48] | 4.16* [4.89*] |
| Brazil | 8.25* [14.8*] | 9.98* [19.7*] | 5.32* [6.11*] | 5.78* [6.62*] | 18.4* [22.7*] |
| China | 7.24* [7.33*] | 6.35* [7.74*] | 0.63 [0.64] | −4.73* [−3.77*] | 19.5* [21.7*] |
| India | NA [NA] | 39.8* [31.9*] | – [–] | – [–] | NA |
| Indonesia | 5.40* [10.8*] | 5.21* [5.94*] | 4.95* [6.40*] | NA | 11.0* [13.2*] |
| Mexico | NA [NA] | NA [NA] | 5.33* [5.99*] | 5.38* [7.35*] | NA [NA] |
| Russian Federation | – [–] | 3.72* [4.89*] | NA [NA] | 6.61* [8.10*] | 7.10* [7.91*] |
| Saudi Arabia | – [–] | – [–] | – [–] | – [–] | – [–] |
| South Africa | NA [NA] | 13.8* [16.0*] | 4.21* [3.54*] | NA [NA] | NA [NA] |
| Turkey | 1.43 [1.55] | 3.83* [2.82*] | NA [NA] | 3.40* [2.72*] | 4.40* [3.45*] |
| Panel A – As a group | 4.85* [3.87*] | 15.4* [12.7*] | 5.53* [4.86*] | 3.35* [4.32*] | 20.4* [15.9*] |
| G-20 developed countries | |||||
| Australia | 22.2* [16.0*] | 27.6* [34.7*] | 8.03* [10.6*] | 3.73* [3.93*] | 39.6* [34.3*] |
| Canada | 24.3* [19.8*] | 37.7* [56.4*] | 8.09* [8.52*] | 9.89* [13.9*] | 22.4* [18.5*] |
| France | 24.1* [24.4*] | 20.2* [12.3*] | NA [NA] | NA [NA] | NA [NA] |
| Germany | 22.5* [23.8*] | 16.8* [7.94*] | 10.7* [11.8*] | 2.68* [1.90*] | 18.3* [10.5*] |
| Italy | 11.1* [9.69*] | NA [NA] | NA [NA] | 3.68* [3.24*] | NA [NA] |
| Japan | NA [NA] | NA [NA] | 5.87* [7.90*] | −5.63* [−5.92*] | 15.0* [11.0*] |
| Korean Republic | NA [NA] | 13.9* [10.8*] | 5.67* [7.20*] | −2.55* [−2.53*] | 20.4* [14.7*] |
| United Kingdom | NA [NA] | 8.50* [9.98*] | NA [NA] | −1.62 [−1.86] | 8.19* [6.57*] |
| United States | 21.7* [21.9*] | 27.7* [25.4*] | 4.59* [5.03*] | −7.98* [−14.0*] | 18.5* [12.0*] |
| Panel B – As a group | 34.3* [34.4*] | 28.5* [23.8*] | 14.3* [13.2*] | −1.41 [−1.37] | 35.9* [24.2*] |
| Panel C – All G-20 | 13.5* [12.7*] | 24.9* [22.2*] | 10.6* [9.33*] | 1.03 [1.16] | 31.9* [24.9*] |
Note: 1. DPTB is domestic private debt securities; DPUB is domestic public debt securities; IPTB is international private debt securities; IPUB is international public debt securities; CIBM is composite index bond market development; PGDP is per capita economic growth; and FMOLS is fully modified ordinary least squares and DOLS is dynamic ordinary least squares. 2. Panel A comprises the G-20 developing countries; Panel B comprises the G-20 developed countries; Panel C is the G-20 countries combined. 3. Open values represent the results of FMOLS, while [] represents the results of DOLS. 4. NA [NA] means the FMOLS and DOLS are not available due to the non-existence of cointegration relationship between PGDP and any of the bond market indicators (on the basis of results in Table 6), while – [–] means FMOLS and DOLS are not feasible due to non-availability of data. 5. The testing is conducted at the 5% level of significance.
Results of granger causality test between two time periods (at panel level).
| Countries | Model 1 | Model 2 | Model 3 | Model 4 | Model 5 |
|---|---|---|---|---|---|
| Panel A – G-20 developing countries | |||||
| Period 1: 1990–1997 | Y [Y] | Y [Y] | Y [N] | Y [N] | Y [N] |
| PGDP←DPTB | PGDP→DPUB | PGDP→IPTB | PGDP→IPUB | PGDP↔CIBM | |
| Period 1: 1998–2011 | Y [N] | Y [N] | Y [N] | Y [N] | Y [N] |
| PGDP↔DPTB | PGDP→DPUB | PGDP→IPTB | PGDP→IPUB | PGDP↔CIBM | |
| Panel B – G-20 developed countries | |||||
| Period 1: 1990–1997 | Y [N] | Y [Y] | Y [N] | Y [N] | Y [N] |
| PGDP↔DPTB | PGDP→ DPUB | PGDP↔IPTB | PGDP→IPUB | PGDP↔CIBM | |
| Period 1: 1998–2011 | Y [N] | Y [N] | Y [N] | Y [N] | Y [N] |
| PGDP↔DPTB | PGDP↔DPUB | PGDP→IPTB | PGDP→IPUB | PGDP↔CIBM | |
| Panel C – All G-20 | |||||
| Period 1: 1990–1997 | Y [N] | Y [Y] | Y [N] | Y [N] | Y [N] |
| PGDP↔DPTB | PGDP→DPUB | PGDP←IPTB | PGDP←IPUB | PGDP↔CIBM | |
| Period 1: 1998–2011 | Y [N] | Y [N] | Y [N] | Y [N] | Y [N] |
| PGDP↔DPTB | PGDP↔DPUB | PGDP↔IPTB | PGDP→IPUB | PGDP↔CIBM | |
Note: 1. DPTB is domestic private debt securities; DPUB is domestic public debt securities; IPTB is international private debt securities; IPUB is international public debt securities; CIBM is composite index of bond market development; and PGDP is per capita economic growth. 2. Panel A comprises the G-20 developing countries; Panel B comprises the G-20 developed countries; Panel C is the G-20 countries combined. 3. Model 1: Granger causality between DPTB and PGDP; Model 2: Granger causality between DPUB and PGDP; Model 3: Granger causality between IPTB and PGDP; Model 4: Granger causality between IPUB and PGDP; Model 5: Granger causality between CIBM and PGDP. 4. ←/→ is the presence of unidirectional causality between bond market development and per capita economic growth; And ↔ is the presence of bidirectional causality between bond market development and per capita economic growth. 5. Testing is conducted at the 5% level of significance. 6. All variables are integrated of order one and cointegrated at the 5% level of significance.
The four dimensions of bond market development include domestic private debt securities, domestic public debt securities, international private debt securities, and international public debt securities. The details discussions of these four variables are available in Table 1. These are extensively used as proxies for bond market activities and particularly with reference to the studies on the relationships between bond market development, and macroeconomic factors such as gross domestic product, interest rate, inflation, and so on (see, for instance, Fink, Haiss, & Histofrova, 2003; Mu, Phelps, & Stotsky, 2013; Thumrongvit et al., 2013).
Financial sector development refers to aggregate size of the financial sector, its sectorial composition, and a range of attributes of individual sectors that determine their effectiveness in meeting users’ requirements. The evaluation of financial structure should cover the roles of the key institutional players, including the central bank, commercial and merchant banks, saving institutions, development financial institutions, insurance companies, mortgage entities, pension funds, the stock market, and other financial market institutions (Anwar and Cooray, 2012; IMF, 2002; Levine, 2005).
Financial development leads not only to an increase in the quantity of capital, but more importantly, also to an improvement in the quality of capital. It is through the quality of capital that finance contributes to growth (Kleimeier and Versteeg, 2010).
The inclusion of bond market development in economic growth are documented in the following literatures: Panizza and Presbitero (2013, 2014), Matei (2013a), Bhattacharyay (2011, 2013), Kourtellos, Stengos, and Tan (2013), Checherita-Westphal and Rother (2012), Said (2012), Goswami and Sharma (2011), Adelegan and Radzewicz-Bak (2009), Borensztein, Eichengreen, and Panizza (2006), Braun and Briones (2006), Eichengreen (2006), Eichengreen, Borensztein, and Panizza (2006), Eichengreen and Luengnaruemitchai (2004), Cheung and Chan (2002), Haiss and Marin (2005), Claessens, Klingebiel, and Schmukler (2003), Batten and Kim (2001), and Rahman and Mustafa (1997).
Bond market financing, like other financial services, has fully grown in quantitative importance as an integral part of the general development of the financial sector, with the emphasis more recently pitching to finance business (World Bank, 2006).
Bond market development has grown in importance to become a central theme in finance in the recent years (Fabella and Madhur, 2003; Felman et al., 2014; Herring and Chatusripitak, 2001; Kahn, 2005; Mieno, Nagano, Takayasu, Takeda, & Nagai, 2009).
For instance, over the past few decades, ASEAN policy makers have devoted considerable effort to developing their bond markets. The most important efforts are improvement of market infrastructure, expansion of domestic investor bases, encouragement of foreign investment funds, and so forth (Gray et al., 2014).
The PCA is a data reduction technique, which transforms original set of variables into new set of variables that are not correlated and solves the multicolinearity problem in the data analysis (see, for instance, Meyers, Gamst, & Guarino, 2013; Warner, 2013).
CIBM is the weighted average of four bond market indicators such as DPTB, DPUB, IPTB and IPUB.
All these variables were converted into their natural logarithms for estimation purposes.
The Saudi Arabia was not included in the analysis, due to non-availability of data.
Including the European Union, the twentieth member, would have meant double-counting four countries: France, Germany, Italy, and the United Kingdom.
BOMD is used for CIBM, DPTB, DPUB, IPTB and IPUB.
VAR stands for vector autoregressive model.
The inclusion of ECT depends upon the existence of cointegration between bond market development and economic growth. If the cointegration does not exist, ECT will be omitted in the estimation process.
BOMD is used for CIBM, DPTB, DPUB, IPTB and IPUB.
FMOLS is a non-parametric approach, taking into account the possible correlation between the error term and the first differences of the regressor as well as the presence of a constant term to deal with corrections for serial correlation (see, for instance, Maeso-Fernandez, Osbat, & Schnatz, 2006; Pedroni, 2000, 2001).
DOLS is a parametric approach, which adjusts the errors by augmenting the static regression with leads, lags, and contemporaneous values of the regressor in first differences (see, for instance, Kao & Chiang, 2000).
That is with respect to different indicators of bond market development such as DPTB, DPUB, IPTB, IPUB, and CIBM.
It is judged on the basis of the significance of error correction terms (ECTs) in Eqs. (2) and (3), respectively.

www.publicationethics.org.