


Analyzing several indicators from the decades of 1980 to 2000, such as income distribution, access to social services of education, health and pensions, the paper concludes that inequality in the access to social services is more severe than income inequality. The paper also shows that to capture variation in income distribution in Chile is recommendable to use a wide variety of indicators, besides de Gini Coefficient.
1. Overview
Which are the most serious expressions of inequality and/ or inequity in Chile? Various papers have identifi ed Chile as a country with a large inequality. This statement is based on estimations that use the Gini coefficient, and since the numerical value of Chile's Gini is higher than that of other countries, the characterization of Chile as an unequal country appears as a logical consequence. According to the data provided by MIDEPLAN (2010), this coefficient has remained practically stagnant at around 0.57 between 1990 and 2003, while it dropped slightly to 0.53 in 2006 and 2009.
In this context, a first relevant matter is to analyze the behavior of alternative indicators and compare them with the overwhelmingly used Gini coefficient. Another relevant question is the discussion on whether income is the central dimension for estimating the difference in the welfare accessible to people, or whether there are categories that conceptually come before it, and if the impression generated by the analysis of those other welfare categories differs from that caused by the income distribution perspective.
The discussion on inequality has centered on income inequality, and only since a few years ago there has been academic work on other dimensions which express the differences in access to welfare. The work of Medrano et al. (2005) on income, consumption, education and health inequalities in Latin America, and that of Marín & Jadue (2005) on social determinants of health, which detects health inequities in Chile, took up the need to open the discussion to the analysis of alternative income categories.
Analyses of income inequality in Chile has centered on the use of the Gini coefficient (alternative indicators have been used very rarely) and the 20/20 index, in view of the ease of interpretation of these indicators, but little attention has been given to their limitations. For example, using the Gini coefficient, several studies have shown a persistent inequality in Chile (Pizzolitto, 2005; Giovagnoli, Pizzolitto & Trias, 2005; Bravo et al. 2002; Beyer, 1997) and according to labor market data for Santiago, the inequality indices in the second half of the 1950s would be similar to those of the late of 1990s (Larrañaga, 2001; Ruiz-Tagle, 1999). From a comparative standpoint, various studies indicate that Chile may be one of the most unequal countries in Latin America (Pizzolitto, 2005) and in the world (Bravo et al., 2002), and it would be more unequal than comparable countries in East Asia, the Middle East, North Africa, and Sub-Saharan Africa (Chumacero & Paredes, 2002).
Recent works have challenged this extended view about Chile's high inequality. Libertad y Desarrollo (2011) argues that if government subsidies in housing, health and education are considered Chilean inequality indicators are not that bad. Similarly, Sapelli (2011) states that Chile is more egalitarian that it is commonly believed, that social indicators of distribution have been improving for several decades, and that the analysis at the cohorts level shows that the Gini Coefficient of income distribution of people born in the late 1970s is eight points lower than that of those born in the 1950s.Although interesting and backed by sophisticated technical instruments, the excessive concentration of studies on a single indicator can potentially affect the validity of their conclusions.Concentration of the analysis of inequality on the monetary dimension, and particularly on the Gini coefficient, requires calling attention on the riskiness of this practice, since this is a phenomenon that has many dimensions, so it would be practicable to analyze it from various perspectives. On this point, Atria (2008) argues that "the barriers that prevent equal opportunities are diverse, so equity can not be analyzed by a single indicator, regardless of how important it is." This leads to expand the analysis to a variety of indicators that take into account the dimensions of income, but also and basically those dimensions that are in the foundations of the welfare opportunities to which each person has access.Thus, this study proposes, first, to verify whether inequality in Chile has remained virtually unchanged throughout the period covered by the CASEN surveys —for which a wide range of indicators beyond the Gini coefficient will be used—, and whether the welfare of the poor has remained unchanged. The paper will also examine non-monetary dimensions related to equity in access to welfare opportunities.
The article is organized in five sections. After this introduction we present the conceptual debate and methodological issues surrounding the construction of the inequality-equity indicators. The next section presents the data used, the operational definitions with which the data have been analyzed, and the ways in which Chilean inequality-equity indicators have been estimated. The fourth section displays the results of the estimates. The final section presents a discussion of the findings, conclusions and implications derived from the work.
2. Conceptual and methodological issues
2.1. The conceptual currents
The development of studies on poverty, inequality, and human welfare in general has been shaping two noticeable trends: on the one hand the economics current and on the other the multidimensional current. The former, derived from welfare economics, uses micro-instruments and indicators based on monetary measures of income or consumption to set up comparisons of levels of welfare by individuals or groups. This current assumes a rational behavior of individuals which leads them to maximize the profit they make from their decisions or their actions. So it would be the people themselves that best identify what brings them utility and increases their welfare. Accordingly, then, people would be inclined to satisfy only ordered, transitive and stable preferences, regardless of whether such preferences are selfish or altruistic (Lane, 1996). Under this assumption, the economic approach uses income or consumption variables, as substitutes, albeit imperfect, of the levels of utility or welfare. Well-being is thought "as the command over commodities in general, so people are better off if they have a greater command over resources to meet their needs" (Haughton & Khandker, 2009, p. 2). Thus, those who are below a certain threshold of income or consumption would be considered poor, and estimates of inequality in a given community would indicate differences in the level of utility or welfare, measured by the income or consumption of its members. On this, Ortiz & Cummins (2011, p. 1) state "while income is just one measure of inequality, it is often closely associated with social inequalities in terms of coverage and outcomes".
The multidimensional current advocates the need to develop an integral view of human welfare, adding extra dimensions to income or consumption. Along this line, Boltvinik (1990) argues that income or consumption are just one of the variables that determine the satisfaction of needs, and ultimately of welfare, and that others, as important as income or consumption, would determine the right of access to government goods and services, to ownership of assets or basic accumulated net worth, time available for education, leisure, recreation, and household work, in addition to ownership of non-basic assets. Thus, the Basic Needs approach suggests that monetary measures of welfare do not take into account the specific situation of satisfaction or dissatisfaction of basic needs, and that they point at a rather indirect issue of potential satisfaction of basic needs through the availability of certain income. Haughton & Khandker (2009, p. 2) argue that this type of analysis goes beyond the more traditional monetary measure of well-being and focuses on "whether people are able to obtain specific type of consumption good: Do they have enough food? Or shelter? Or health care? Or education?
Also, the capabilities and functionings approach, inspired by Amartya Sen, is focused on the basic social conditions that lead people to live the kind of life that everyone has a reason to value (Sen, 2000). Capabilities are a reflection of the basic freedom of people, which depends on such factors as personal characteristics and social arrangements, issues which in turn influence the possibility of choosing one type of life or another. The functionings can range from mainly physical, such as being well fed, having adequate clothing and shelter, being healthy, to more complex social achievements such as participating in community life or being able to appear in public without feeling shame, for example (Sen, 1995). Sen (2000) clarifies that income and capabilities are two related dimensions: income is an important means for the capability building process, although the possibility of achieving basic capabilities may be associated with different income levels, depending on the individual and society, and because the expansion of capabilities makes people more productive and lets them earn higher income.
Thus, multidimensional approaches have emphasized access to essential goods and services that are of great importance in the process of generation and expansion of capabilities, because in that way they create the primary conditions for people to meet their basic wide spectrum of human needs to live a good human life and achieve social integration. The counterpoint between these trends has led to an expansion of the concepts of poverty and inequality, which have been gradually picking up the dimensions claimed by the approaches of basic needs and of capabilities and achievements (see Figure 1, for example). This leads to changing the focus of studies of poverty and inequality, from simple income/ consumption to opportunities, assets, vulnerability and social exclusion (Bourguignon, 2006).
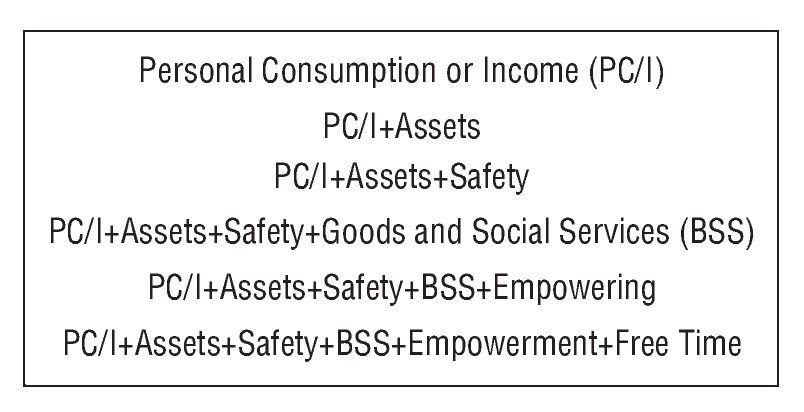
Figure 1 OECD: Diagram of the expansion of the concept of poverty. Source: OECD, DAC Guidelines on Poverty Reduction 2000, cited in Atria (2008).
Extending the concept of poverty also leads to the broadening of the concept of inequality. The idea of inequality refers to the fact that people reach different achievements or accomplishments or have different income, but since societies are heterogeneous and different, it is natural to expect diversity of achievement and income. Haughton & Khandker (2009, p. 3) states that "inequality focuses on the distribution of attributes, such as income or consumption, across the whole population". On this, Sen (2006) argues that the transformation of earnings into capabilities and finally into achievements depends on various personal factors, such as, for example, the propensity to develop diseases that are hereditary and related to the environment in which people live. Since welfare opportunities are intrinsically linked to the development of abilities and possibilities of access to essential social services such as health, education and social protection, attention is shifted to the need to identify if there are people or groups that face serious difficulties in accessing the required resources or social services or that enable them to participate in social life and enjoy the standard of living that is common in a given society.1 Thus, the idea of inequality, which involves the statement of a fact, leads to the notion of inequity, which is oriented at identifying and removing the barriers that prevent access to the welfare that is common to certain groups in a given society.
The complication in the effort to expand the concept of inequality and inequity, in order to include the dimension mentioned above has been, however, the generation of measures of poverty and inequity that can collect and operationalize these new dimensions. In this respect, Grusky & Kanbur (2006) indicate that it is necessary to develop new methods for measuring poverty and inequality in this multidimensional space, but that is a difficult task due to the large number of parameters required to characterize this multidimensionality. The popularity achieved by the approach to inequality based on monetary measures lies in its ease of understanding and operationalization and its application to public policy analysis, as well as to the characterization of the problems of poverty and inequality-inequity that will be addressed, and to the evaluation of these interventions. The multidimensional approach, however, is complex.
Therefore, Bourguignon (2006) suggests that this task requires expanding the income/consumption approach rather than abandoning it, in view of the problems of measurement and operability that are still presented by the multidimensional approach, and since there is complementarity between the two streams. For example, in this relationship between income and capabilities, Sen (1998) concludes that "the most adequate characterization, from the standpoint of reason, of poverty as a failure of basic capabilities, can also be made in the more traditional format of inadequate income." Also, in an analogy designed to highlight the complementarity of both currents, Duclos & Araar (2006) state that the difference between the basic needs approach and that of capabilities and achievements is analogous to the difference between the use of income and consumption as measures of welfare: income would show the capability to consume, while consumption may be understood as the result of exercising that capability.
In this context, in which, on the one hand, there is a recognition that poverty and inequality are multidimensional phenomena, but that the operationalization and measurement of these multiple dimensions is still a difficult and unfinished task and will remain so for not a short time, and, on the other hand, that the measurements based on income or consumption are easy to understand and operationalize for the analysis of public policies, this approach continues to provide, overwhelmingly, the database normally used in studies of poverty and inequality-inequity.
This makes it imperative for the studies to take due account of the limitations of this approach and the weaknesses of the indicators used. In order to weight the central methodological issues and the data with which the measures of inequality are constructed, the following parts of this section present a review of the main indicators and the type of data used.
2.2. The indicators of inequality
Several indicators have been constructed to estimate inequality.2 One type of indicators used in various specialized studies are statistical measures of the range of variation, relative mean deviation, variance, coefficient of variation, and variance of the logarithms. Other types of indicators that are often used in the analysis of inequality and inequity include the Gini coefficient, the Atkinson index, the Dalton index,3 the Theil index,4 and the Generalized Entropy (GE) index.5 Measures of the income share of the richest with respect to the poorest, such as the 20/20, 10/10 and 10/40 indices,6 are also employed repeatedly to show the degree of inequality and inequity in a given society.
Of these the most popularly used is the Gini coefficient, estimated using the "Lorenz curve", that seeks to measure whether there is a concentration of income in a society. From it a relationship between the actual distribution and a perfectly equal distribution is determined. The coefficient goes from zero (0) to one (1), where zero indicates maximum equality, with all having the same income, and one indicates maximum concentration, with a single person concentrating the income of the whole group. Thus, the closer to zero the coefficient, the greater the tendency to equality in the distribution of income (or consumption), while the closer the ratio is to one, the greater the degree of inequality.
Since its appearance in 1912 and its reformulation in 1914, the Gini coefficient has become popular, and nowadays it is overwhelmingly used. Despite that it is necessary to consider the methodological basis for the construction of the coefficient, its scope, and the validity of the comparisons.
A first precaution to be taken is that this coefficient would be more sensitive to changes occurring around the central value of the distribution, to which it gives greater weight (Duclos & Araar, 2006), so transfers to the ends of the distribution would not be captured similarly. This indicates that the effect of changes in income or consumption of the poorest and/or the richest in total inequality would be underestimated by the Gini coefficient.
A second precaution to be taken is that the estimates based on microdata and aggregate data provide different results. For example, somewhat recurrently the Gini coefficient is estimated from specific intervals of the distribution in deciles or quintiles, but this implies an underestimation of inequality, because what one gets is the inequalities between deciles or quintiles, failing to capture inequality within the intervals. Similarly, a third precaution is to see if the Gini coefficient has been estimated from individual or household data. Estimates based on household data tend to produce lower estimates of inequality because they do not capture the fact that poorer households are more numerous.
A fourth precaution should be considered with international comparisons: whether the estimates are based on disaggregated data or not, whether they refer to households or individuals, whether they are derived from consumption or income, the geographical coverage of the survey that collected the data, the type of income, and the seasonality of the data used in the estimates are issues that will have incidence in the estimation of the Gini coefficient and will affect the quality of the comparisons. These issues are discussed in the next section.
Beyond the above mentioned precautions, it is also necessary to consider the criticisms that the Gini coefficient has received. Perhaps the hardest of all has been that made by Atkinson (1970), who says that this coefficient, together with others used commonly, such as variance and the coefficient of variation, yield misleading measurements because, first, it does not specify the form of the social welfare function that would establish an arrangement of the distributions, and second, because —according to Atkinson— it contradicts social values by giving more weight to transfers at the center of the distribution than to those towards the extremes, particularly those oriented to the poorest.7 On this point, Creedy (1998) notes that the Gini coefficient is not consistent with a social welfare function that values aversion to inequality.
Atkinson proposed an alternative measure of inequality — known as the Atkinson index-, which is based on an explicit social welfare function with alternative degrees of aversion to inequality, and the principle of "equally distributed equivalent income level." This principle identifies the income, which, if obtained by each one, produces the same level of social welfare as the existing distribution. Although the Atkinson index allows the incorporation of parameters that increase the relative importance of the poorest in the distribution, it is less used than the Gini coefficient. The reason would perhaps be the simplicity of interpretation of the Gini coefficient compared to the Atkinson index.
The other indicators of inequality mentioned, the Dalton Index, the Theil index, and the Generalized Entropy index, are considerably less used than the previous ones. The difficulty with the Dalton index is that its practical usefulness is limited by the variations that it undergoes with the transformations of the utility function on which it is based. The difficult interpretation of Theil and GE makes them little used.
2.3. The data
Beside the discussion about what kind of indicators should be used in the estimation of inequality, the analysis has also focused on the data that give rise to the indicators. For example, Panizza (1999) argues that only a small number of surveys that provide data for estimations of income distribution and poverty in developing countries meet the minimum criteria of reliability and comparability, that the problem is particularly serious with respect to income distribution data, and that many of the problems are concentrated on the methods of data collection and aggregation, small sample size, and inadequate treatment of the informal sector.
One of the recurring themes addressed in the methodological discussion regarding the estimations of inequality is whether they are based on income or consumption. In general, estimations based on consumption are more equalitarian than estimations based on income. The reason for this is that the better-off groups save, but this does not occur among the poorest groups, who spend all their income or more for consumption.8 Additionally, in cases of autoconsumption, identifying the price at which that consumption will be assessed has an effect on the estimation of inequality. On the other hand, consumption is more stable and less variable than income, which is more subject to seasonal variations, suggesting that people will use their allocated resources over time (Deaton & Zaidi, 1999): they would save at times of prosperity and would unsave at times of difficulty.
The type of income, the definition that will be used, and the reliability of the data issued by the various sources of income generation will also affect the quality of the estimations. Feres (2000) shows that estimates based on total household income (ranked by per capita income) produce a Gini coefficient lower than those based on household per capita income, and that changing the unit of analysis from households to persons in the household per capita income, generates slightly lower estimations. On the other hand, Székely & Hilgert (1999), in an analysis of inequality in 18 Latin American countries, specify four income categories and find that there is no uniformity in the data collected by the surveys.The same authors identify that informal self-employment in the 18 countries analyzed, on which there is low reliability with respect to income data, varies from 19.1% in Chile to 46.6% in Peru, with an average of 28.1%. On this same income source Feres (2004) shows that the non-response rate in 1999 among self-employed workers varied from about 3% in Honduras to 33% in Panama.
Similarly, the geographic coverage of the survey will also have consequences on the estimations of inequality. Although rural areas are usually less unequal than urban areas, national inequality estimates yield higher concentrations than those based exclusively on urban data (Feres, 2000).
The size of the survey also has an effect on the estimations of inequality, since surveys with a smaller sample have a larger standard error, which is associated with greater variability in estimations of the Gini coefficient in Latin America (Székely & Hilgert, 1999). Sample size of the quality of life surveys in Latin America ranges from 330,000 observations in the Brazilian case to 11,905 in Argentina. In Chile, the CASEN 2006 survey has 268,873 observations.
3. Data and methods
This work combines an analysis of inequality in Chile during the 1987-2006 period, from the standpoint of income distribution, on the one hand, and of access to essential social services, on the other. The analysis of income distribution considers a variety of indicators such as the Atkinson index, the Generalized Entropy index, the Theil index, the Gini coefficient, and the 20/20, 10/10 and 10/40 ratios. Analysis of access to essential services is made based on an econometric model of predicted probability, combined for health care with a marginal probability analysis.
Both studies have been made with data from CASEN surveys. This is a nationally representative survey based on a probabilistic sample taken by the Department of Economics, Universidad de Chile, commissioned by the Ministry of Planning of Chile. CASEN has been processed at the Santiago headquarters of the Economic Commission for Latin America and the Caribbean (ECLAC). The purpose of the survey is to provide valid information for the analysis of the socioeconomic characteristics of the Chilean population and to monitor the implementation of social programs.
The above mentioned Chilean inequality indicators have been estimated in the conventional manner, excluding zero and "missing" values from the calculation, using autonomous per capita household income variables, total per capita household income, autonomous household income, and total household income. The Atkinson index has been estimated for inequality aversion parameter values («) of 0.5, 1 and 2. In the case of the Generalized Entropy index, this parameter has been estimated for the 0 value. The Theil index and the 20/20, 10/10 and 10/40 coefficients are included in the estimates. For the last three coefficients the estimates were made considering the sum of incomes from the reference group (and decile).
The income variables used to estimate the Chilean inequality indicators are defined below. Autonomous household income is the sum of the household incomes derived from ownership of productive factors, which include the exercise of an activity in the labor market, income gains resulting from asset ownership, and self-provision of goods produced at home; this does not include the subsidies paid by the State. Autonomous per capita household income is the amount of autonomous income which, on the average, corresponds to each household member. Total household income is the sum total of household income, including that derived from the exercise of an economic activity, the money subsidies delivered by the State, and an imputed rent. Total per capita household income is calculated by dividing total household income by the number of members of the household.
The analysis of access to essential services has been based on a multinomial logit model through which the probability of being poor has been estimated according to different levels of schooling and access to social security and health. The analysis is complemented by a probit-type model that allows the estimation of the marginal probability of a person receiving health care in case of illness or accident.
The general model that has been estimated is of the following type:

Where:
VDStat represents unordered dependent variables related to access to the coverage of the social security and health systems. The analysis of access to pension coverage includes categories referring to whether the person does not have a pension plan, whether it is covered by the public pension plan (INP), or whether it is covered by a private pension plan (AFP), with the people covered by a private pension plan (AFP) forming the comparison group. For the analysis of health care, the categories included refer to whether the person lacks health coverage, whether it is covered by the public health program (FONASA), or whether it is covered by a private health plan (ISAPRE), and the comparison group is that of people under a private health plan (ISAPRE).
The model's independent variables are dichotomous variables that have been built to represent characteristics of the population, according to the following explanation: P express the socioeconomic status (poor, almost-poor, and middle and high status) of the person i at time t, and CP identifies personal characteristics of person i at time t such as educational level, gender, age, residence in urban or rural areas, and marital status.
The unit of analysis is the person, and the multinomial logit and probit models have been estimated at that level.
For the analysis of the probability of being poor according to different years of schooling, a model similar to the above has been applied, with the variants included in equation 2 (E2).

Where:
PobStat is an unordered dependent variable that includes categories referring to whether the person is poor (incomeless than 2 basic food baskets9), almost-poor (income between 2 and 3 basic food baskets), or belongs to the middle-high status (income greater than 3 basic food baskets), the latter category forming the comparison group.
AE is a continuous variable representing schooling years gotten by the person i at time t.
CP is a set of dichotomous variables that identifies personal characteristics of person i at time t such as gender, age, residence in urban or rural areas, and marital status.
The same as in the cases included in equation 1, the unit of analysis is the individual and the multinomial logit model was estimated at that level. The regression results of multinomial logit models are presented in the following annexes.
4. Inequality in perspective
4.1. Evolution of inequality in Chile
The overall analysis for the Chilean case suggests that the decision about which indicator of inequality to use is not neutral with respect to the results of the analysis and the impression that is obtained about the evolution of the country's income distribution. So on the one hand the Gini coefficient shows stability of Chilean inequality, with a slight decrease between 2003 and 2006, while the Atkinson 1 and 2, the Theil, and the Generalized Entropy indices show greater variations in income distribution over the 1987-2006 period, and that the higher the inequality aversion parameter, the more visible are these variations. Figure 2 shows estimates of inequality based on autonomous and total income for the household and per capita.
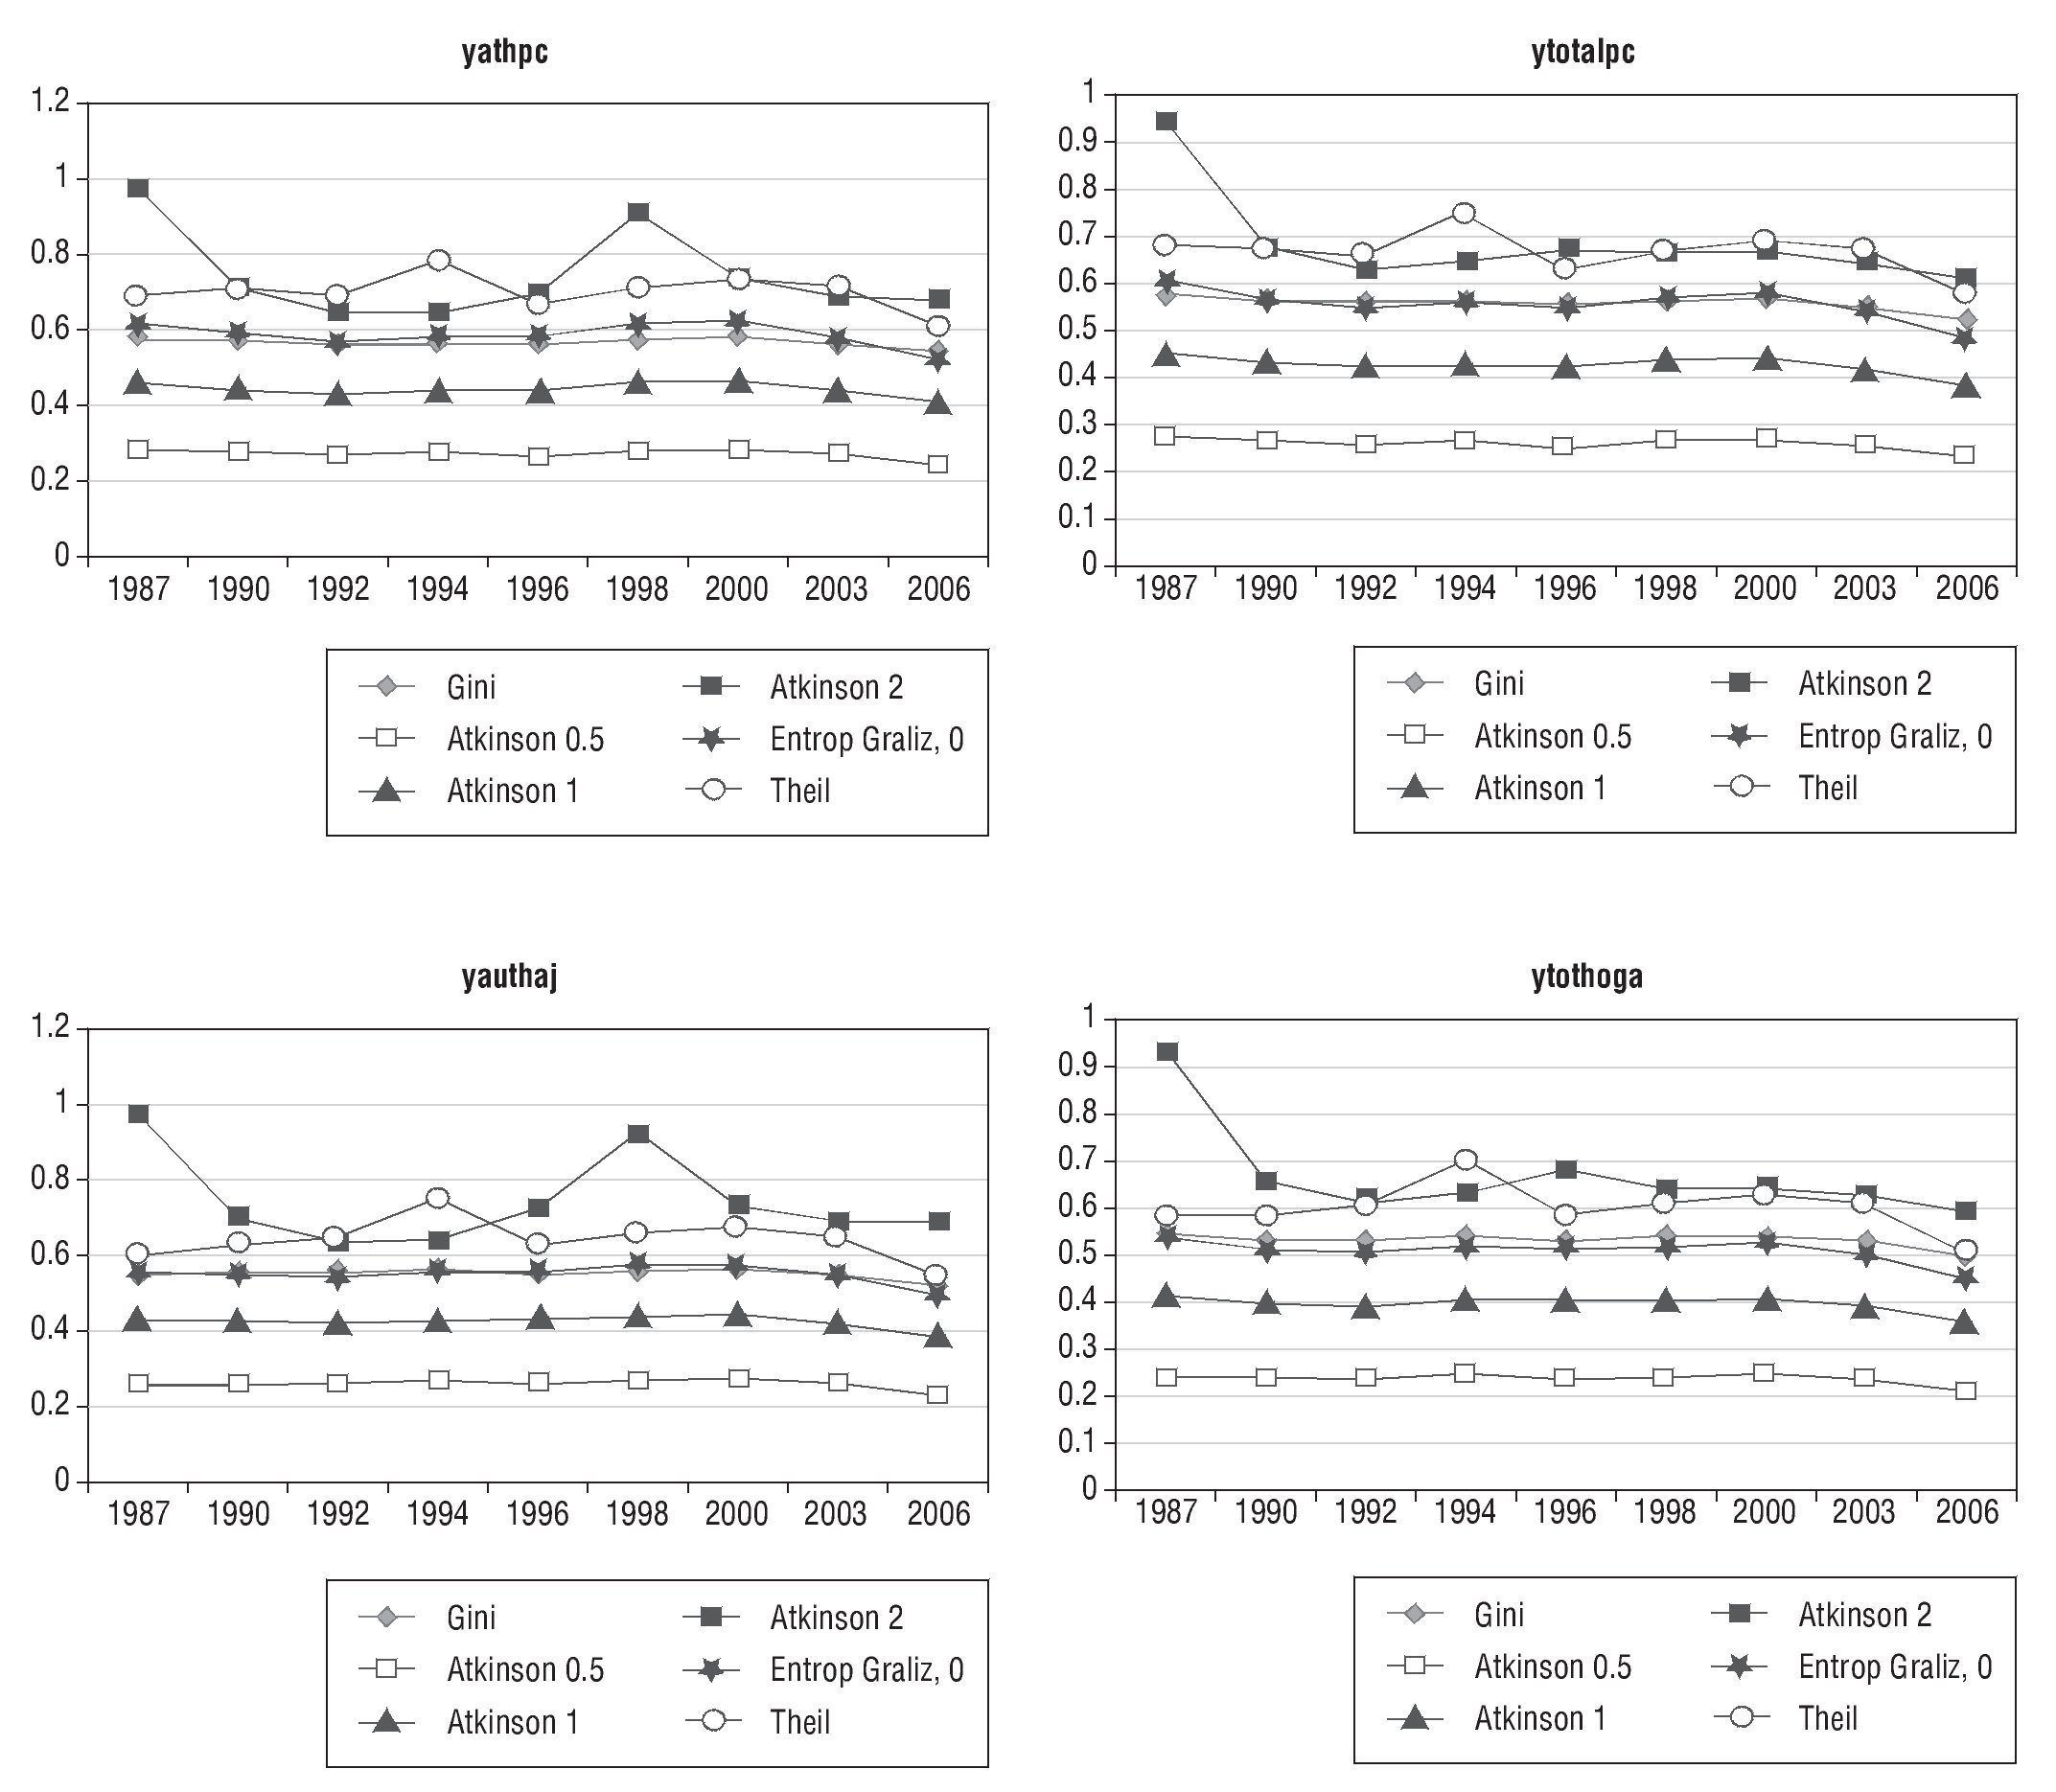
Figure 2 Inequality indices of various income measures, Chile 1987-2006. Source: Author's estimates based on CASEN data. Note: The meaning of the titles of each graphic are as follows: yathpc: household's autonomous income per capita; yauthaj: household's autonomous income; ytotalpc: household's total income per capita; ytothoga: household's total income.
The representation of the inequality variation in Figure 2 shows that for the four income variables used, the Gini coefficient expresses a situation close to stability in income inequality in Chile, while the other indicators show substantial variations and a marked reduction in inequality in the 1987-2006 period. The Gini coefficient indicates a behavior similar to the Atkinson index for ε = 0.5. Of the values commonly assigned to that parameter in estimating the Atkinson index, this is the closest to zero, which in turn reflects social indifference about inequality.
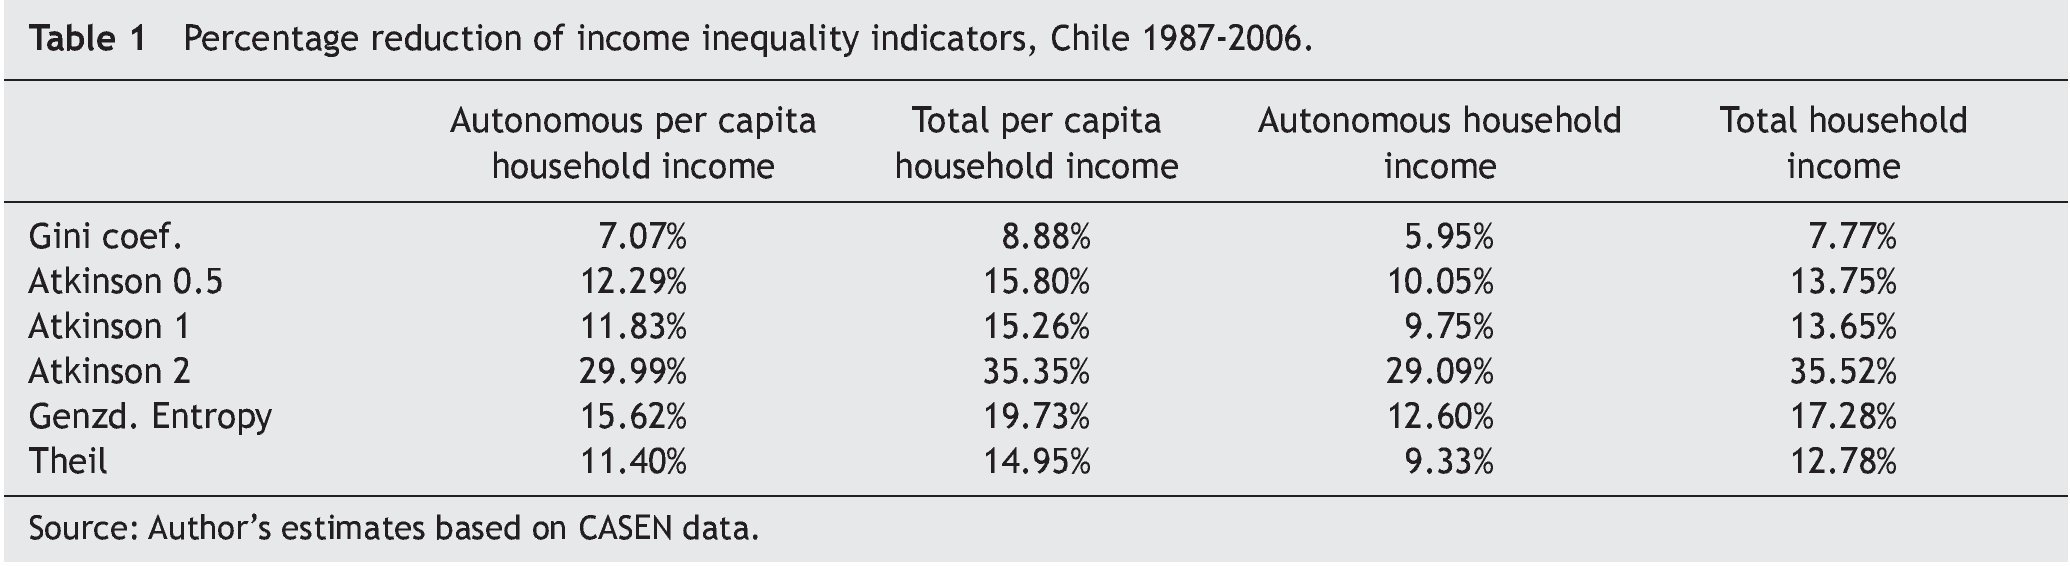
The percentage variation of the income inequality indicators for each of the income variables used are shown in Table 1. Although all the indicators showed a decrease of inequality, the Gini coefficient is the one that clearly shows a smaller variation over the 1987-2006 period. The inequality variation captured by the Gini coefficient is on the average 57% of that identified by the Atkinson index of 0.5, which is the closest to the situation of social indifference to inequality, and one fifth to one quarter of that captured by the Atkinson index 2, which gives more weight to transfers in favor of the poorest.

The estimates shown in this section are consistent with the criticisms of the Gini coefficient, in the sense that it is insensitive to changes in the extremes of the distribution. Also, in the case of the Atkinson index the estimations show that as the inequality aversion parameter (ε) increases, the reduction of income inequality in the review period would be greater. For example, consider an ε of 0.5 (close to a situation of social indifference to inequality) in 1987, the same utility level would have been achieved with 73% of that year's income if it had been equally distributed. In contrast, in 2006 the same utility level would have been achieved with 77% of that year's income if it had been equally distributed. If ε = 1 is considered, the equally distributed per capita autonomous household income in 1987 would have required 54% of that year's income, while in 2006 it would have required 60% of the income.
Thus, the analysis shows that using indicators that are more sensitive to changes in the extremes of the distribution, and particularly when working with those that incorporate a social welfare function aimed at identifying improvements in the situation of the poorest, such as the Atkinson index, the estimations show a greater reduction of inequality than that captured by the Gini coefficient.
On the other hand, the Atkinson index 2 based on autonomous income, both per capita and total (represented by the yathpc and yauthaj variables), shows an increase in income inequality by 1998, which is not collected by the estimates based on household and per capita total revenues (ytotalpc and ytothoga). As is known, independent income incorporates income from labor and lucrative activities, while total income also includes the money subsidies provided by the State. Accordingly, the increases in income inequality captured by the variables represented by autonomous income may be related to the Asian crisis that hit the country that year. Furthermore, total income did not get worse in terms of distribution because money subsidies grew strongly in 1998 and 2000 among the poorest percentiles, then decrease gradually by 2003 and 2006. This would indicate that the increase in money subsidies among the poorest would be the cause for the total income variables not to show increases in inequality.
The indicators that identify the number of times that the income of the richest exceeds that of the poorest, but are more focused on the extremes of the distribution, show high variations in inequality. The 10/40 index presents stability of inequality, while the 10/10 and 20/20 ratios show changes in the four income variables analyzed for the 1987-2006 period, particularly in total household income, with the 10/10 index showing the highest reduction percentages. This is consistent with what the Atkinson index captures, especially the ε values greater than 0.5. Figure 3 shows the evolution of these indices.
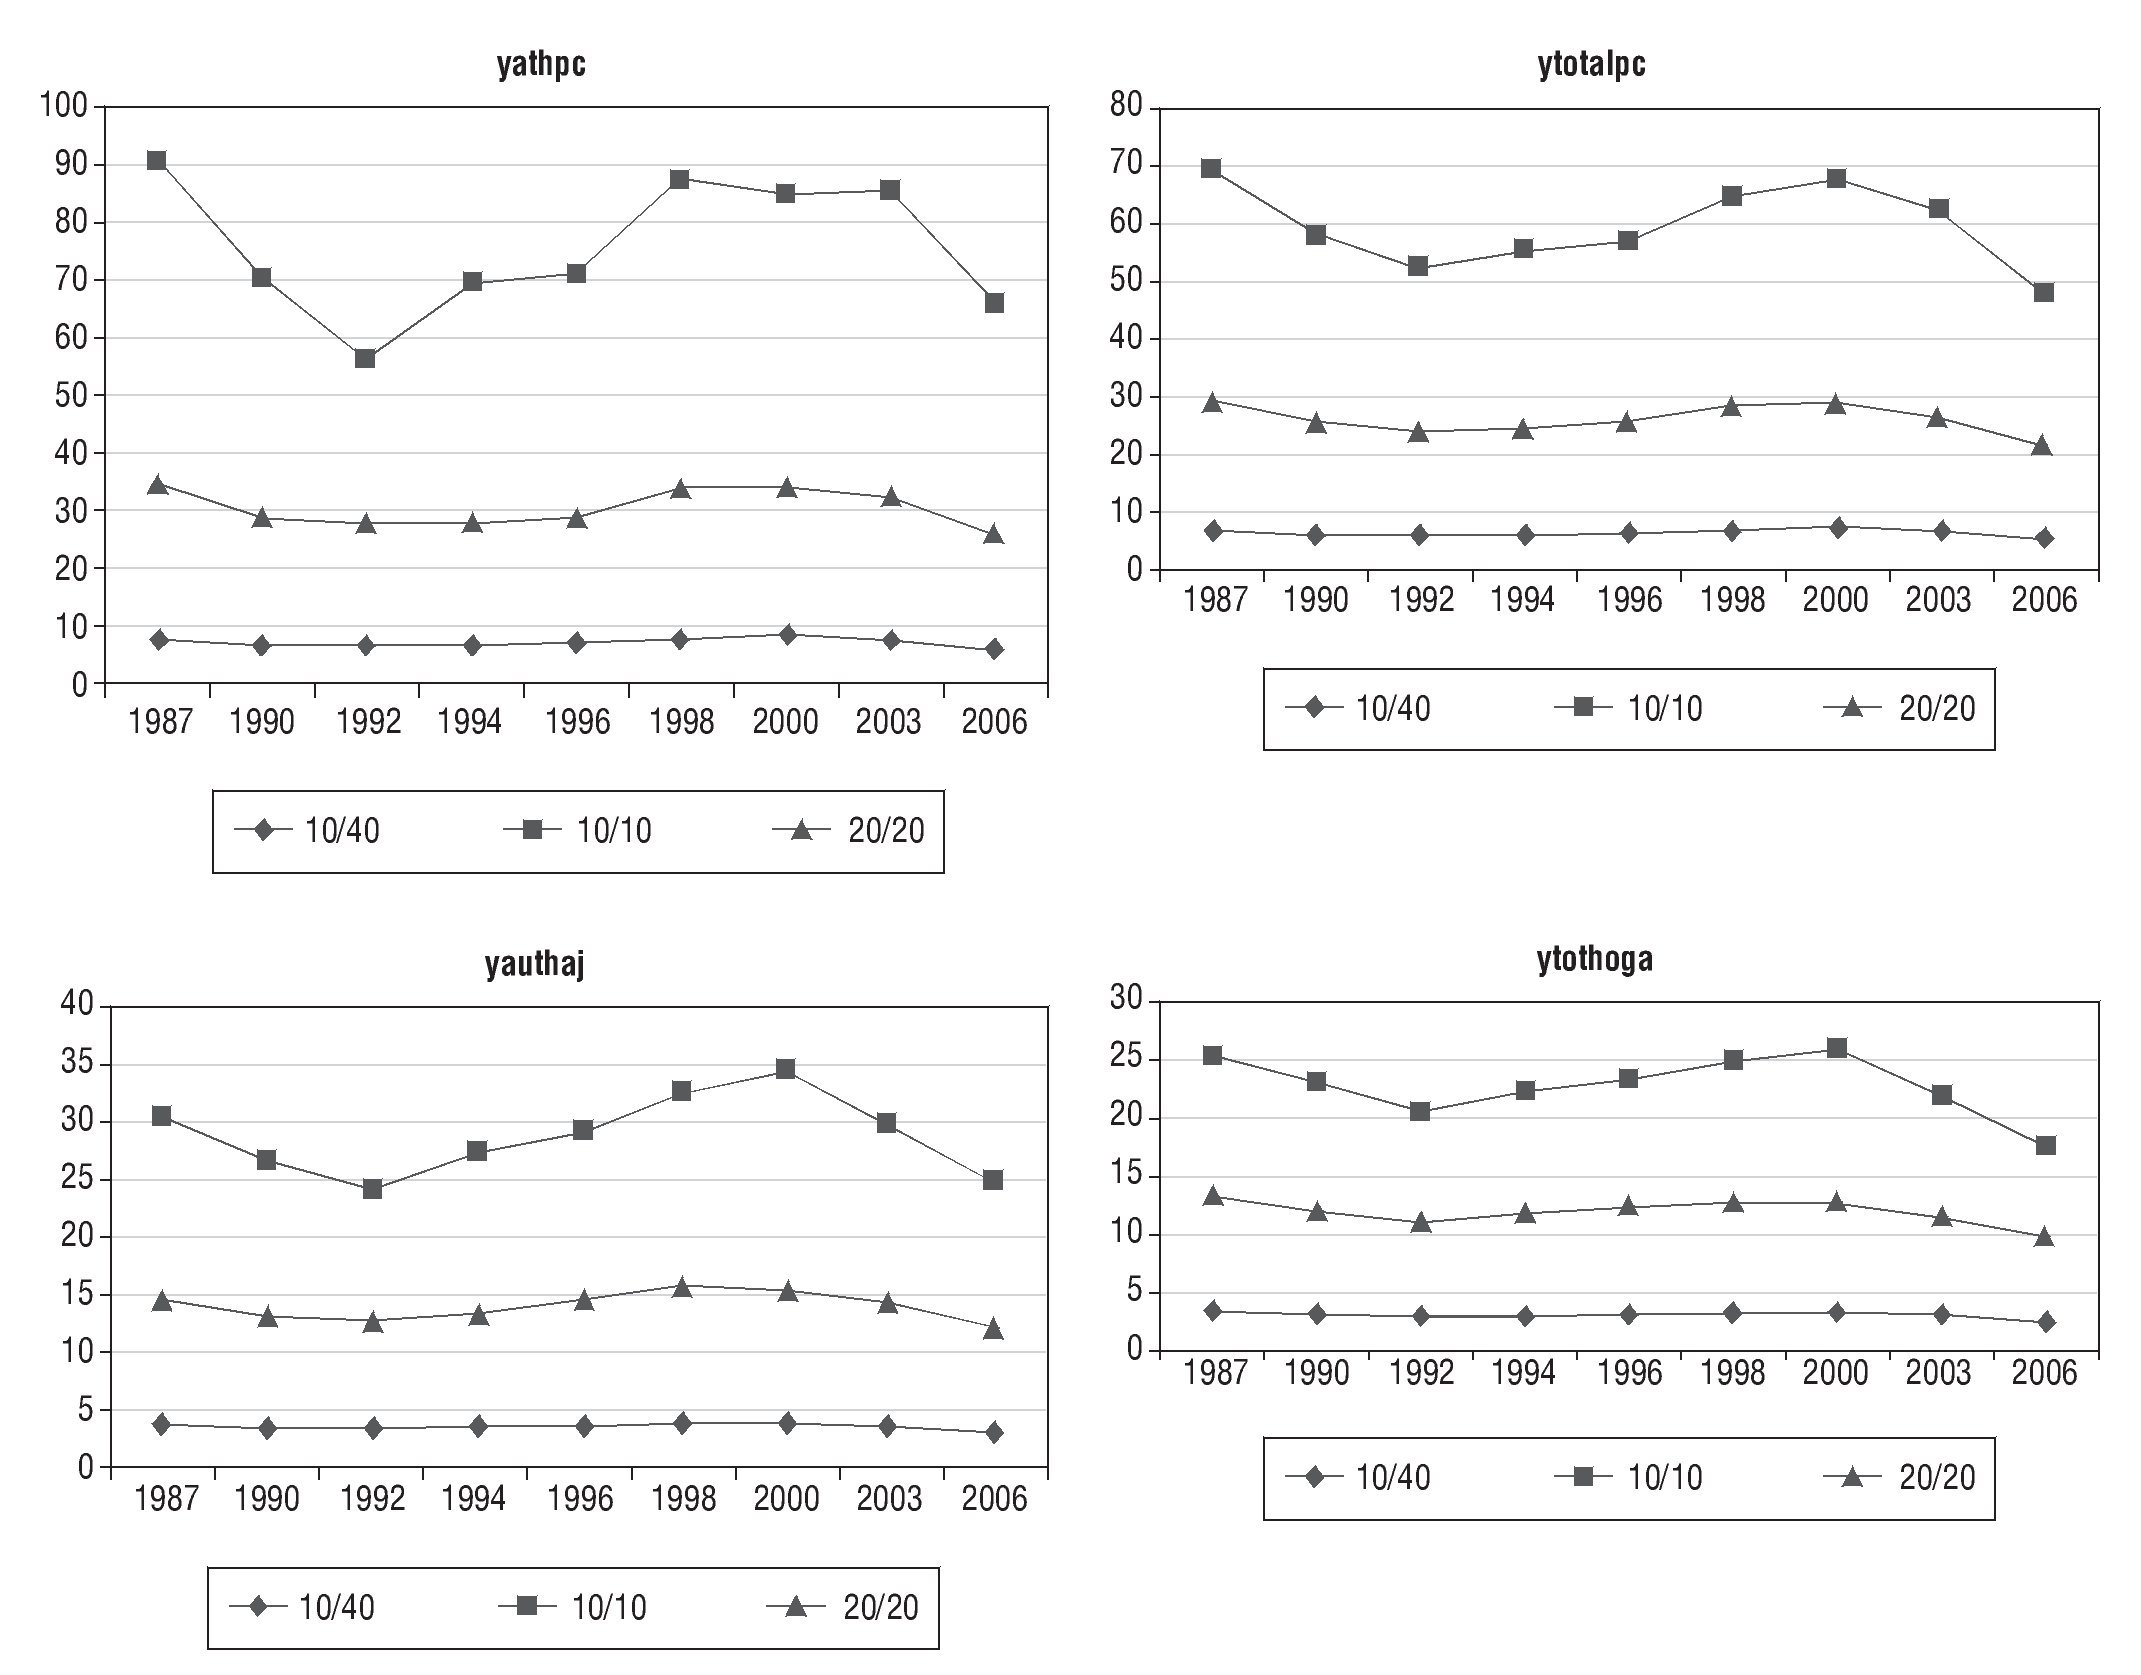
Figure 3 Income ratio between rich and poor with respect to several measures of income, Chile 1987-2006. Source: Author's estimates based on CASEN data. Note: The meaning of the titles of each graphic 2 are as follows: yathpc: household's autonomous income per capita; yauthaj: household's autonomous income; ytotalpc: household's total income per capita; ytothoga: household's total income.
What this section shows is that in the1987-2006 period the changes undergone by the lower end of the income distribution in Chile, where the poorest are located, would be greater than what has been captured by the Gini coefficient, the indicator used in virtually every analysis of inequality in Chile, and as a result improvements in inequality may have been underestimated.
5. Changes in access to welfare by the poor
This section is focused on identifying the changes in the welfare of the poor, for which the availability of durable goods as a proxy for access to welfare is analyzed. There are two considerations underlying this choice: first, to verify the ability of the poor to transform the income into consumption (following Duclos & Araar, 2006), and second, to verify access by the poorest to the enjoyment of goods associated with material well-being of the household and are available to the rest.
Figures 4 and 5 present the percentage changes in each decile over the 1998-2006 period, in the possession of durable goods. The period in question was considered because that is the longest interval for which the CASEN survey has records on durable goods.The durable goods whose possession was studied are the following: washing machine, refrigerator, water heater, video recorder (and DVD), microwave oven, landline telephone, mobile telephone, and vehicle, whether for work or for the family. The availability of these goods is associated with the facilitation of household work, improved communication and travel ability, leisure and recreation, that is,improvements in the quality of life and in household welfare.
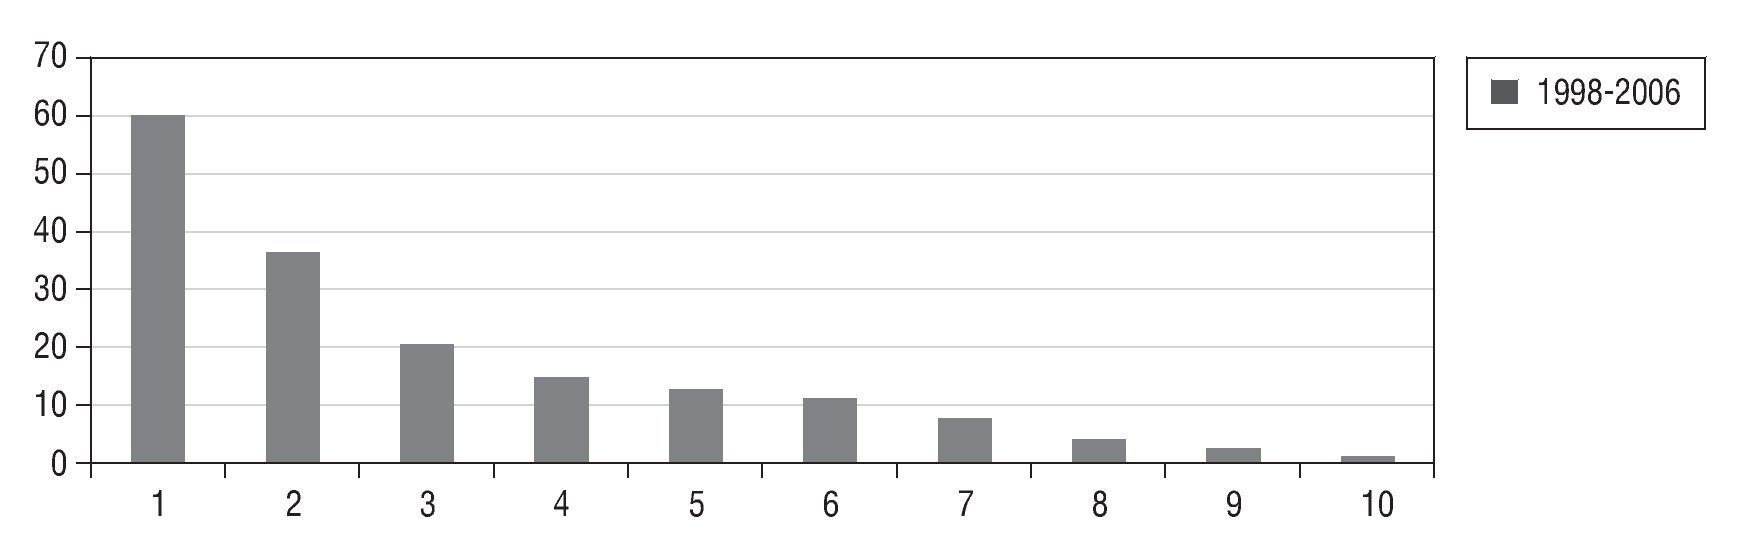
Figure 4 Deciles variation in the availability of at least one durable good at home, Chile 1998-2006. Source: Author's estimates based on CASEN data.
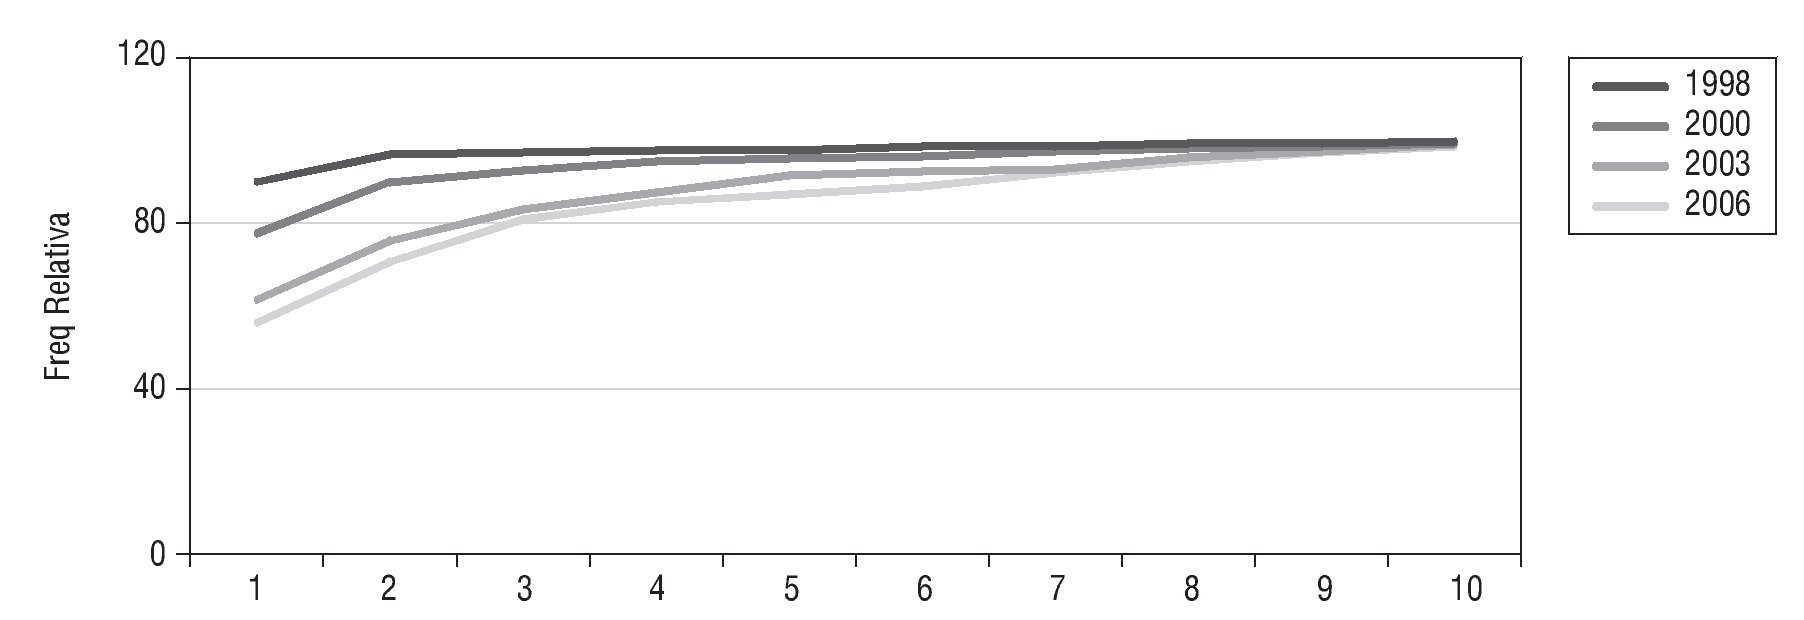
Figure 5 At least one durable good at home, Chile 1998-2006. Source: Author's estimates based on CASEN data.
Figures 4 to 7 show that the poorest deciles are those that show a higher percentage increase in the possession of durable goods. This does not mean that these deciles have a higher purchasing rate of those goods than the richest deciles, which, on the other hand, already had them in 1998, but that in the period under review they have incorporated into their homes, to a greater extent, durable goods that they did not own previously.
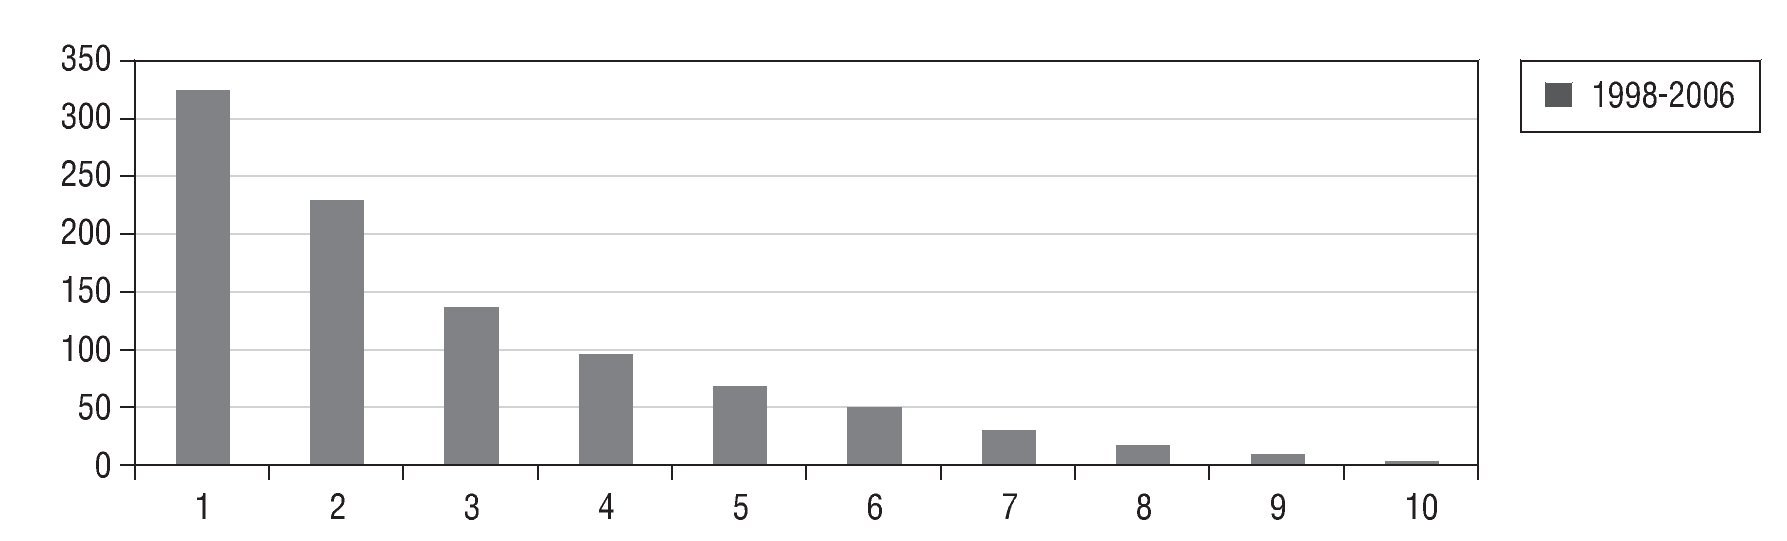
Figure 6 Deciles variation in the availability of at least three durable household goods, Chile 1998-2006. Source: Author's estimates based on CASEN data.
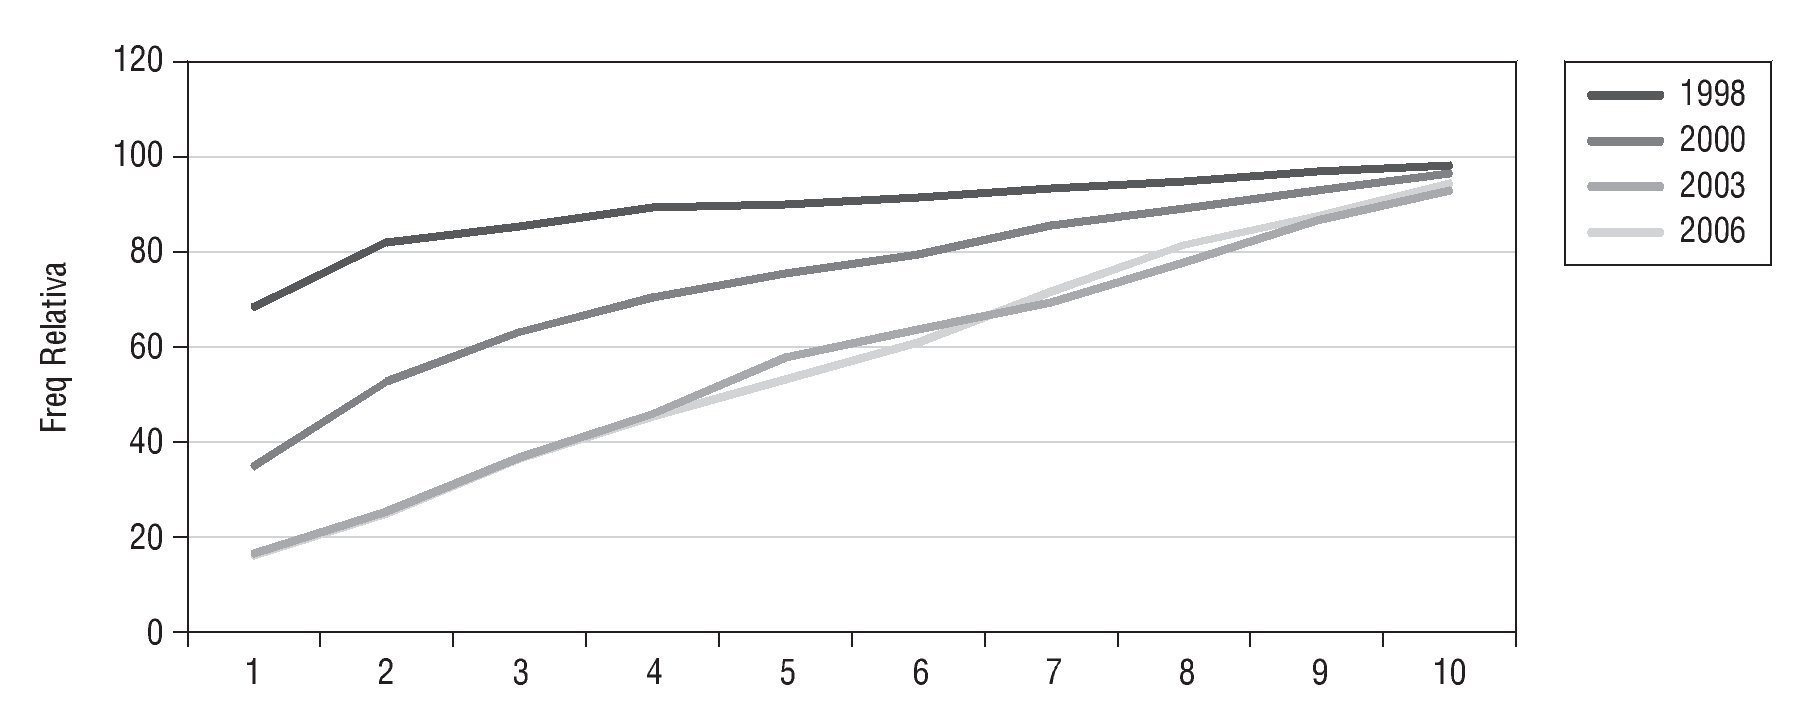
Figure 7 At least three durable goods at home, Chile 1998-2006. Source: Author's estimates based on CASEN data.
According to Figure 5, the poorest decile increases their possession of at least one durable good from 55.83% to 89.74% of the households, while that increase in the richest decile was from 98.26% to 99.67%.
Figure 7 shows that increase in ownership of at least three durable goods increases from 16.19% to 68.68% of the household of the poorest decile, while in the richest increases from 94.66% to 98.13%. Two main facts have led to these results: on the one hand, the greater supply of these durable goods has produced a decrease in their prices and, on the other hand, increases in real salaries of the poorest. According to National Institute of Statistics, salaries of non qualified workers increased 39% from December 1998 to December 2006 (months when CASEN Survey was taken), while Consumer Price Index increased 24% in the same period (INE, 2011).
Taken together, Figures 4 to 7 show that the lowest income deciles have managed to acquire durable goods and therefore have access to the enjoyment of goods not previously available to them. This also implies that they must have had sufficient income to at least purchase the durable goods mentioned above, presumably on credit. This means that their welfare has improved. That makes what Figures 4 to 7 show more consistent with the changes in income inequality shown by the estimates based on the Atkinson index than with those shown by the Gini coefficient.
6. Access to social services
From the standpoint of the multidimensional view of poverty and inequality, the questions on the social and/or institutional arrangements that do or do not allow access to social services is equally important or even more so than the questions on income distribution. This is so simply because access to social services is a determining factor in the capability developed by individuals, the freedom that they can exercise, and finally the possibility of living the life that everyone has a reason to value.Undoubtedly, the availability of income generates opportunities for access to basic social services for our society, but so do the institutional arrangements that provide access to services that are determining of the possiblities of obtaining income or compensating for their lack.
Thus, from the standpoint of the analysis attempted in this paper, a relevant dimension is to ask about inequalities or inequities in the access to social services that affect the opportunities to choose the kind of life that everyone has a reason to value. The social services whose access is discussed are education, health and social security. The former refers clearly to public policies to expand capabilities, the latter to social protection mechanisms against the contingencies of life, while health reflects the result of public policies or institutional arrangements in both areas (capacities and protection).
Access to educational services has been a priority in the efforts of the State of Chile since the early days of the Republic, allowing full coverage to become a goal achieved by the mid-2000s (Olavarria, 2005) (see Table 2). Since the 1990s the debate has focused on the quality of education, an issue strongly influenced by the modest results obtained by Chilean students in the TIMSS10 and PISA11 international studies. This has led to new State interventions, first with the Educational Reformation launched in the second half of the 1990s and then with the establishment, in 2006, of a Presidential Commission that examined the issue and submitted its proposal in 2008. But can Chile aspire to equitable access to quality education without having achieved the goal of coverage? Based on the efforts and achievements of the long Chilean social policies tradition,12 these lines suggest an answer that values the coverage goal. In any case, this is certainly a hypothetical answer that future research may confirm or reject.

The data in Table 2 show the progression of the coverage and its effect on increasing schooling years of Chileans. In turn, the data in Table 3 show the effect of schooling years that a person reaches in its likelihood of being poor, thereby highlighting the positive effect of expanding the coverage of education on reducing poverty.13 Also, to complete the picture, Table 4 shows the evolution of inequality/inequity in access to educational services.
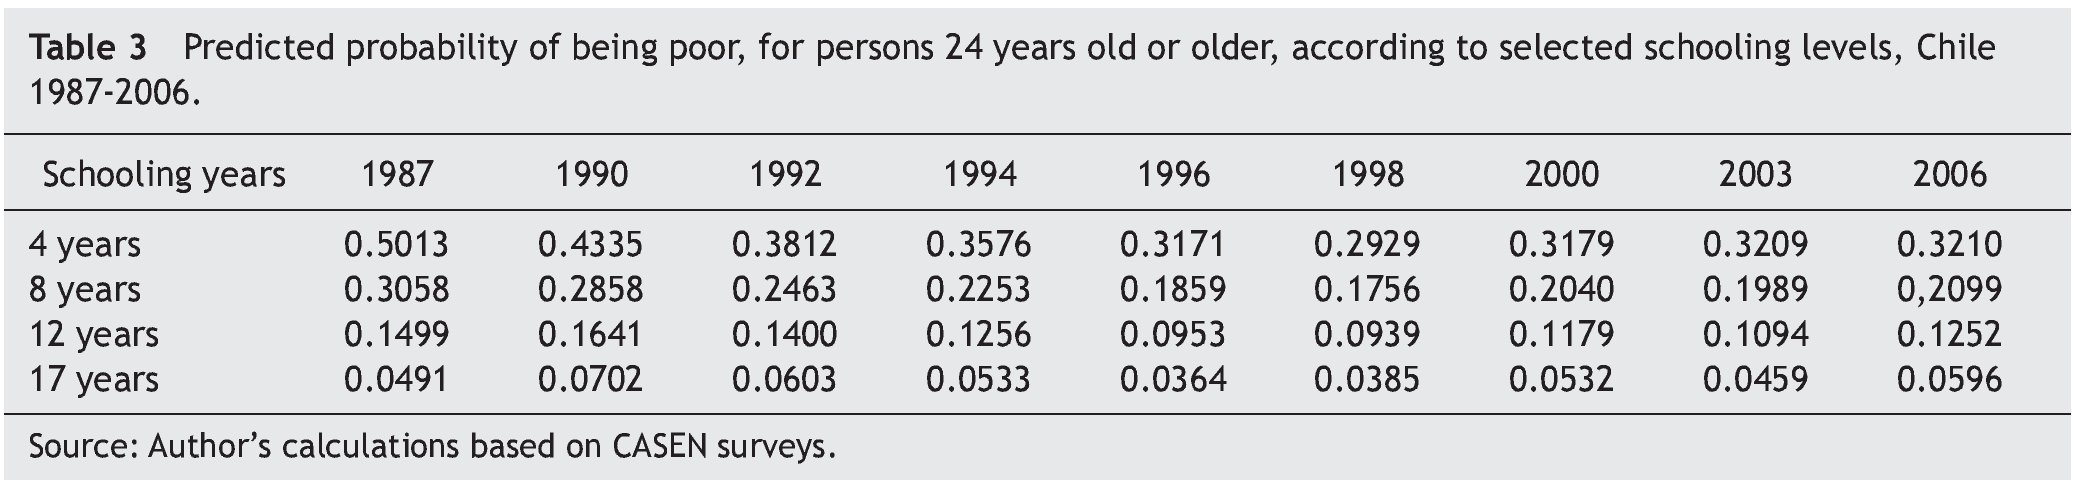
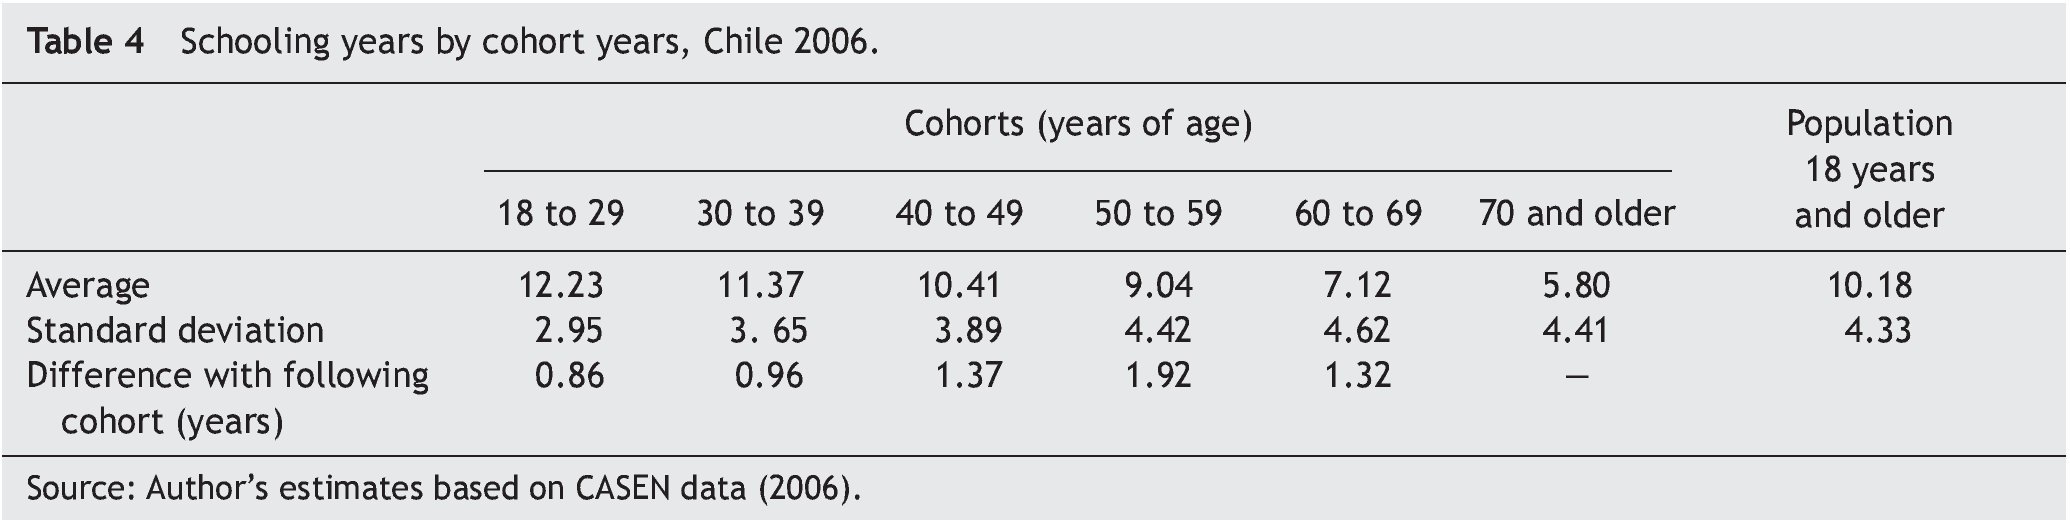
Table 4 presents three transcendent issues. First, the growth of schooling, which in turn shows the effects of the country's capability expansion process; the young have 2.11 times the schooling of the elders. Second, there has been increasing equity in access to education in Chile. Not only the standard deviation of the years of schooling is greatly reduced towards the younger ages, but while it is one fourth of the average for the youngest cohort, in the oldest cohort it represents 76%. Third, Table 4 also shows the long-term impact of the educational reformation of 1965, whose aim was to expand the coverage and improve the schooling of the population. The largest increase in schooling is seen among those aged 40 and 50 in the mid-2000s, who were in or were becoming part of the educational system in the second half of the 1960s.
In retrospect, the 1965 reformation not only expanded educational coverage and increased schooling, but according to the data in Table 4, it unleashed an increasingly egalitarian process of access to education and allowed that coverage to be an accomplished goal by the 2000s. The current situation of Chilean education seems to require a reformation as successful as that, but this time aimed at increasing the quality standards. Social security coverage data reveal an opposite reality. Table 5 shows the low access of the poor and almost-poor have to public or private social security.
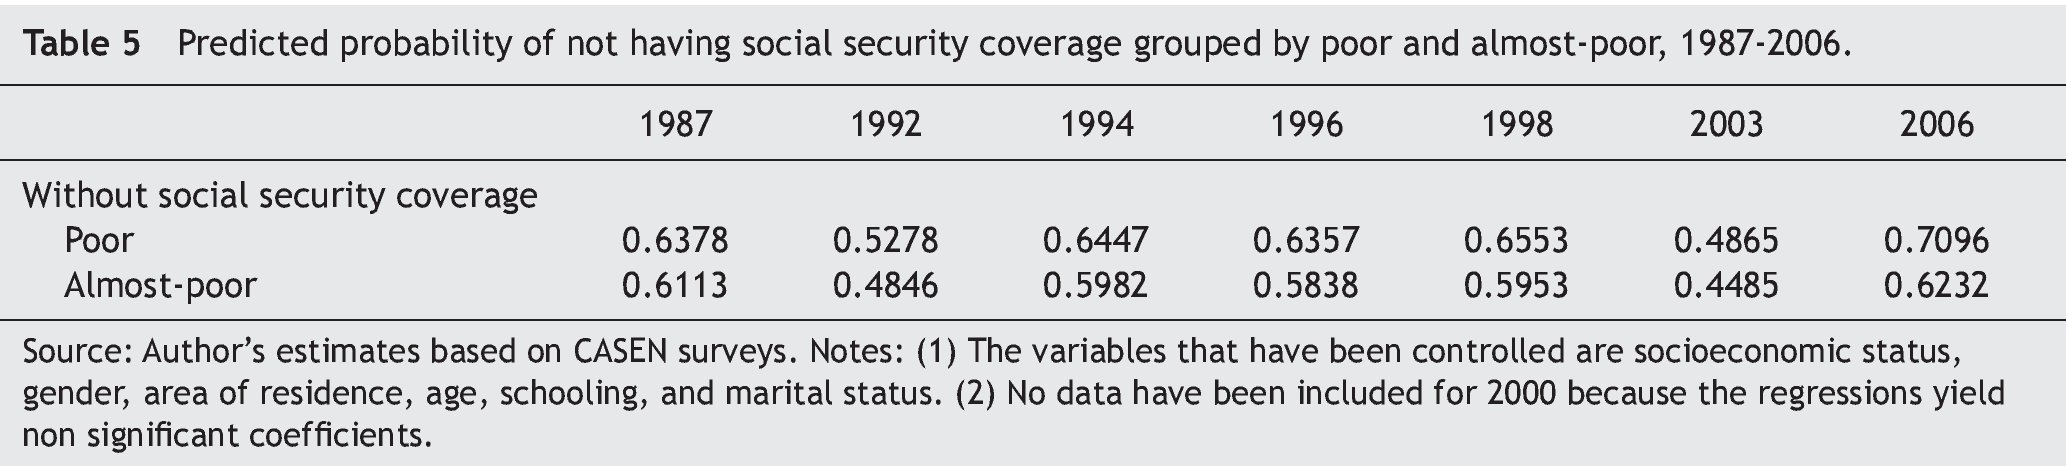
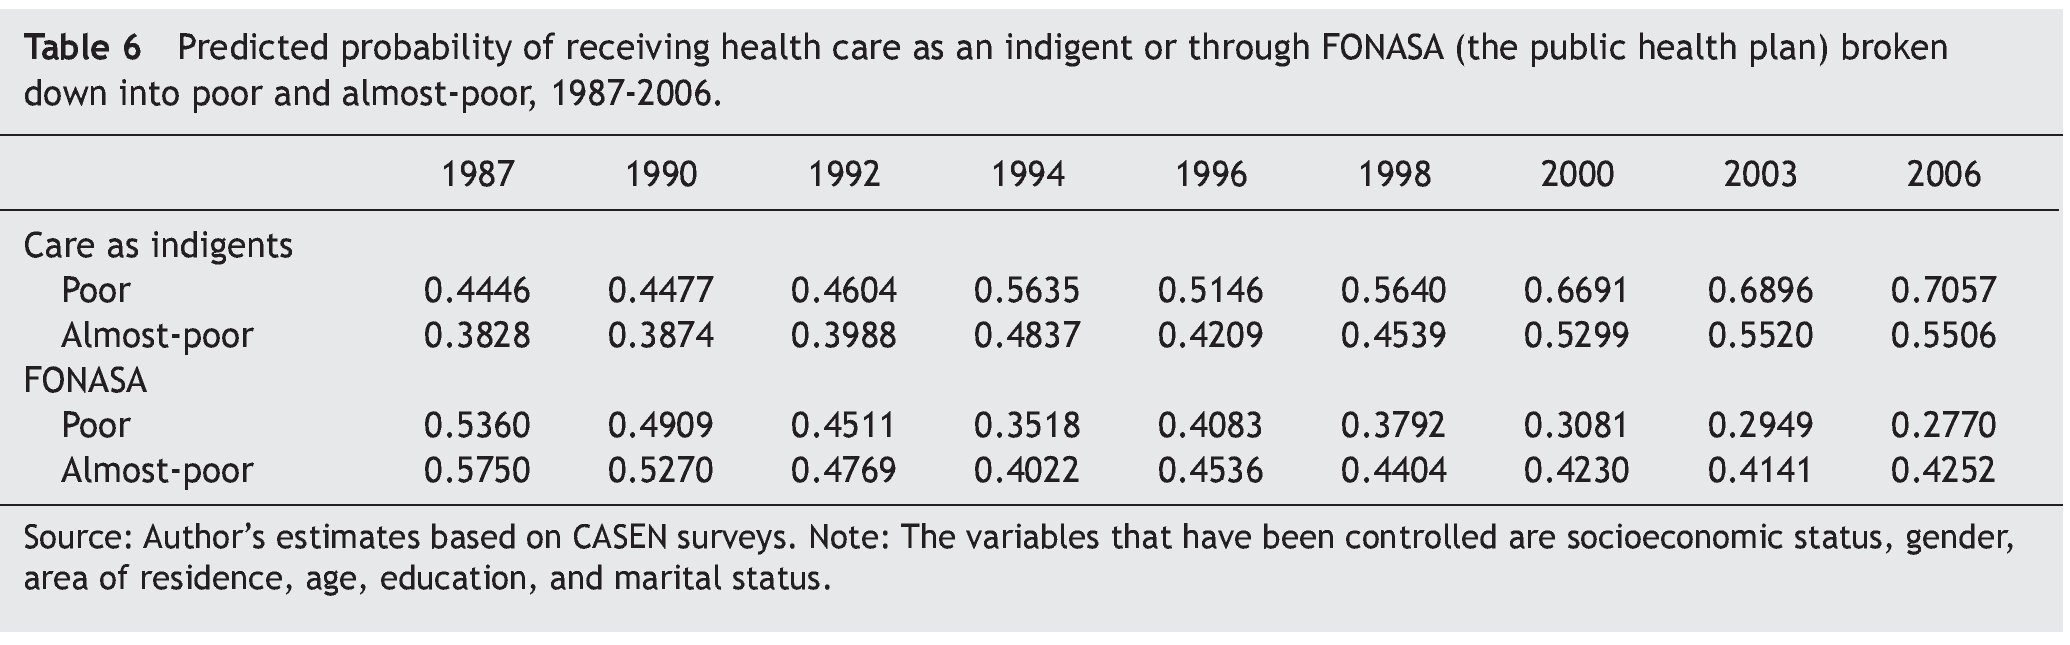
The data in Table 5 indicate that the poor and almost-poor have a low probability of access to the protection of the social security system, either through the Instituto de Normalización Previsional (INP, the public system) or an Administradora de Fondos de Pensiones (AFP, the private system). Since access to the pension system in Chile is linked to the formal labor market and the working poor and almost-poor are recurrently self- or informally employed, the low degree of access to social security protection for the poor and almost-poor may be a consequence of this situation (Olavarria, 2005). This precarious situation also extends to the field of health protection, as shown in Table 6.

The data in Table 6 show that in spite of the reduction of poverty in the years of the series, from 45.1% in 1987 to 13.7% in 2006, the poor and almost-poor choose to seek medical care as indigents, even though they may have coverage by FONASA or some ISAPRE.14 Care through FONASA decreased along the series (the ISAPREs are the basis of comparison) and care as indigents increased. Likewise, marginal probability analysis shows that this segment of the population has serious difficulties in receiving medical attention when needed. This determines a pattern of serious problems of access to both health protection as well as to care itself for diseases or accidents.
Seen in perspective, access to the basic social services that expand capabilities and enable freedom is uneven. The data indicate that while there has been increasingly egalitarian access to education, without this implying to ignore the problem of quality, the poor and almost-poor are faced with serious problems of access to the mechanisms of health and social security protection. In view of the role played by the state as regulator of the social security system and leading provider of health care, the data show that we are probably facing a failure of the State, expressed in an inadequate provision of basic social services as a functional equivalent to the inadequate provision of public goods to which welfare economics refers in the analysis of market failures. This makes the poor and almost-poor face severe restrictions to access essential social services, preventing them to "opt for the kind of life that everyone has a reason to value."
7. Discussion and conclusions
In retrospect, this article provides two major topics for discussion: the problems of validity of the conclusions of the studies on inequality that concentrate exclusively on the Gini coefficient, and the inequity of access to the essential social services.
In the case of estimates of inequality in Chile, the analysis suggests that changes in Chilean income inequality would be quite higher than those normally reported from research, and the almost exclusive use of the Gini coefficient for the estimates would have shown a picture of stability of inequality in the country. The analysis of indicators based on social welfare functions, mainly the Atkinson index, as well as the Theil index and the Generalized Entropy, suggests that in the 1987-2006 period there were variations within the series and that the reduction of inequality would be greater than that captured by the Gini coefficient. The reason for this would be the insensitivity of the Gini coefficient to capture the changes that occur at the ends of the income distribution.
Also, the indicators that pay more attention to what happens at the ends of the distribution, like the Atkinson index, which expresses greater inequality aversion (ε = 2), and the 10/10 index, coupled with the noticeable increase in the possession of durable goods in the first deciles shown by the analysis, describe a picture of improvement in the inequality and welfare of the poorest that differs from the image of stability of a high inequality situation presented by the Gini coefficient.
Although it has not been a central theme of the article, comparison of the inequality indicators and data on access by the poor to durable goods suggests that there may be an underestimation of the income reported by the surveys, on which some inquiries should be made. It is probable that the reported access to durable goods is mainly accounted for by access to private credit (banks, stores and the like). But on the one hand this is also income that, while in the future, should be available for purchasing, and on the other hand it represents the dynamics of the market expanding into sectors to which it had not previously arrived. In both cases the result is an improvement in the welfare of the dispossessed.
Thus, the combination of indices such as Atkinson, Generalized Entropy, Theil, 10/10, and the data on access to durable goods by the poor suggests that the exclusive use of the Gini coefficient to estimate the levels of inequality in Chile may have led to underestimate both the changes that took place in the analyzed period, as well as the improvements in the welfare of the poorest segment.
From this follows the need to estimate the inequality of income or consumption by a set of indicators and not focus on only one, like the Gini coefficient, as this generates partial and probably biased images of the reality that is being studied.
Furthermore, the data presented above show dissimilar evolution in access to the three social services analyzed. Meanwhile, access to education has had increasing equity, achieving full coverage, and thus has made it possible to bring up the goal of quality education for all. In the field of coverage of social security and health protection, the lacks are centered on the poor and almost-poor.
Since its inauguration in mid 1920, the coverage of the Chilean pension system has expanded noticeably, ranking among the highest in Latin America (Olavarria, 2005). Even so, and after eight decades, neither under the pay-as-you-go system nor under that of individual capitalization have the poor and almost-poor reached institutionalized protection for the most difficult moments of life. Since the social security protection is accessed mainly through a formal employment contract and the poor and almost-poor are typically self-employed or informal, the probability of access to the protection of the social security system is low.
Also, although formally the entire population has access to health care, since it has been raised to a constitutional right, in actual fact the poor and almost-poor meet greater access barriers, an issue that is evidenced by the difficulties of access to social security protection shown in Tables 5 and 6, and the lower probability of having access to health care when needed.
Reforms have been established to address the problems of access to social security and health protection. Law 20,255, of March 2008, amended the pension system and thus provided a basic solidarity pension for those who do not have social security contributions, incorporated the self-employed, and provided benefits to the middle-income sectors and to women. Also, law 19,966, of September 2004, establishes a system of guarantees for access to health care, which has since been increasing the number and types of guaranteed benefits. While the texts of both laws address issues of access to social security and health protection, identified in this study, the impact achieved in terms of correcting them will be a question that can only be observed in the long term.
This work suggests that a comprehensive analysis of the phenomenon of inequality leads to the need to avoid focusing exclusively on monetary dimensions of income or consumption, and to the difficult and complex task of generating a set of indicators that will allow effective follow-up, over time, of the access of different segments, particularly the poor, to the social services that are the basis for the creation of welfare opportunities. Although there may be several possibilities, this paper has chosen to present the evolution of the predicted probabilities of the poor and almost-poor to access essential social services. It has shown that the probability of access to social security protection has not improved, that the public and private plans provide precarious health protection to the poor and almost-poor, who prefer to seek care as indigents, when they can, because it is less likely for them to get health care when needed. On the contrary, the indicators of income inequality show varying degrees of improvement. That is, while income inequality shows, according to the indicator, different degrees of reduction, inequity in access to social security protection shows stagnation at the expense of the poor.
Seen in perspective, the paper suggests that the analysis of inequality requires, on the one hand, avoiding focusing exclusively on income, and on the other hand it needs to broaden the range of indicators used for the income distribution analysis, in view of the problems of the Gini coefficient to capture the changes in the welfare of the poor. The article also reveals a paradox by suggesting that there may have been improvement in income distribution and welfare of the poorest in the period under review, but this does not occur in their access to social security protection and health. This is a fundamental dimension of inequality —which the studies have rarely addressed, giving priority to the analysis of income distribution— because access to these basic social services, along with education, are essential to achieve the basic freedom that allows each one to "choose the kind of life that everyone has reasons to value."
Acknowledgements
The work has benefited from the very good contribution of the research assistants Javier Pino Alarcón and Juan Pablo Araya Orrego. I appreciate the comments made by Xavier Mancero on a preliminary version of this article. Any remaining errors are the sole responsibility of the author.
1. A recent research by Wilkinson & Picket (2010) showed that more unequal societies get much worse outcomes than more egalitarian societies in health and social aspects such as people health status, life expectancy, teenage pregnancy, use of illegal drugs, interpersonal violence, mental illness, school performance and so on.
2. An extensive presentation on various inequality and inequity indicators can be found in Duclos & Araar (2006), ECLAC (2000), Mancero (2000). Also, a presentation on the conceptual foundations of the measures of poverty and inequality can be found in Grusky & Kanbur (2006).
3. The Dalton Index is a type on normative measure of inequality. According to Dalton the inequality on any distribution may be presented as follows:
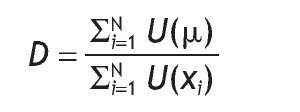
In this expression if Dalton Index is equal to unity the distribution would be equal and if it is greater than the unity the distribution would be unequal (Chaubey, 2004).
4. The Theil Index —named for Dutch econometrician Henry Theil (1924-2000)— belongs to the family of Generealized Entropy inequality measures. When the parameter a of the Generalized Entropy Index is equal to zero it turn into the Theil Index, meaning that it is equally sensitive to changes across the income distribution (World Bank, 2011).
5. The Generalized Entropy Index is an inequality measure that includes a parameter (a) representing the weight given to distances between income at different parts of the distribution. Its general formula is as follows:
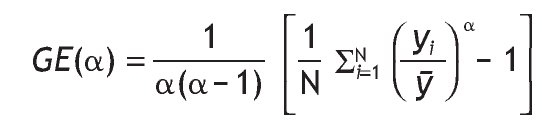
Where a can take any real value. "For lower values of a, GE is more sensitive to changes in the lower tail of the distribution, and for higher values GE is more sensitive to changes that affect the upper tail" (Haughton & Kandker, 2009, p. 106-107).
6. The 20/20 index shows the number of times that the income of the poorest quintile (20%) fits in the richest quintile of the population. Similarly, the 10/10 index shows the ratio between the income of the poorest decile (10%) and that of the richest. The 10/40 index shows the number of times the income of the four poorest deciles of the population fits in the income of the richest decile.
7. Atkinson (1970) states that it is reasonable to argue that as the general income level increases, so does the concern of society for inequality, so a social welfare finction must show increasing relative aversion to inequality.
8. On this point Feres (2000) contributes important evidence by showing that consumption distribution is significantly less concentrated than that of income, regardless of the household classification criterion, and that in the distribution of income there is unsaving in the bottom groups and positive savings as one goes to groups with higher income levels.
9. The basic food basket is a measure that identifi es the minimum income required by a person to satisfy its food needs. It is built considering the minimum required consumption of proteins and calories according to the standards of the World Health Organization, the consumption habits of the population, and market prices.
10. In 2003 TIMSS (Trends in Mathematics and Science Study) found that 8th grade Chilean students placed 39th out of 45 countries, with 387 points on the Math test, whose average was 466 points and whose highest score was 605 (obtained by Singapore). In the Science test 8th grade Chilean students ranked 37th out of 45 countries, with 413 points, while the average was 473 points, and the highest score again belonged to Singapore, with 578 points (see NCES, 2004).
11. The PISA (Programme for International Student Assessment) 2006 showed that in Science 69.7% of the students achieved level two or lower, with scores up to 484.14 points, 20.1% reached level 3 (intermediate), between 484.14 and 558.73, 1.8% achieved level 5, and only 0.1% were in level 6, the highest, with scores above 707.93 points. In reading, 85.4% of the students placed in level 3 or lower and 14.5% in levels 4 and 5 (upper). In the case of Mathematics, 92.9% placed in level 3 or lower, and 6.91% were in levels 4, 5 and 6 (upper) (see OECD, 2007).
12. A detailed argument about the long Chilean tradition of social policy can be found in Olavarria (2005).
13. This statement does not imply ignoring the effect of economic growth on poverty reduction. An analysis that includes the combined effect of economic growth and social policies in reducing poverty can be found in Olavarria (2005).
14. A case of poor and almost-poor formal workers that have access to social security, pensions, and health protection is that of public employees in the lowest salary scale of the public sector.
Received 12 October 2011; accepted 26 March 2012
E-mail address:
mauricio.olavarria@usach.cl (M. Olavarría-Gambi).
References
Ahumada, J. (1958). En vez de la miseria. Editorial del Pacífico, Santiago, Chile.
Atria, R. (2008). Estado bienestar en Chile, Presentation in II Escuela Chile-Francia, Universidad de Chile, april 21 to 25, 2008, Santiago, Chile.
Aylwin, M., Bascuñan, C., Correa, S., Gazmuri, C, Serrano, & Table, M. (1990). Chile en el Siglo XX. Planeta, Santiago, Chile.
Atkinson, A. (1970). On the measurement of inequality. Journal of Economic Theory,2.
Beyer, H. (1997). Distribución del ingreso: antecedentes para la discusión. Revista Estudios Públicos, núm. 65. CEP, Santiago, Chile.
Boltvinik, J. (1990). Pobreza y necesidades básicas. Concepto y métodos de medición. PNUD, Caracas, Venezuela.
Bourguignon, F. (2006). From income to endowments: The difficult task of expanding the income poverty paradigm. In Grusky, D., & Kanbur, R. (Eds.), Poverty and inequality. Stanford University Press, California.
Bravo, D., Contreras, D., & Urzúa, S. (2002). Poverty and inequality in Chile 1990-1998: Learning from microeconomic simulations. Documento de Trabajo, N°196, Departamento de Economía, Universidad de Chile.
CEPAL, División de Estadísticas y Proyecciones Económicas (2006). Consideraciones sobre el índice de Gini para medir concentración del ingreso. 6.º Taller Regional MECOVI, del 15 al 17 de noviembre 2000, Buenos Aires, Argentina.
Chaubey, P. K. (2004). Inequality: Issues and indices. Kanishka Publishers, New Delhi, India.
Chumacero, R., & Paredes, R. (2002). Characterizing income distribution: Policy implications for poverty and inequality. Documento de Trabajo, núm. 187, Departamento de Economía, Universidad de Chile.
Creedy, J. (1998). The dynamics of inequality and poverty: Comparing income distributions. Edward Elgar, UK.
Deaton, A., & Zaidi, S. (1999). Guidelines for constructing consumption aggregates for welfare analysis. Draft. The World Bank, Washington DC.
Duclos, J. Y., & Araar, A. (2006). Poverty and equity: Measurement, policy, and estimation with DAD. Springer, International Development Research Centre, New York.
Feres, J. C. (2004). Confi abilidad de la medición del ingreso en las encuestas de hogares. 14.º Taller Regional MECOVI, del 17 al 19 de noviembre de 2004, Buenos Aires, Argentina.
Feres, J. C. (2000). Evidencia empírica de la desigualdad: algunas advertencias metodológicas. 6.º Taller Regional MECOVI; Buenos Aires, Argentina, del 15 al 17 de noviembre de 2000.
Giovagnoli, P., Pizzolitto, G., & Trias, J. (2005). Chile. Document part of the project Monitoring the socio-economic conditions in Argentina, Chile, Paraguay and Uruguay, The World Bank — CEDLAS.
Grusky, D., & Ravi, K. (2006). Introduction: The conceptual foundations of poverty and inequality measurements. In Grusky, D., & Ravi, K. (Eds.), Poverty and Inequality. Stanford University Press, California.
Haughton, J., & Khandker, S. (2009). Handbook on poverty and inequality. The World Bank, Washington DC.
INE (National Institute of Statistics) (2001). Índice nominal de costo de mano de obra por hora y grupos ocupacionales, trabajadores no calificados e Índice de Precios al Consumidor (IPC), Marzo 1928-Diciembre 2009, Serie Histórica Empalmada (Índices). Available from: www.ine.cl [accessed 2011 Feb].
Lane, R. (1996). What rational choice explain. In Friedman, J. (Ed.), The rational choice controversy. Yale University Press, USA.
Larrañaga, O. (2001). Distribución de ingresos en Chile: 1958-2001. Documento de trabajo, núm. 178. Departamento de Economía, Universidad de Chile, Santiago, Chile.
Libertad y Desarrollo (2000). Indicadores sociales. Available from: http://www.lyd.cl/programas/social /Indicadores.html [accessed Aug 2000].
Libertad y Desarrollo (2011). ¿Es tan alta la desigualdad en Chile? Temas Públicos, N.º 1.028. LyD, Santiago, Chile.
Marín, F., & Liliana J. (2005). Determinantes sociales de la salud en Chile. La perspectiva de la equidad. ICES, Santiago de Chile.
Mancero, J. (2000). Revisión de algunos indicadores para medir la desigualdad. In 6.º Taller Regional MECOVI, del 15 a 17 de noviembre de 2000, Buenos Aires, Argentina.
Medrano, P., Sanhueza, C., & Contreras, D. (2005). Inequality in Latin America: A synthesis of recent research of the levels, trends, effects and deter minants of inequality in its different dimensions. Overseas Development Institute, London.
Mideplan (2010). Distribución del Ingreso. Encuesta CASEN 2009. Available from: www.mideplan.cl [accessed 2010 Nov].
NCES (2004). Highlights from the Trends in International Mathematics and Science Study (TIMMS) 2003. National Center for Education Statistics, Washington DC.
OECD (2007). PISA 2006. Science competencies for tomorrow's world, 2: Data. Organization for Economic Co-operation and Development.
Olavarría-Gambi, M. (2005). Pobreza, crecimiento económico y políticas sociales. Universitaria, Santiago, Chile.
Ortiz, I., & Cummins, M. (2011). Global inequality: Beyond the bottom billion. A rapid review of income distribution in 141 countries. UNICEF Social and Economic Policy Working Paper. UNICEF, New York.
Panizza, U. (1999). Income inequality and economic growth: evidence from American data. In Research Department Working Paper, núm. 404. Inter American Development Bank, Office of the Chief Economist, Washington DC.
Pizzolitto, G. (2005). Poverty and inequality in Chile: Methodological issues and a literature review. In Documento de Trabajo, núm. 20. Centro de Estudios Distributivos, Laborales y Sociales, Maestría en Economía, Universidad Nacional de La Plata, Argentina.
Ruiz-Tagle, J. (1999). Chile: 40 años de desigualdad de ingresos. In Documento de Trabajo, núm. 165. Departamento de Economía, Universidad de Chile, Santiago, Chile.
Sapelli, C. (2011). Chile ¿más equitativo? Ediciones UC, Santiago, Chile.
Székely, M., & Hilgert, M. (1999). What's behind the inequality we measure: an investigation using Latin American. In Data.Research Department Working Paper, num. 409. Inter American Development Bank, Office of the Chief Economist, Washington DC.
Sen, A. (2006). Conceptualizing and measuring poverty. In Grusky D., & Ravi, K., (Eds.), Poverty and inequality. Stanford University Press, California.
Sen, A. (2000). Development as freedom. Anchor Books, Random House, New York.
Sen, A. (1998). Capacidad y bienestar. In Nusbaum M. C., & Sen, A. (Comps.), La calidad de vida. Fondo de Cultura Económica, Primera Reimpresión, México, DF.
Sen, A. (1995). The political economy of targeting. In Van de Walle, D., & Nead, K. (Eds.), Public spending and the poor. Theory and evidence. The World Bank, Washington DC.
Wilkinson, R., & Pickett, K. (2010). The spirit level: why equality is better for everyone. Penguin Books Ltd., London.
World Bank (2011). Measuring inequality, technical notes: Inequality measures and decompositions. In Poverty reduction & equity. Available from: http://web.worldbank.org/WBSITE/EXTERNAL/ TOPICS/ EXTPOVERTY/EXTPA/0,,contentMDK:20238991~menuPK: 492138~pagePK:148956~piPK:216618~theSitePK:430367,00.html [accessed 2012 Feb].
