


Metal matrix composites based on aluminum alloy AA7050 reinforced with graphene nanoparticles are fabricated using stir casting and squeeze casting techniques. Mechanical characteristics studies were performed on both the stir cast and squeeze cast composite specimen. Taguchi's L27 orthogonal array was used for the design of experiments. Certain parameters like melting temperature (775, 800 and 825°C), stirring speed (300, 400 and 500rpm) and graphene content (0.3, 0.5 and 0.7wt%) with three levels were considered for the experiments. Based on the experimental results, analysis of variance (ANOVA) was conducted to determine the level of influence of the parameters on the tensile strength of the specimens. The microstructural result shows that graphene particles are uniformly distributed in the aluminum matrix only in the composites with 0.3wt % graphene irrespective of the process followed for the fabrication of composite samples. It is being found that the tensile properties of both stir cast and squeeze cast samples have been enhanced for 0.3wt% of graphene in the AA7050 composites. Increasing the graphene content beyond 0.3wt% results in cluster formation.
Composite material consists of two or more constituents which are not soluble in each other at any condition. Composite material offered more strength than the individual constituents. Metal matrix composites comprise matrix materials such as aluminum, copper, magnesium etc. to deliver the high strength and low weight criteria which is mostly preferred in aerospace application [1]. Industrial applications of automotive and aerospace sectors require high strength materials for which lot of research work have been carried out in the past three decades. The extensive research work carried out on aluminum-based composites resulted in enhancing physical and mechanical properties. These properties mainly depend on reinforcement percentage, the processing method of aluminum alloys. AA7050 is one of the most widely used material for aerospace structural applications. The reinforcement is introduced into the base material to enhance the characteristics of the final product. Various reinforcements are used for enhancing different properties of the composites under different methods. Graphene is most attractive reinforcement due to its unique mechanical properties such as Young's modulus 0.5–1TPa, tensile strength 130GPa and specific surface area 2630m2g−1[2–4].
Various techniques have been developed in the recent past for the fabrication of aluminum metal matrix composites with different reinforcements. Different processing methods such as solid, semi-solid and liquid state methods were followed in the industries. Liquid phase processing has attracted more attention among which stir casting method is simple, economic and most widely used in various industries [5]. A major hurdle is the achievement of proper bonding between the matrix and reinforcement in order to achieve good load transfer between phases. Li et al. [6] investigated on aluminum/graphene composites fabricated through cryomilling and it was reported that addition of 0.5wt% graphene nanoflakes has increased the strength of composites significantly.
Perez-Bustamante et al. [7] have reported on hardness behavior of aluminum reinforced with graphene nanoplatelets synthesized by mechanical alloying with various weight percentage of graphene such as 0.25, 0.5 and 1.0wt% dispersed by milling process. Three different milling duration such as 1, 3 and 5h have been considered for the experimentation and it was concluded that milling time and the addition of graphene nanoplatelets have a positive effect on hardness values. Zhai et al. [8] investigated on aluminum matrix reinforced with multilayer graphene, and it was reported that mechanical properties were increased with the addition of graphene content up to 1%. Fadavi Boostani et al. [9] found that tensile properties of the aluminum matrix reinforced with graphene encapsulated SiC nanoparticles have significantly increased when compared to SiC reinforced composites. 7xxx series aluminum alloy are most preferred in military and civil services especially 7050 aluminum alloy is the first preference in the industries. AA7050 is a high strength and less weight aluminum alloy mostly used in aerospace and automotive industries because of its outstanding mechanical properties [10].
Graphene has an ultra-high thermal conductivity and was used to fabricate graphene/metal composites through vacuum filtration method followed by spark plasma sintering to ensure sufficient graphene alignment in the metal matrix. GNP (graphene nanoplatelets) fraction of 35vol% was used which resulted in highly aligned GNP network within the copper matrix which was 50% higher than that of copper matrix [11]. Graphene has great potential in metal matrix composites for thermal management due to its excellent thermal properties. Chu et al. [12] reported an efficient strategy to achieve high alignment of graphene nanosheets (GNSs) in copper matrix through a vacuum filtration method followed by spark plasma sintering. Because of the highly aligned GNSs and laminated structure, the GNS/Cu composites exhibited notable anisotropic thermal properties. Also this composite shows a reversed anisotropic behavior between thermal conductivity and coefficient of thermal expansion as a function of GNS fraction. Another investigation reported that copper reinforced with GNPs strengthens the Cu-composite which was prepared by the combination of ball milling and hot pressing processes. During the investigation the mechanical properties of yield strength observed was 114MPa at 8vol% of graphene [13].
Bai et al. [14] investigated on the semi-solid state of the aluminum alloy 7050 and it was observed that, its strength and ductility are high near the solidus temperature and decrease drastically with decreasing solid fraction. The primary driving force behind the development of most of the aluminum metal matrix composites is to achieve improved mechanical properties. Harringan [15] carried out research on the commercial processing of metal matrix composites with a variety of fabrication techniques. Among various fabrication techniques, stir casting method delivers a number of advantages over other techniques. Stir casting method is easily adaptable and moreover an economically viable technique for mass production and it is also preferred for near-net-shape composites [16]. Sekar et al. [17] investigated on aluminum metal matrix composites prepared by the combined effect of stir and squeeze casting method with alumina as a reinforcement material. Similarly, Sajjadi et al. [18] carried out research on aluminum A356 grade with alumina reinforcement fabricated by the stir and compo-casting processes. From the literature, it is understood that a reasonably good number of work on AA7050 based composites have been reported. But most of the reported work focused on the property evaluation of the composites fabricated through any one route (either solid state or liquid state or semisolid state). Comparison of the property evaluation on AA7050 composites reinforced with graphene fabricated through stir casting and squeeze casting has not be addressed. Therefore in this research work, an attempt is being made to evaluate the tensile behavior of AA7050 composites reinforced with graphene nanoparticles fabricated by stir casting and squeeze casting processes.
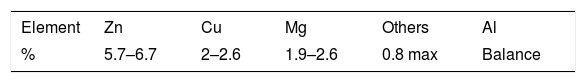
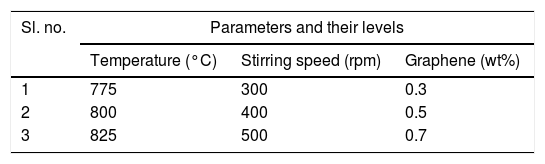
2ExperimentalIn this research work AA7050-graphene composite samples are fabricated through stir cast and squeeze cast techniques. The chemical composition of AA7050 is presented in Table 1. Graphene with a size of 50–100nm supplied by Angstron Materials Inc., USA was used in this research work. Graphene nanoparticles are confirmed through UV–visual spectrometer reading which is shown in Fig. 1. The absorbance of light, while passing through a sample was measured using UV–visible double beam spectrophotometer in the spectrum of 180–780nm. Through spectrometric analysis, the absorbed light leak at 200nm showed the presence of graphene particles. The AA7050 matrix material is melted in electric induction furnace maintained at different levels of temperature such as 775, 800 and 825°C. The furnace is equipped with the stirrer and the stirrer speed is chosen as 300, 400 and 500rpm. The graphene content for fabricating the composites are selected as 0.3, 0.5 and 0.7wt%. Reinforcements and die were preheated to a temperature 300°C and 200°C respectively to oxidize the surfaces. Before fabrication of casting, 5% of magnesium is added to the slurry in order to increase the fluidity and to achieve the good bonding between the matrix and reinforcement.

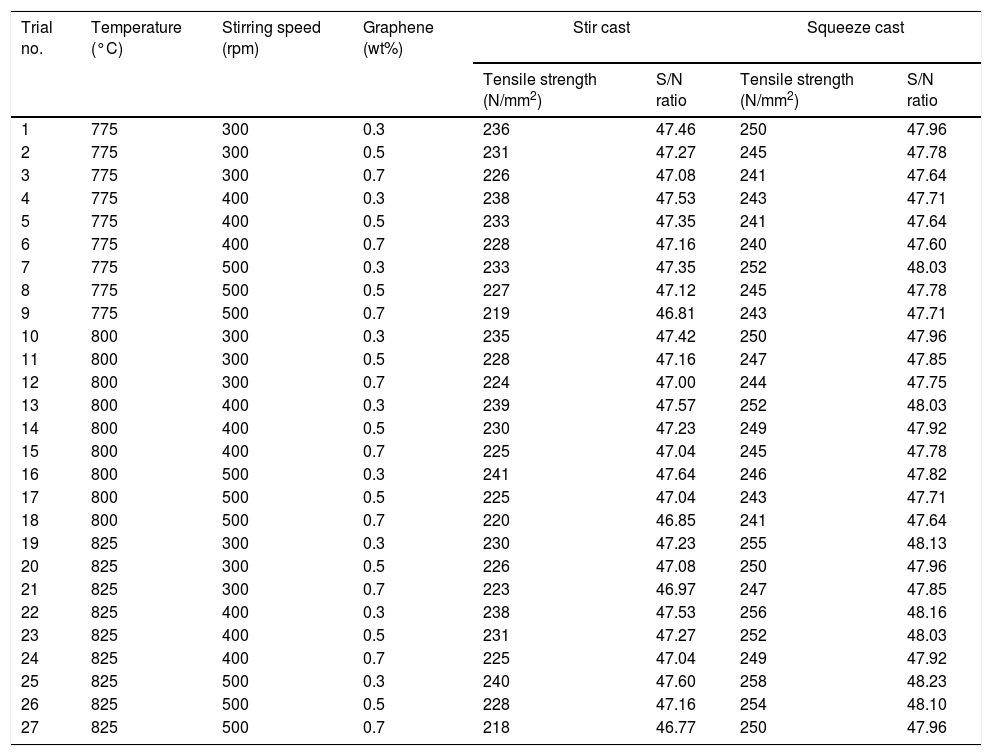
The testing specimens were fabricated using the experimental conditions as designed by Taguchi L27 orthogonal array. The parameters and their levels considered for experimentation are shown in Table 2. Table 3 shows the combination of parameters which were adopted for the fabrication of composites through stir cast and squeeze cast processes. Tensile testing is performed as per ASTM E8 standard on the fabricated specimen and data are presented in Table 3. Tensile test specimen were prepared using wire cut process as per the standard (shown in Fig. 2) and the tensile behavior of the specimen was observed with Instron Universal Testing Machine (UTM). Fig. 3(a) and (b) indicates the tensile test specimen fabricated through stir cast and squeeze cast processes respectively. Stir cast samples show a brittle fracture whereas squeeze cast samples indicate a ductile fracture. It is also being observed that the crack is originated near the neck portion in the stir cast samples whereas the crack is originated from the middle of the gauge length in case of squeeze cast sample.
Experimental observations from stir and squeeze cast.
| Trial no. | Temperature (°C) | Stirring speed (rpm) | Graphene (wt%) | Stir cast | Squeeze cast | ||
|---|---|---|---|---|---|---|---|
| Tensile strength (N/mm2) | S/N ratio | Tensile strength (N/mm2) | S/N ratio | ||||
| 1 | 775 | 300 | 0.3 | 236 | 47.46 | 250 | 47.96 |
| 2 | 775 | 300 | 0.5 | 231 | 47.27 | 245 | 47.78 |
| 3 | 775 | 300 | 0.7 | 226 | 47.08 | 241 | 47.64 |
| 4 | 775 | 400 | 0.3 | 238 | 47.53 | 243 | 47.71 |
| 5 | 775 | 400 | 0.5 | 233 | 47.35 | 241 | 47.64 |
| 6 | 775 | 400 | 0.7 | 228 | 47.16 | 240 | 47.60 |
| 7 | 775 | 500 | 0.3 | 233 | 47.35 | 252 | 48.03 |
| 8 | 775 | 500 | 0.5 | 227 | 47.12 | 245 | 47.78 |
| 9 | 775 | 500 | 0.7 | 219 | 46.81 | 243 | 47.71 |
| 10 | 800 | 300 | 0.3 | 235 | 47.42 | 250 | 47.96 |
| 11 | 800 | 300 | 0.5 | 228 | 47.16 | 247 | 47.85 |
| 12 | 800 | 300 | 0.7 | 224 | 47.00 | 244 | 47.75 |
| 13 | 800 | 400 | 0.3 | 239 | 47.57 | 252 | 48.03 |
| 14 | 800 | 400 | 0.5 | 230 | 47.23 | 249 | 47.92 |
| 15 | 800 | 400 | 0.7 | 225 | 47.04 | 245 | 47.78 |
| 16 | 800 | 500 | 0.3 | 241 | 47.64 | 246 | 47.82 |
| 17 | 800 | 500 | 0.5 | 225 | 47.04 | 243 | 47.71 |
| 18 | 800 | 500 | 0.7 | 220 | 46.85 | 241 | 47.64 |
| 19 | 825 | 300 | 0.3 | 230 | 47.23 | 255 | 48.13 |
| 20 | 825 | 300 | 0.5 | 226 | 47.08 | 250 | 47.96 |
| 21 | 825 | 300 | 0.7 | 223 | 46.97 | 247 | 47.85 |
| 22 | 825 | 400 | 0.3 | 238 | 47.53 | 256 | 48.16 |
| 23 | 825 | 400 | 0.5 | 231 | 47.27 | 252 | 48.03 |
| 24 | 825 | 400 | 0.7 | 225 | 47.04 | 249 | 47.92 |
| 25 | 825 | 500 | 0.3 | 240 | 47.60 | 258 | 48.23 |
| 26 | 825 | 500 | 0.5 | 228 | 47.16 | 254 | 48.10 |
| 27 | 825 | 500 | 0.7 | 218 | 46.77 | 250 | 47.96 |

 stir cast (b) squeeze cast.")
The observed data of tensile strength were used for the further analysis such as mean effect plot, analysis of variance, signal-to-noise ratio and regression analysis.
3.1Effect of process parametersEffects of mean plot and SN ratio for the tensile strength of stir cast specimen are shown in Fig. 4(a) and (b). The SN ratio plot gives the optimum value (temperature=775°C, stirrer speed=400rpm and graphene=0.3wt%) of process parameters for the maximum tensile strength of AA7050-graphene composite and mean plot describes the trend of responses for the three parameters.
 mean and (b) SN ratio of stir cast specimens.")
Similarly, the effects of mean plot and SN ratio for the tensile strength of squeeze cast specimen are shown in Fig. 5(a) and (b). The SN ratio plot gives the optimum value (temperature=825°C, stirrer speed=500rpm and graphene=0.3wt%) of process parameters for the maximum tensile strength of AA7050-graphene composite and mean plot describes the trend of responses for the three parameters. Residual plots were generated based on the observation which reveals that each value is closer to the normal probability plot as shown in Fig. 6 for the stir cast specimens. Interaction plot for the tensile strength of stir cast specimen is shown in Fig. 7(a)–(c) which reveals that stir casting process temperature is to be maintained at 775°C to obtain the maximum tensile strength of 230MPa. Graphene content 0.3wt% and a stirrer speed of 400rpm at a temperature of 775°C is recommended for maximum tensile strength. Decreasing trend of tensile strength is observed for a temperature of 825°C, stirrer speed higher than 400rpm and more than 0.3wt% of graphene content in the composite fabricated through stir cast process. Figs. 8 and 9(a)–(c) show the residual plots and interaction plots for the tensile strength of squeeze cast samples. Maximum tensile strength of 255MPa was observed at a temperature of 825°C, graphene content of 0.3wt%, and the maximum stirrer speed of 400rpm.
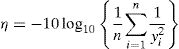
3.2Signal-to-noise ratio analysis mean and (b) SN ratio of squeeze cast specimens.")

 for tensile strength of stir cast specimens.")

 for tensile strength of squeeze cast specimens.")
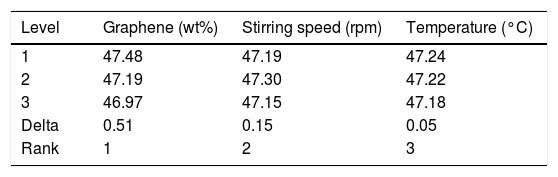
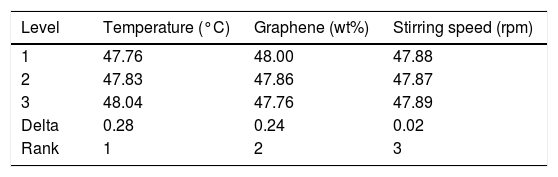
Signal to noise ratio analysis was carried out using “larger-is-better” characteristic as mentioned in Eq. (1). Response table is generated based on the S/N ratio values to evaluate the influence of the parameters on the tensile strength of AA7050-graphene composite fabricated by stir casting and squeeze casting processes. Tables 4 and 5 show the delta value which indicates the variation in mean within the levels. Delta value is calculated by subtracting the smallest mean value from the largest mean value of S/N ratio. The delta value will be high when there is a larger variation between the mean values. The parameter with the largest delta value has greater significance on the tensile strength. Based on the delta value which is observed that graphene wt% has the major significance on tensile strength followed by stirrer speed and melting temperature for stir casting process. But in the squeeze casting process, the major significance on tensile strength is melting temperature followed by graphene wt% and stirrer speed.
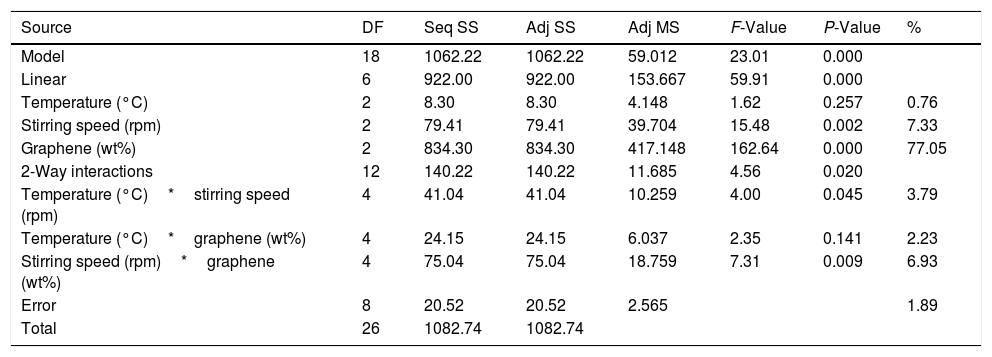
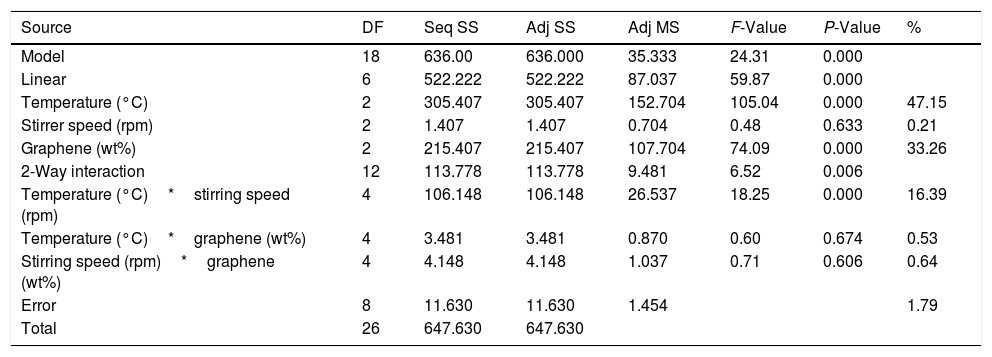
ANOVA was carried out to identify the significance of each process parameters considered for the experimentation based on multiple performance characteristics. ANOVA for the tensile strength of AA7050-graphene composite fabricated by stir cast and squeeze cast processes are indicated in Tables 6 and 7. From Table 6, it is being observed that graphene wt% (77.05%) have significant contribution when compared to the other two parameters namely temperature (0.76%) and stirrer speed (7.33%) and negligible value of the interaction. Hence interaction effect is less significant in the stir cast process. Table 7 indicates that temperature (47.15%) exhibits higher contribution on tensile behavior followed by graphene (33.26%) and stirrer speed (0.21%). Here also there is no interaction effect on the tensile behavior of aluminum composites. Hence temperature has a significant effect on tensile behavior when compared to the stirrer speed and graphene of squeeze casted samples. R2 value is determined by using Minitab-17 version software which is found to be 95.5% and adjusted R2 value is 93.14% for stir cast process. For squeeze cast process the R2 value is 76.3% and adjusted R2 value is 73.2%. The obtained R2 values are very close to each other which is acceptable as per the statistical norms.
ANOVA for tensile strength – Stir casting.
| Source | DF | Seq SS | Adj SS | Adj MS | F-Value | P-Value | % |
|---|---|---|---|---|---|---|---|
| Model | 18 | 1062.22 | 1062.22 | 59.012 | 23.01 | 0.000 | |
| Linear | 6 | 922.00 | 922.00 | 153.667 | 59.91 | 0.000 | |
| Temperature (°C) | 2 | 8.30 | 8.30 | 4.148 | 1.62 | 0.257 | 0.76 |
| Stirring speed (rpm) | 2 | 79.41 | 79.41 | 39.704 | 15.48 | 0.002 | 7.33 |
| Graphene (wt%) | 2 | 834.30 | 834.30 | 417.148 | 162.64 | 0.000 | 77.05 |
| 2-Way interactions | 12 | 140.22 | 140.22 | 11.685 | 4.56 | 0.020 | |
| Temperature (°C)*stirring speed (rpm) | 4 | 41.04 | 41.04 | 10.259 | 4.00 | 0.045 | 3.79 |
| Temperature (°C)*graphene (wt%) | 4 | 24.15 | 24.15 | 6.037 | 2.35 | 0.141 | 2.23 |
| Stirring speed (rpm)*graphene (wt%) | 4 | 75.04 | 75.04 | 18.759 | 7.31 | 0.009 | 6.93 |
| Error | 8 | 20.52 | 20.52 | 2.565 | 1.89 | ||
| Total | 26 | 1082.74 | 1082.74 |
DF – degree of freedom; Seq SS – sequential sum of squares; Adj SS – adjacent sum of squares; Adj MS – adjacent mean squares; F – Fisher's test; P – level of significance.
ANOVA for tensile strength – squeeze casting.
| Source | DF | Seq SS | Adj SS | Adj MS | F-Value | P-Value | % |
|---|---|---|---|---|---|---|---|
| Model | 18 | 636.00 | 636.000 | 35.333 | 24.31 | 0.000 | |
| Linear | 6 | 522.222 | 522.222 | 87.037 | 59.87 | 0.000 | |
| Temperature (°C) | 2 | 305.407 | 305.407 | 152.704 | 105.04 | 0.000 | 47.15 |
| Stirrer speed (rpm) | 2 | 1.407 | 1.407 | 0.704 | 0.48 | 0.633 | 0.21 |
| Graphene (wt%) | 2 | 215.407 | 215.407 | 107.704 | 74.09 | 0.000 | 33.26 |
| 2-Way interaction | 12 | 113.778 | 113.778 | 9.481 | 6.52 | 0.006 | |
| Temperature (°C)*stirring speed (rpm) | 4 | 106.148 | 106.148 | 26.537 | 18.25 | 0.000 | 16.39 |
| Temperature (°C)*graphene (wt%) | 4 | 3.481 | 3.481 | 0.870 | 0.60 | 0.674 | 0.53 |
| Stirring speed (rpm)*graphene (wt%) | 4 | 4.148 | 4.148 | 1.037 | 0.71 | 0.606 | 0.64 |
| Error | 8 | 11.630 | 11.630 | 1.454 | 1.79 | ||
| Total | 26 | 647.630 | 647.630 |
DF – degree of freedom; Seq SS – sequential sum of squares; Adj SS – adjacent sum of squares; Adj MS – adjacent mean squares; F – Fisher's test; P – level of significance.
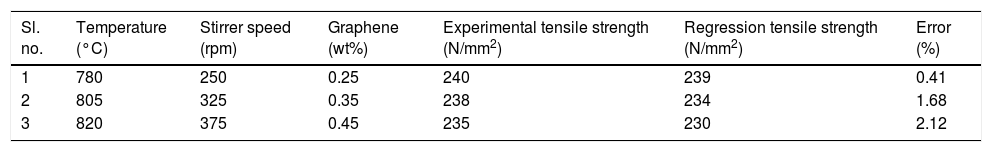
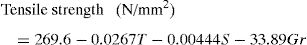
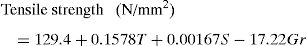
The linear regression equation was constructed by using statistical software Minitab version 17. The correlation between a response variable and predicted variables are identified based on linear regression analysis. Eqs. (2) and (3) represent the AA7050-graphene composite fabricated by stir casting and squeeze casting respectively. Both the equation contains positive (+) or negative (−) sign which indicates the variation in tensile strength of AA7050-graphene composites. The positive sign indicates that the tensile strength has increased and a negative sign indicates the tensile strength has decreased. The confirmation test was carried out with other parameter values as shown in Tables 8 and 9 and tensile strength experiments were conducted with three different levels. Results observed from the experimental values are compared with the regression equation and it was observed that the error % is less than 3% approximately. The regression tensile strength results are close to the experimental tensile strength with minimum error % which was negligible.
Regression equation (stir casting)
Regression equation (squeeze casting)
where T – temperature, S – stirring speed and Gr – graphene.
Regression analysis and confirmation tests – stir casting process.
| Sl. no. | Temperature (°C) | Stirrer speed (rpm) | Graphene (wt%) | Experimental tensile strength (N/mm2) | Regression tensile strength (N/mm2) | Error (%) |
|---|---|---|---|---|---|---|
| 1 | 780 | 250 | 0.25 | 240 | 239 | 0.41 |
| 2 | 805 | 325 | 0.35 | 238 | 234 | 1.68 |
| 3 | 820 | 375 | 0.45 | 235 | 230 | 2.12 |
Regression analysis and confirmation tests – squeeze casting process.
| Sl. no. | Temperature (°C) | Stirrer speed (rpm) | Graphene (wt%) | Experimental tensile strength (N/mm2) | Regression tensile strength (N/mm2) | Error (%) |
|---|---|---|---|---|---|---|
| 1 | 780 | 250 | 0.25 | 252 | 249 | 1.19 |
| 2 | 805 | 325 | 0.35 | 253 | 251 | 0.79 |
| 3 | 820 | 375 | 0.45 | 256 | 253 | 1.17 |
The surface plot (Fig. 10) shows a linear effect which reveals that variation of tensile strength has an increasing trend due to the combination of different parameters. The zig-zag trend depends on the significance of the particular combination of the parameters [19]. The zig-zag trend of tensile strength was observed for changes in stirring speed with respect to melting temperature. The surface plot shows that the tensile strength decreased with increasing stirrer speed with respect to the melting temperature. Hard reinforcement particles which protrude in the AA7050-graphene composite material will tend to contact closer with matrix and reinforcement materials. In this investigation, these protrusions produce the lesser effect of tensile strength.
3.5Microstructural examination graphene, stirring speed, (b) graphene, temperature, (c) temperature, stirring speed.")
AA7050-graphene composite samples were subjected to microstructural examination to evaluate its properties. Samples are polished using fresh emery papers with different grades to obtain fine surface finish. Keller's reagent was applied on the specimen for etching the surface to view the microstructure. Copper matrix reinforced with graphene nanosheets were prepared by molecular level mixing process and spark plasma sintering process. In the microstructure observed GNP were distributed randomly in Cu-composites with low graphene concentration (less than 0.8vol%). Mechanical performance of copper was strengthened by the graphene addition. However, the strengthening effects were firstly enhanced and then deteriorated by increasing graphene content [20]. The forms of bonding at the interface of aluminum matrix composites during molecular mixing process as there are functional groups on the carbon fillers which is beneficial to the load transfer between matrix and reinforcement. Interfaces and strong interfacial bonding between the graphene reinforcement and the aluminum alloy AA7050 metal matrix play an important role in determining tensile strength of the composites. SEM images reveal that the interface information of GNP/Al composites also shows that the interfaces are continuous and free of gaps or impurities.
The microstructural studies were carried out using Zeiss metallurgical microscope to confirm the uniform distribution of graphene nanoparticles in aluminum matrix. The uniform distribution of graphene particles in the matrix depends on the process parameters of stir casting and squeeze casting methods. Fig. 11(a)–(d) indicates the SEM images of the composite fabricated by stir cast and squeeze cast processes. Fig. 11(c) and (d) indicates the SEM images of the composites with 0.3wt% and 0.7wt% graphene respectively. The uniform distribution of particles in the matrix is achieved due to the action of stirring phenomenon [21]. This stirring action avoids floating of reinforcement particles over the molten metal by sucking the particles into molten metal through the creation of a vortex. Reinforcement particles are fully wet by the molten metal which leads to the better bonding of particles in the matrix. The defect-free casting ensures that stirring action is carried out to an optimum speed which avoids over agitation of molten metal.
 stir cast, (b) squeeze casting of AA7050-graphene composite material, (c) 6000× magnification of the composite containing 0.3wt% of graphene and (d) 0.7wt% of graphene in the composite.")
The fractured surface of AA7050-graphene composite fabricated by stir cast and squeeze cast processes were analyzed by using SEM shown in Fig. 12. In the squeeze cast samples a large number of ductile dimples were observed but in the stir cast samples, ductile dimples are less in quantity. From the SEM image, it is observed that there is a transition of brittle to ductile fracture in case of AA7050-graphene composite fabricated by squeeze cast process. EDS analysis of AA7050-graphene fabricated by stir cast process is shown in Fig. 13. Mapping analysis of EDS images is shown in Fig. 14. The EDS examination of the composite shows a low intensity of oxide peak and high intensity of Al peak. Next peak value observed is carbide shown in Fig. 13 which indicates the presence of graphene.
 stir cast and (b) squeeze cast.")


In Fig. 15, X-axis represents energy (keV) and Y-axis represents the counts of corresponding elements in terms of weight percentage. The EDS is shown in Fig. 15 indicates the presence of C, O, Mg, Al, Fe, Zn. The distribution of elements (C, O, Mg, Al, Fe, Zn) in AA7050-graphene composite was checked with X-ray mapping. SEM micrograph with high magnification shown in Fig. 16 clearly reveals that there exists a good and clean interface between the matrix and reinforcement. The elemental mapping across a line in the figure shows the presence of C, O, Mg, Al, Fe, Zn which indicates that no reaction products are formed at the interface. It was confirmed that the iron content was observed along with reinforcement through EDS analysis of the AA7050-graphene composite fabricated by squeeze casting process. But through the stir casting process iron content was not observed. The formation of fragmented eutectic phase in the surface region leads to the formation of the hardened surface layer and its thickness of layer depends on the parameters. The hardened layer contains a mixture of iron (Fe) and fragment eutectic phase. There is a eutectic in the aluminum-rich alloys at 655°C with a probable composition within the range of 1–2%. The phase in equilibrium with aluminum is usually designated as FeAl3, although some analysis of crystals extracted from alloys is close to Fe2Al7. The Fe2Al3 compound forms directly from the liquid at 850°C and not by peritectic reaction. In rapidly squeezed alloy the metastable compound FeAl6 is formed.


Fig. 17 shows the XRD patterns of the squeeze casted AA7050-graphene composite with 0.3, 0.5 and 0.7wt% of graphene nanoparticles concentrations. Graphene peaks at lower concentration are not formed and at higher concentrations (greater than 0.3wt%) peaks are found at 2θ≈26.54°(006) and the new peak increases with the concentration of the graphene weight percentage in the composite. All samples show major aluminum peaks at ≈38.3°(111), ≈82.3°(222), ≈44.6°(200), ≈78.2°(311) and 65.1°(220).

In aluminum matrix reinforced with graphene, the chemical reaction between graphene and molten aluminum generate a layer of aluminum carbide in Al-graphene composite. Aluminum carbide particles will be finely dispersed in aluminum matrix to withstand the tendency of the material to creep. Copper matrix reinforced with graphene nanosheets were prepared by molecular level mixing process and spark plasma sintering process. In the microstructure observed GNP were distributed randomly in Cu-composites with low graphene concentration (less than 0.8vol%). Mechanical performance of copper was strengthened by the graphene addition. However, the strengthening effects were firstly enhanced and then deteriorated by increasing graphene content [20].
The bonding at the interface of aluminum matrix composites during molecular mixing process is due to the nature of functional groups on the carbon fillers which is beneficial to the load transfer between matrix and reinforcement. Thermal diffusivity induced by graphene addition is due to three mechanisms. Firstly, the mean-free path of heat carrier was reduced due to the decreased matrix grain size and increased dislocation density. Second, the interfacial thermal resistance was raised by the large thermal expansion mismatch and poor adherence between copper and graphene. Third, voids formed during sintering served as insulating barriers to the heat flow.
Raman spectroscopy is used to identify structure of graphene nanoparticles of raw material. Raman scattering is a fast technique that provides a direct insight on electro-photon interactions, which implies a high sensitivity to electronic and crystallographic structures. Raman spectra of carbon materials possess three main bands between 1200 and 2800cm−1 region. D band at ∼1380cm−1 is due to out of plane breathing mode of sp2 atoms. It attributes to disorder of graphitic base materials due to presence of impurities.
G band at around 1580cm−1 corresponds to the E2g phonon at the center of Brillion zone. 2D band at around 2700cm−1 is a major finger print of graphene. The shape, position and intensity relative to G band of this peak depend on number of layers. Fig. 18 illustrates Raman spectra of as received GNPs and dispersed on aluminum matrix substrate exhibit significant D band at 1335cm−1, strong G band at 2660cm−1. The intensity ratio 2D band to G band (l2D/lG) shows multilayer features of GNPs.
4Conclusion
The AA 7050-graphene composite was successfully fabricated by stir cast and squeeze cast techniques. The microstructure of the composite was observed and result reveals that there is a uniform distribution of graphene particles in the aluminum matrix. From the ANOVA, it was noted that graphene is the most influencing parameter on the tensile strength of the composite fabricated by stir cast process. Similarly, from the ANOVA on squeeze cast specimen, it was noted that melting temperature is the most influencing parameter on the tensile strength of the composite. The regression equation was generated and validated with the confirmatory results. It was confirmed that the iron content was observed along with reinforcement through EDS analysis of the composite fabricated by squeeze casting process.