


To increase the confidence in the design of adhesive structures, it is necessary to accurately predict their strength and fracture properties (critical strain energy release rate in tension, GIC, and shear, GIIC). It is of great importance the perception of fracture under mixed-mode, namely in which relates to the strain energy release rate in tension, GI, and shear, GII. This allows choosing the best failure criterion to use in cohesive zone models (CZM), to predict the joints’ behaviour. This work presents an experimental and numerical study using the Single-Leg Bending (SLB) test on bonded specimens to obtain the mixed-mode fracture properties. The analysis of GI and GII obtained during the experimental phase were addressed. Framing the obtained values in several fracture envelopes enable to select which failure criterion is more appropriate for each adhesive. In the numerical simulations it was possible to reproduce the observed behaviour of the experimental tests, with a positive validation of the chosen propagation criteria.
Adhesive joints present several advantages over other joining processes such as welding, fastening and riveting. Their widespread use in various applications is due to the low weight, less stress concentrations, acoustic insulation and improved corrosion resistance. On the other hand, adhesive joints also have disadvantages/limitations: requirement of joint preparation, poor resistance to peeling or cleavage loads and low confidence in the predictive techniques [1]. Thus, the use of this joining technique depends on the existence of accurate predictive techniques [2]. The predictive techniques for bonded joints can be divided into continuum mechanics or fracture mechanics. In continuum mechanics, the stress distributions are estimated by analytical or numerical methods [3], and then the maximum load (Pm) is predicted by comparing these stresses (or strains) in the models with the material allowable values. Traditional fracture mechanics is not commonly used for bonded joints, but few works apply the Virtual Crack Closure Technique (VCCT) [4]. CZM uses strength of materials principles for damage initiation combined with fracture mechanics criteria to provide the user with a damage growth analysis of structures, e.g. adhesive joints [5]. The eXtended Finite Element Method (XFEM) is a recent improvement of the conventional Finite Element Method (FEM), also using energetic concepts to model crack propagation, which overcomes CZM by not needing special elements at the growth paths [6]. However, as shown in recent studies [7], there are still problems in simulating crack growth under mixed-mode conditions, as it occurs in bonded joints, which may impede the crack to grow along the adhesive line.
To predict the strength of adhesively-joints in structures, it is necessary to know the relevant mechanical and fracture properties of each adhesive. Typically, an adhesive joint may be put under tensile or shear stresses, being in most cases subjected simultaneously to both, thereby creating a mixed-mode loading [8]. As such, it is necessary to study the properties of the adhesives in view of this mixed-mode. In fact, there are numerical methods as CZM, associated to FEM analyses, for which is vital the estimation of parameters such as GIC and GIIC. In addition to this fact, due to the previously mentioned mixed-mode loading, the use of a fracture criterion that promotes the growth of damage under these conditions is required. There are several criteria for that purpose and, as such, it is extremely important to know the most appropriate criterion for each type of adhesive. In this context, fracture tests under mixed-mode are an indispensable help that frame the observed behaviour in the fracture envelope, and thus enable selecting the most appropriate failure criterion [9]. A wide range of test methods is available depending on whether pure or mixed-mode evaluations are required, in which the specimens typically behave as slender beams [10]. For purely tensile characterization, the Double-Cantilever Beam (DCB) test is undoubtedly the most relevant for measuring GIC. For shear fracture testing, the End-Notched Flexure (ENF) test is the most accepted [11], whilst the 4-Point End-Notched Flexure (4ENF) and End-Loaded Split (ELS) tests are also available [12]. One of the most widespread test methods for the characterization of the mixed-mode fracture is the SLB test, initially developed by Yoon and Hong [13], which is popular amongst experimentalists because of its simplicity and availability of closed-form solutions. The SLB test uses a simple three-point bending test arrangement, identically to the ENF test. The most versatile is undoubtedly the Mixed-Mode Bending (MMB) test, since the specific testing apparatus for this test method allows varying the mode ratio, thus giving an overview of the fracture envelope [14]. The ELS specimens can also be used under mixed-mode, addressed in this case as Single-Cantilever Beam (SCB), but they require a specific clamping device [15]. The Uneven Bending Moment DCB (DCB-UBM) is a more complicated test method for mixed-mode analysis [16]. Recent works were devoted to the establishment of mixed-mode cohesive laws by mixed-mode fracture tests. Wu et al. [17] proposed a direct method to estimate the mixed-mode cohesive laws of silicon-epoxy interfaces by using the ELS test, based on measurements of load–displacement (P–δ), crack extension, crack tip opening displacement and fracture energy (GC). The mode-mixity was controlled by the thickness of the epoxy layer. CZM simulations with the experimentally obtained mixed-mode laws were then used to predict the failure of ELS specimens with phase angles from −42° to 0°. It was found that GC was a function of the mode-mix, although the strengths and softening parameter were not. Song et al. [18] estimated the mixed-mode CZM law of an interface crack between epoxy and a transparent thermoplastic using the DCB test arrangement, using the field projection method and experimentally measured displacements by digital image correlation. By the proposed approach, the nonlinear deformations and damage near the crack tip were converted to tractions–separations of the crack surfaces behind the crack tip. The phase angle of the obtained mixed-mode law was also evaluated to characterize the interface between resins. The developed procedure was considered to be efficient in predicting the mixed-mode cohesive laws of cracks between different materials.
This work presents an experimental and numerical study using the SLB test on bonded specimens, in order to study and compare their fracture properties. For this purpose, some data reduction methods were applied to estimate GI and GII, within the scope of models that require the measurement of the crack length (a) and models using an equivalent crack (aeq). At a later stage, the analysis and comparison of results obtained during the experimental phase of GI and GII of each adhesive were addressed. Framing the obtained values in several fracture envelopes enable to select which failure criterion is more appropriate for each adhesive. FEM/CZM numerical simulations were used to reproduce the observed behaviour of the experimental tests.
2Experimental work2.1Materials’ characterizationThe composite adherends were fabricated from unidirectional carbon-epoxy pre-preg (SEAL® Texipreg HS 160 RM; Legnano, Italy) with 0.15mm thickness by hand-lay-up of 20 unidirectional plies and cured in a hot-plates press for 1h at 130°C and pressure of 2bar. The elastic-orthotropic properties of a unidirectional lamina for identical curing conditions can be found in reference [19]. The experimental testing programme included the brittle epoxy adhesive Araldite® AV138, previously characterized [20]. Bulk specimens were tested in a servo-hydraulic machine to obtain the Young's modulus (E), tensile yield stress (σy), tensile strength (σf) and tensile failure strain (ɛf). Shear characterization of the adhesive was performed by Thick Adherend Shear Tests (TAST) in previous works. The DCB test was selected to obtain GIC and the ENF test was used for GIIC. The fabrication procedure of these specimens was identical to that described in reference [21]. The mechanical properties are summarized in Table 1.
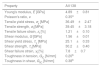
Mechanical and fracture properties of the adhesive Araldite® AV138 [20].
| Property | AV138 |
|---|---|
| Young's modulus, E [GPa] | 4.89±0.81 |
| Poisson's ratio, ν | 0.35a |
| Tensile yield stress, σy [MPa] | 36.49±2.47 |
| Tensile strength, σf [MPa] | 39.45±3.18 |
| Tensile failure strain, ɛf [%] | 1.21±0.10 |
| Shear modulus, G [GPa] | 1.56±0.01 |
| Shear yield stress, τy [MPa] | 25.1±0.33 |
| Shear strength, τf [MPa] | 30.2±0.40 |
| Shear failure strain, γf [%] | 7.8±0.7 |
| Toughness in tension, GIC [N/mm] | 0.20b |
| Toughness in shear, GIIC [N/mm] | 0.38b |
The geometry and dimensions of the SLB specimens are provided in Fig. 1.

The dimensions of the specimens are: total length or mid-span L=140mm (DCB) or L=100mm (ENF and SLB), initial crack length a0≈40mm (DCB) or ≈60mm (ENF and SLB), adherends’ thickness h=3mm, width B=25mm and adhesive thickness tA=1mm. Before the specimens’ assembly, the surfaces to be bonded were manually abraded with fine mesh sandpaper, degreased and cleaned with acetone, and placed in a steel mould for bonding. Calibrated steel spacers were introduced between the lower and upper adherends to achieve the correct value of tA. The crack tip spacers were composed of a sharp razor blade with a thickness of 0.1mm between 0.45mm thick steel spacers to induce a sharp pre-crack. After curing, one of the adherends’ sides was painted with brittle white paint to make possible the measurement of a, and a numbered scale was attached to follow the crack during the test [22]. In total, 6 DCB, ENF and SLB specimens were tested for each adhesive at room temperature in an electro-mechanical testing machine Shimadzu AG-X 100 with a load cell of 100kN. Each test was documented by 18 MPixel images taken by a digital camera with no zoom and fixed focal distance to approximately 100mm. Fig. 2 shows the test setup for the SLB specimens.
2.3Data reduction methods to estimate the toughness
GIC and GIIC, using the DCB and ENF tests, respectively, was assessed by the Compliance-Based Beam Method (CBBM), which is a method that does to require to measure a during the test and uses only the experimental value of compliance (C). The CBBM uses aeq, which is directly obtained from the experimental P–δ data [23]. The aeq parameter takes into consideration the Fracture Process Zone (FPZ) effects at the crack tip (not taken into account when the real a is considered). Thus, the estimated aeq is intrinsically higher than the real a, since it represents a plus the plastic region ahead of a. Applied to the DCB test specimen, the CBBM can be found in reference [24]. The CBBM was also developed for the ENF specimen [25]. For the SLB tests, different methods were evaluated, to provide a detailed performance comparison between the traditional available methods with the CBBM, which takes into account the FPZ effects in the aeq formulation. Model 1 is the model of Oliveira et al. [26], based on the energy released obtained from the Timoschenko's beam theory and C estimated by the Castigliano's theorem. The data reduction scheme proposed by Szekrényes and Uj [10] is addressed in this work as model 2. This model in based on the Timoschenko beam theory and Winkler foundation analysis, thus accounting for transverse shear and elastic foundation effects. Model 3, developed by Zhu [27], is based on the data reduction scheme proposed by Szekrényes and Uj [28], which applied Euler–Bernoulli and Timoshenko beam theories in conjunction with a Winkler-Pasternak Foundation analysis, a Saint-Venant effect analysis at the crack tip, and a crack tip shear deformation analysis to determine the compliance and GI/GII of an SLB specimen with an initial crack. Model 4 was proposed by Kim et al. [29], which applied the Irwin–Kies equation [30] to SLB specimens with adherends having different h. However, instead of considering beam theories to estimate C=f(a), the relation between C and a was experimentally found, which enabled accounting for bending and shear effects near the crack tip. Model 5 is that of Szekrényes and Uj [28], whose beam theory-based formulation integrated effects such as transverse shear, Winkler-Pasternak-type elastic foundation, Saint-Venant effect, and crack tip shear deformation. Model 6 (CBBM) was developed by Fernández et al. [31] based on the beam theory of Szekrényes and Uj [10], resulting in a calculation method that uses aeq from the experimentally measured C.
3Numerical work3.1Numerical conditionsThe FEM analysis of the SLB tests was undertaken in Abaqus® using geometrical non-linearities. Meshing used plane-strain four-node quadrilateral solid finite elements (CPE4 from Abaqus®) for the adherends, and four-node cohesive elements (COH2D4 from Abaqus®) with linear softening for the adhesive. The adherends were meshed with eight elements through-thickness, with size grading up to the adhesive region [21]. Lengthwise, in the crack propagating region and near the cylinders the mesh has a higher refinement. The boundary conditions consisted of fixing the supporting cylinders in the xy plane, restraining the loading cylinder in the horizontal direction and restraining the model horizontally in an intermediate point to prevent rigid body movement. Loading of the specimens consisted of a downwards vertical prescribed displacement applied to the loading cylinder. Contacting conditions were also established between the adherends at the initial crack zone, and between all cylinders and faces in the specimen that they contact with, to avoid interpenetration. Individual numerical models were constructed for each specimen by incorporating its specific dimensions, including the measured value of a0. After this, the experimental tests were numerically replicated by considering a CZM model with triangular shape with average values of GIC and GIIC obtained from the DCB and ENF tests, respectively, and the tensile and shear cohesive strengths, tn0 and ts0, respectively, approximated to the tensile and shear strengths depicted in Table 1. The α parameter of the energetic growth criterion, to be defined in Eq. (2) of Section 3.2, is that found to be the most suited, experimentally established in Section 4.3. The objective of the analysis is the numerical verification on the suitability of the proposed growth criteria and a values, such that it can be subsequently applied in the strength prediction of adhesive joints.
3.2Triangular CZMCZM are based on a relationship between stresses and relative displacements (in tension or shear) connecting paired nodes of cohesive elements, to simulate the elastic behaviour up to tn0 in tension or ts0 in shear and subsequent softening, to model the degradation of material properties up to failure. The areas under the traction–separation laws in tension or shear are equalled to GIC or GIIC, by the respective order. Under pure loading, damage grows at a specific integration point when stresses are released in the respective damage law. Under a combined loading, stress and energetic criteria are often used to combine tension and shear [32]. The triangular law assumes an initial linear elastic behaviour followed by linear degradation. Damage initiation can be specified by different criteria. In this work, the quadratic nominal stress criterion was considered for the initiation of damage, expressed as [33]
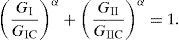
tn and ts are the current tensile and shear tractions. 〈〉 are the Macaulay brackets, emphasizing that a purely compressive stress state does not initiate damage. After the mixed-mode cohesive strength is attained (tm0) by the fulfilment of Eq. (1), the material stiffness is degraded. Complete separation is normally predicted by a linear power law form of the required energies for failure in the pure modes by considering the power law exponent α=1 [33]4Results4.1GIC and GIIC calculation by the DCB and ENF tests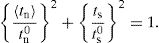
For both the DCB and ENF specimens, the resulting P–δ curves for each adhesive overall showed a good agreement between specimens bonded with each adhesive. Failure was progressive and with a smooth drop of P during damage growth. The experimental R-curves, which plot the evolution of GI or GII with a, showed crack growth at an approximate constant value of GI or GII. These steady-state values are then regarded as GIC and GIIC, respectively [34]. The following average values and deviation were found: GIC=0.140±0.012N/mm (DCB) and GIIC=0.352±0.037N/mm (ENF). The agreement between specimens of the same adhesive is good for both DCB and ENF results.
4.2GI and GII calculation by the SLB testsFig. 3 shows the P–δ curves in the SLB test configuration. The curves revealed a high consistency and low scatter between specimens, considering the elastic stiffness, with the exception of a single specimen bonded with the Araldite® AV138, which had a lower stiffness because of a higher a0 value. Some Araldite® AV138 specimens had an unstable crack growth, which is indicative that this adhesive is affected by the presence of defects [24]. The six data reduction methods described in Section 2.3, five of which depend on a measurements, were applied to the experimental data. Fig. 4 presents the degree of agreement between the 6 data reduction methods for GI and GII measurement, respectively.

 and shear (b) experimental R-curves for an SLB specimen.")
The CBBM curves are always offset to the right compared to the other curves because of considering aeq instead of a, which accounts for the plastic region ahead of the crack tip. In the shear R-curves, models 1 and 2 are overlapped. It could be concluded that all 6 data reduction methods for GI give comparable results. On the other hand, the GII results show that the curve for model 4 is offset by excess to the other methods (by 24.1% compared to the CBBM). To estimate the GI and GII values at propagation for each adhesive and model, only the constant propagation region was considered. Actually, it is known that, when the FPZ of the adhesive reaches the loading cylinder, the toughness values artificially increase due to the compression effects of the applied loading [21]. The GI and GII measurements are presented in Fig. 5.

The standard deviation of each experimental point is acceptable in view of experimental scatter. It is also confirmed that model 4 deviates from the other models by predicting close values between GI and GII, which does not represent the real behaviour of the adhesive.
4.3Fracture envelopeThe fracture envelopes are presented in Fig. 6, constructed from the pure mode tests, whose values situate in the horizontal and vertical axes of the figures, and from the mixed-mode results of the SLB tests. In all cases, the CBBM data was used.

Fig. 6 represents 4 theoretical fracture envelopes by applying the energetic criterion of Eq. (2), considering α=1/2, 1, 3/2 and 2, to frame the behaviour of each adhesive in the most suitable criterion. First of all, it can be noticed that the experimental data points present a small scatter, which reinforces the robustness of the experimental tests (5.2% and 5.9% for GI and GII, respectively). The energetic propagation criterion with α=1/2 provides a good match to this adhesive's behaviour.
4.4Numerical evaluation of the methodsThe numerical simulations by CZM aimed at validating the energetic propagation criteria formerly acquired in the experimental work and obtaining CZM laws and respective mixed-mode criteria that can subsequently be used for the strength prediction of bonded joints. With this purpose, individual numerical models were built for each SLB specimen, considering the measured dimensions of the adherends and a0. The tensile and shear CZM laws were constructed from the values of tensile and shear strengths of the adhesive (Table 1) as approximations of tn0 and ts0, respectively, the average values of GIC and GIIC presented in Section 4.1, and using the aforementioned most suited α parameter. The six data reduction methods were individually applied to the numerical P–δ curves of each specimen of each adhesive type. The agreement between models is similar to that observed in the experimental results: good correspondence between models requiring measurement of a and the CBBM, except in GII by using model 4. Compared to the experimental R-curves, less GI and GII variations were found during crack growth due to considering numerical results, which are not affected by typically experimental issues.
After having analyzed the numerical data for all specimens, the respective GI/GII data points obtained by the CBBM were plotted against the four idealized fracture envelopes, as depicted in Fig. 7. Comparing to the experimental data points of Fig. 6, a clear difference is visible in scatter, which is linked to the aforementioned absence of experimental effects. Moreover, the observed behaviour was consistent with the selected exponent. Although it is not presented here, apart from model 4, which gives offset GII values, the models other than the CBBM also replicate with accuracy the expected mixed-mode behaviour of the joints. Further validation of the obtained α was undertaken by comparing the experimental P–δ curves of the SLB tests with the respective numerical predictions, considering the different idealized α for the energetic propagation criterion. Fig. 8 shows one example for a single specimen of this comparison, showing that, in agreement with all specimens, α=0.5 provides a good reproduction of the experimental results. On the other hand, the other α values overshoot the experimental curve.


In general and in view of these results, it can be concluded that the selected crack growth criteria and α exponent can be successfully applied to the mixed-mode strength prediction by FEM/CZM in bonded joints with arbitrary geometry and loading.
5ConclusionsExperimentally, a fair agreement was found in the R-curves between specimens, reinforced by the low observed scatter, which showed the repeatability of the tests. For GI, all the data reduction schemes shows comparable results, while for GII model 4 over predicted the values of the other models. The resulting experimental mixed-mode data was plotted against fracture envelopes considering different α parameters in the mixed-mode damage growth power law. It was found that the Araldite® AV138 was best fitted by a power law with exponent of 1/2. The experimental tests were numerically replicated by a FEM/CZM approach to validate the obtained damage growth criteria for each adhesive, and the same tendency between data reduction models was found (i.e., offset of model 4 in shear), while the R-curves revealed high stability during crack growth. The numerical fracture envelopes confirmed the suitability of the proposed power law exponent. As a result of this work, the most suited mixed-mode damage criterion was established for subsequent strength prediction and design of bonded joints under generic geometry and mixed-mode loading conditions.