


Vascular dementia (DV) is the second cause of dementia with 15.8-20% of cases. Previous studies of the effect of occupation in DV do not show conclusive results, therefore, the objective was to analyze if the type of occupation can vary the risk of developing DV in those older than 55 years.
Material and methodsIn the ZARADEMP project, a community sample of 4,803 individuals were followed longitudinally in four waves. The occupation was classified following the National Classification of Occupations (CNO-11) and the International Standard Classification of Occupations (ISCO-08). Different standardized instruments were used: the medical and psychiatric histories (History and Aetiology Schedule) and other risk factors (Mini-Mental Status Examination, Geriatric Mental State-AGECAT). For this study, we calculated incidence rates, incidence rate ratios and hazard ratios in multivariate Cox regression models, stratified by gender. For this study, we included 3,883 participants.
ResultsIn women, the risk of DV was doubled in Blue-collar workers, with a moderate effect (Cohen’s d=0.54) and multiplying by 2.7 in Homeworks respect to White Collar with a moderate effect (Cohen's d=0.77), although they did not reach statistical significance. We did not observe the effect of occupation on the risk of DV in men.
ConclusionsWe have found a moderate but non-significant effect between occupation and DV risk in women. We found no effect of occupation on the risk of VD in males while other clinical factors (age, diabetes or body mass index) presented a clearer effect than the occupation.
La demencia vascular (DV) representa la segunda causa de demencia con el 15,8–20% de los casos. Dado que los estudios previos del efecto de la ocupación en DV no muestran resultados concluyentes, nuestro objetivo fue analizar si el tipo de ocupación varía el riesgo de desarrollar DV en mayores de 55 años.
Material y métodosEl proyecto ZARADEMP evaluó inicialmente una muestra comunitaria de 4.803 individuos seguidos durante cuatro olas. La ocupación se clasificó siguiendo la Clasificación Nacional de Ocupaciones (CNO-11) y la Clasificación Internacional Uniforme de Ocupaciones (CIUO-08). Se utilizaron diferentes instrumentos estandarizados: las historias médicas y psiquiátricas (History and Aetiology Schedule) y otros factores de riesgo: (Mini-Mental Status Examination, Geriatric Mental State-AGECAT). Para este estudio, se calcularon tasas de incidencia, razón de tasas de incidencia y hazard ratio en modelos multivariados de regresión de Cox, estratificados por género. Para este estudio han sido incluidos 3.883 participantes.
ResultadosEn mujeres, el riesgo de DV se duplicó en trabajadoras de Cuello azul, con un efecto moderado (d de Cohen=0,54), y se multiplicó por 2,7 en Labores del hogar respecto a Cuello blanco, con un efecto moderado (d de Cohen=0,77), aunque sin significación estadística. No observamos efecto de la ocupación en el riesgo de DV en varones.
ConclusionesHemos encontrado un efecto moderado, pero no significativo, entre la ocupación y el riesgo de DV en mujeres. No hallamos efecto de la ocupación en el riesgo de DV en varones donde otros factores de riesgo (edad, diabetes o el índice de masa corporal) tienen un efecto más claro que la ocupación laboral.
Vascular dementia (VD) is a major public health problem, as it is estimated to account for from 15.8% to 20% of all dementia cases,1,2 with rates similar to those for Alzheimer’s disease in individuals over the age of 85 years.3 Nevertheless, calculating the rates of VD is hindered by variations in diagnostic criteria.4
Some studies which analysed possible risk factors for VD found an important increase in prevalence with advancing age.5,6 About 3.9 million cases of Alzheimer’s disease and VD in Europe may be due to potentially modifiable risk factors,7 so that identifying these factors and establishing preventive actions could achieve a significant fall in the number of cases. These studies also confirm that there is a relationship between VD and diabetes, heart disease, obesity, metabolic syndromes and hypertension. Of the modifiable risk factors, physical factors have a protective effect on cognitive functioning and an indirect effect on VD, preventing certain important causes of the same, such as cardiovascular diseases.8,9
Although an individual’s job is an important factor in association with their physical condition throughout their life, few studies have examined the influence of occupation on the risk of VD, and their results are not conclusive.10–14 On the one hand, Kröger et al.10 show that highly complex occupations involving the management of people or objects may reduce the risk of VD, while highly complex occupations involving data processing (such as office jobs and administrative work) may increase this risk. On the other hand, Andel et al.11 conclude that less skilled work, less social support and more stress in work are all associated with a higher risk of VD.
The study by Mortel et al.12 concludes that a lower educational level and occupations that do not involve management or leadership skills are risk factors for VD, especially among women with little education; on the contrary, Ravaglia et al.13 show that education rather than occupation is associated with VD. Helmer et al.14 find a tendency towards a higher risk of VD in agricultural workers (RR 1.56; 95% CI 0.82–2.97), even after adjusting for educational level and vascular risk factors.
To conclude, the current state of knowledge on the relationship between VD and occupation is based on cross-sectional studies with results that disagree,11–13 and only 2 longitudinal studies10,14 with generalized results that are not stratified according to sex. Longitudinal studies are therefore necessary, to help predict the appearance of VD and show differentiated analyses according to sex.
We therefore aim to use multivariate survival analysis to examine whether the type of main occupation over life is associated with the risk of developing VD in our community of men and women over the age of 55 years and followed up during 12 years.
Subjects and methodsGeneral design and study populationThe details of this project have already been extensively described in previous publications.15 Briefly, the sample for this study was extracted from the ZARAgoza DEMencia y DEPresión (ZARADEMP) project.16 This is a 4-wave longitudinal epidemiological study carried out in Zaragoza, Spain, and it was designed to study the incidence of dementia and its risk factors as well as its chief subtypes and depression in the adult population over the age of 55 years. To this end a random sample of individuals living in the community was extracted from the lists of the official 1991 census, stratified with a proportional assignation according to their age and sex. The sample size was calculated to study risk factors for cases of dementia, the chief aim of the project, taking into account data on withdrawal from a previous study.15 In the cross-sectional study the rejection rate was 20.5%, and eventually 4,803 individuals were interviewed at the start of the study (Wave I, 1994). Strict criteria were applied to ensure that only cognitively healthy individuals were included in the cohort to be followed-up. Those with dementia of any type or cognitive deterioration at the start of the study, according to Geriatric Mental State-Automated Geriatric Examination for Computer Assisted Taxonomy package criteria,17 were excluded from follow-up examinations (Wave II, 1997; Wave III, 1999; Wave IV, 2006). Those individuals who lacked data on their previous occupations were also excluded, leaving a final sample of 3,883 for this study.
The ZARADEMP always followed Helsinki Declaration principles for written informed consent, privacy and confidentiality. Zaragoza University Ethics Committee and the Medical Research Fund approved the project according to Spanish law, and all of the participants gave their informed consent in writing.
Data recordingProcedureThroughout the entire project (in the cross-sectional study or Wave I, as well as in the longitudinal study during waves ii, iii and iv) a 2-phase case detection design was applied. In phase i of each Wave well-trained and regularly supervised interviewers administered the ZARADEMP interview in the subject’s home, requiring the present of carers when the interviewee was considered to be unreliable. The ZARADEMP interview includes standardized versions in Spanish of the following instruments: Mini-Mental State Examination (MMSE)18 to evaluate cognitive function; the Geriatric Mental State-Automated Geriatric Examination for Computer Assisted Taxonomy,17 a standardized semi-structured clinical interview which can be used by untrained interviewers to evaluate the mental state of participants, using a computer to group and analyse Geriatric Mental State items and generating a main diagnosis and, when applicable, an alternative diagnosis; the History and Aetiology Schedule19 to evaluate medical and psychiatric history. A series of standardized questions were also used for information in connection with the subject’s medical and psychiatric history, according to the EURODEM Risk Factors Questionnaire.20 Each item in the ZARADEMP interview was defined operationally according to previously agreed EURODEM criteria.
Dementia case detectionThis methodology has already been shown to be valid.15 All of the individuals who were classified in phase i as “probable cases” of dementia based on the scores obtained in evaluation instruments were re-evaluated in phase ii by a trained psychiatric researcher. The same procedure was followed in waves ii, iii and iv. The ZARADEMP interview variables were used to comply with the DSM-IV criteria employed in case diagnosis. The Hachinski Scale21 was used to diagnose VD, and a neurological examination was used in the diagnostic process to differentiate Alzheimer’s disease from other causes of dementia such as VD. Dementia cases identified in phase ii were presented to a panel of 4 psychiatric researchers. To diagnose “incident cases” of dementia at least 3 of the 4 psychiatrists in the panel had to agree. To document the exactitude of the diagnosis of dementia by the panel, all of the cases and a proportion of non-cases were invited to undertake a hospital-based diagnostic study, including neuroimaging studies and a complete neuropsychological diagnostic battery.
OccupationOccupation was defined as the main activity undertaken by subjects during their lives. The ZARADEMP interview recorded occupational data and classified them into 18 groups (Appendix B, Annex 1). For subsequent codification the National Classification of Occupations (CNO-11) was used, as well as the International Standard Classification of Occupations, using their updated 2011 and 2008 versions, respectively, enabling their comparison with other national and international studies (Appendix B, Annex 2). Taking the Toledo Study on Healthy Aging22 as the model, as it has comparable characteristics to those of the ZARADEMP study as well as its geographical proximity, occupations were grouped into 4 categories: white collar, blue collar, housework and agriculture. In this way, groups 1 to 5 of the CNO-11 were grouped under the white-collar heading, except for protection services. The blue-collar category included groups 7 (artisans and skilled workers in the manufacturing and construction industries), 8 (installation and machinery operatives, as well as fitters), part of group 9 (mining, construction, manufacturing and transport labourers; urban dustmen, street sellers and other basic service industry occupations), including protection and military services. The housework category corresponds to part of group 9 (domestic employees and other cleaning personnel; food preparation assistants) (interview codes 01 and 10). Finally, the agricultural workers category included group 6 of CNO-11 and group 04 of the interview, included within the elemental occupations of CNO-11 (Appendix B, Annex 3).
Co-variablesThe potential confusion factors evaluated at the start of the study included sociodemographic characteristics (educational level and family), clinical risk factors (vascular disease, hypertension, diabetes and body mass index [BMI], psychiatric disorder [depression] and cognitive performance [MMSE score]). Educational level was classified into 3 categories: illiterate (unable to read and write, and <2 years’ education), primary (complete or incomplete) and secondary or higher. For regression analysis the subjects were re-grouped into those who had been educated versus those who were uneducated or illiterate. The Automated Geriatric Examination for Computer Assisted Taxonomy was used to diagnose anxiety and depression. Blood pressure was measured by taking the average of 2 readings during the interview using a standard manual blood pressure gauge; hypertension was defined as blood pressure >140/99mmHg or if the participant reported having received treatment for hypertension. The presence of vascular risk factors and diabetes was determined by the clinical history obtained using the EURODEM20 risk factors questionnaire. Subjects were classified as either having vascular disease (angina pectoris and/or myocardial infarction and/or cerebrovascular accident) or without a history of vascular disease. For diabetes they were classified as either having been diagnosed or receiving treatment for diabetes, or with no diabetes. Their BMI was calculated using their weight in kilogrammes divided by their height in square metres, and it was classified as normal weight (18.5–24.9kg/m2), overweight (25.0–29.9kg/m2) or obesity (≥30.0kg/m2). A new variable was created to group vascular risk factors, dividing the subjects into those with no diabetes, hypertension or obesity, and those with at least one of the 3 factors.
Statistical analysisAccording to occupational status the differences between basal characteristics were evaluated using the two tailed Chi squared test for categorical data, and differences in variables with approximately normal distributions were evaluated using the ANOVA test.
Due to the characteristics of the occupations and their different distribution in each sex, we performed all of the analyses while stratifying according to sex. We use multivariate survival analysis with follow-up time in years to study the specific hypothesis that occupation is associated with the risk of VD. In a first step we construct the Kaplan-Meier survival curves with the groups of occupations to compare the probability of VD-free survival. Survival probability functions in all of the groups were evaluated using the Tarone-Ware test. Subsequently, to estimate the effect of basal predictors according to survival, we used Cox’s proportional risks regression model. To examine the mechanisms which explain the association we use 3 models in which we gradually control the possible confusion/modifying factors. Model 1 only included the occupation categories. Model 2 included the terms of model 1 plus age and educational level (with or without education), as these risk factors had been found to be significant in previous studies of VD. As well as the variables used in model 2, model 3 included vascular risk factors in a dichotomic variable, differentiating between those who had no obesity, hypertension or diabetes, and those who had at least one of these factors.
The interactions between the co-variables and occupational status were evaluated prior to calculating the multivariable regression models, and none of them was found to attain statistical significance.
Cohen’s d was calculated to document the differences in the risk of VD between occupational groups. This coefficient measures the magnitude of an effect and it may be especially relevant in small samples, when the associations found do not attain statistical significance. The size of the effect for the hazard ratio (HR) was classified as small (0.2), moderate (0.5) or large (0.8).23
Statistical analysis was performed using v. 19 of the IBM SPSS (IBM Corp. 2010, New York, NY, U.S.A.) for Windows.
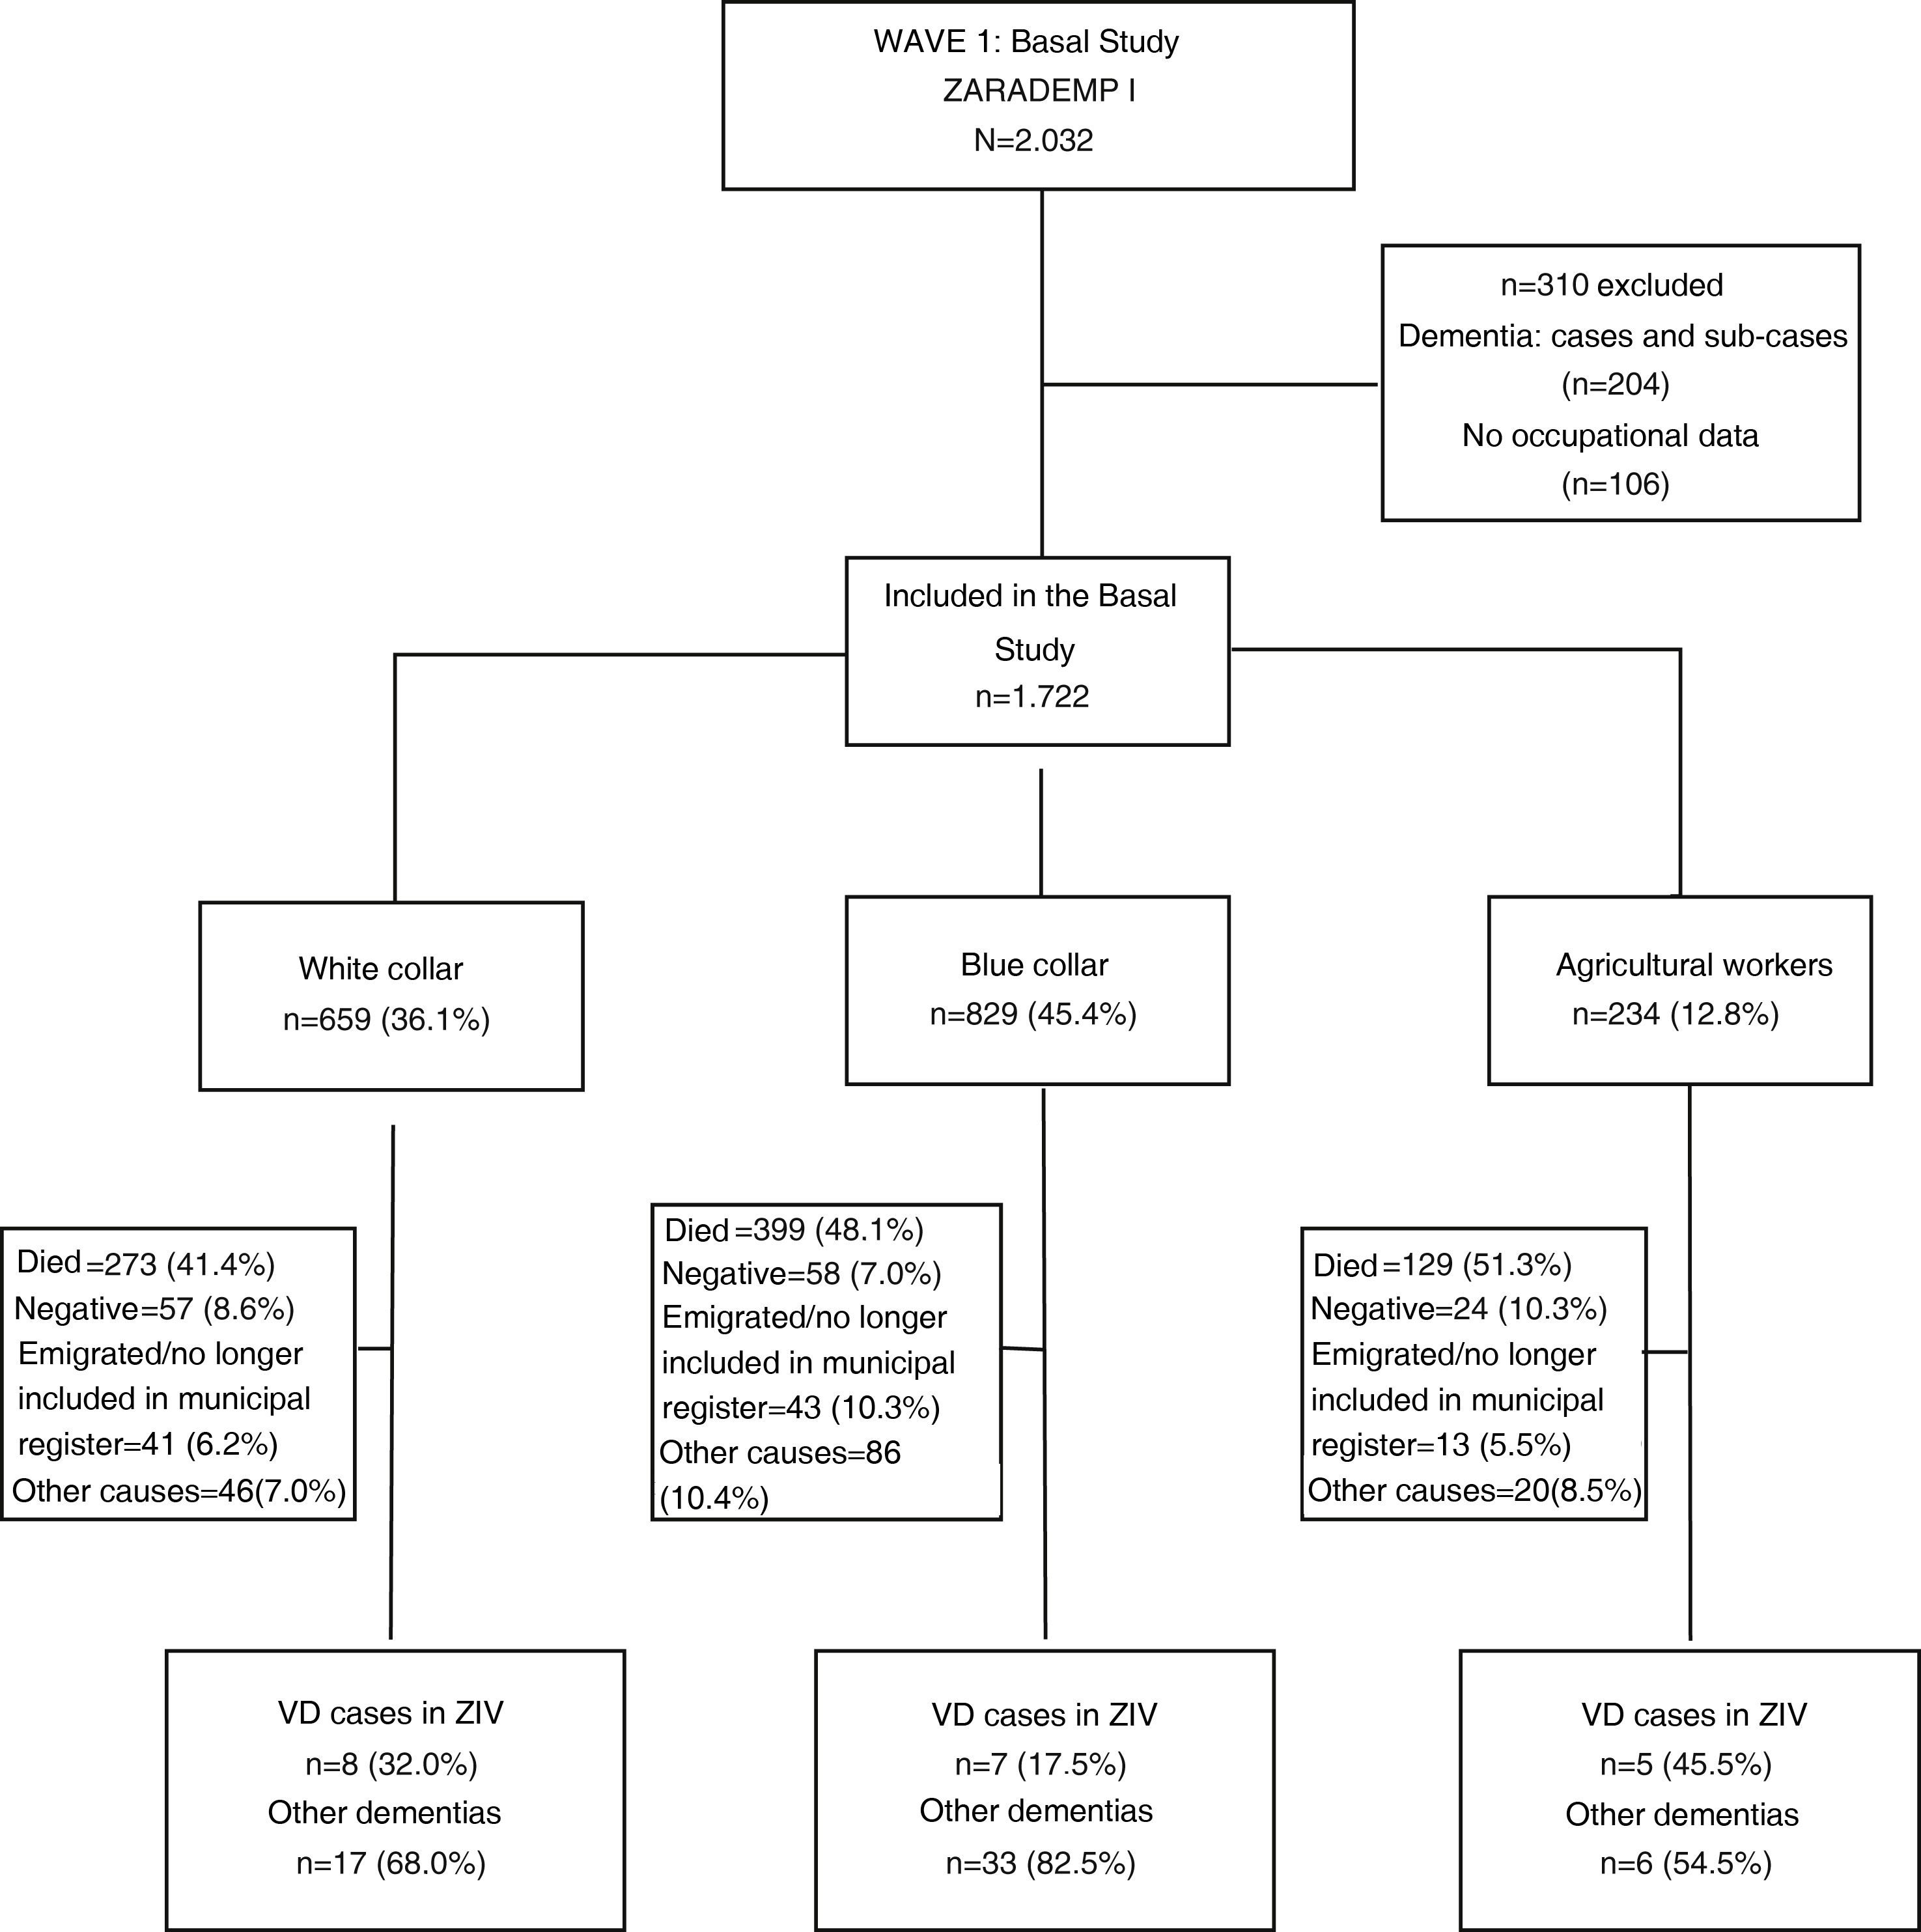
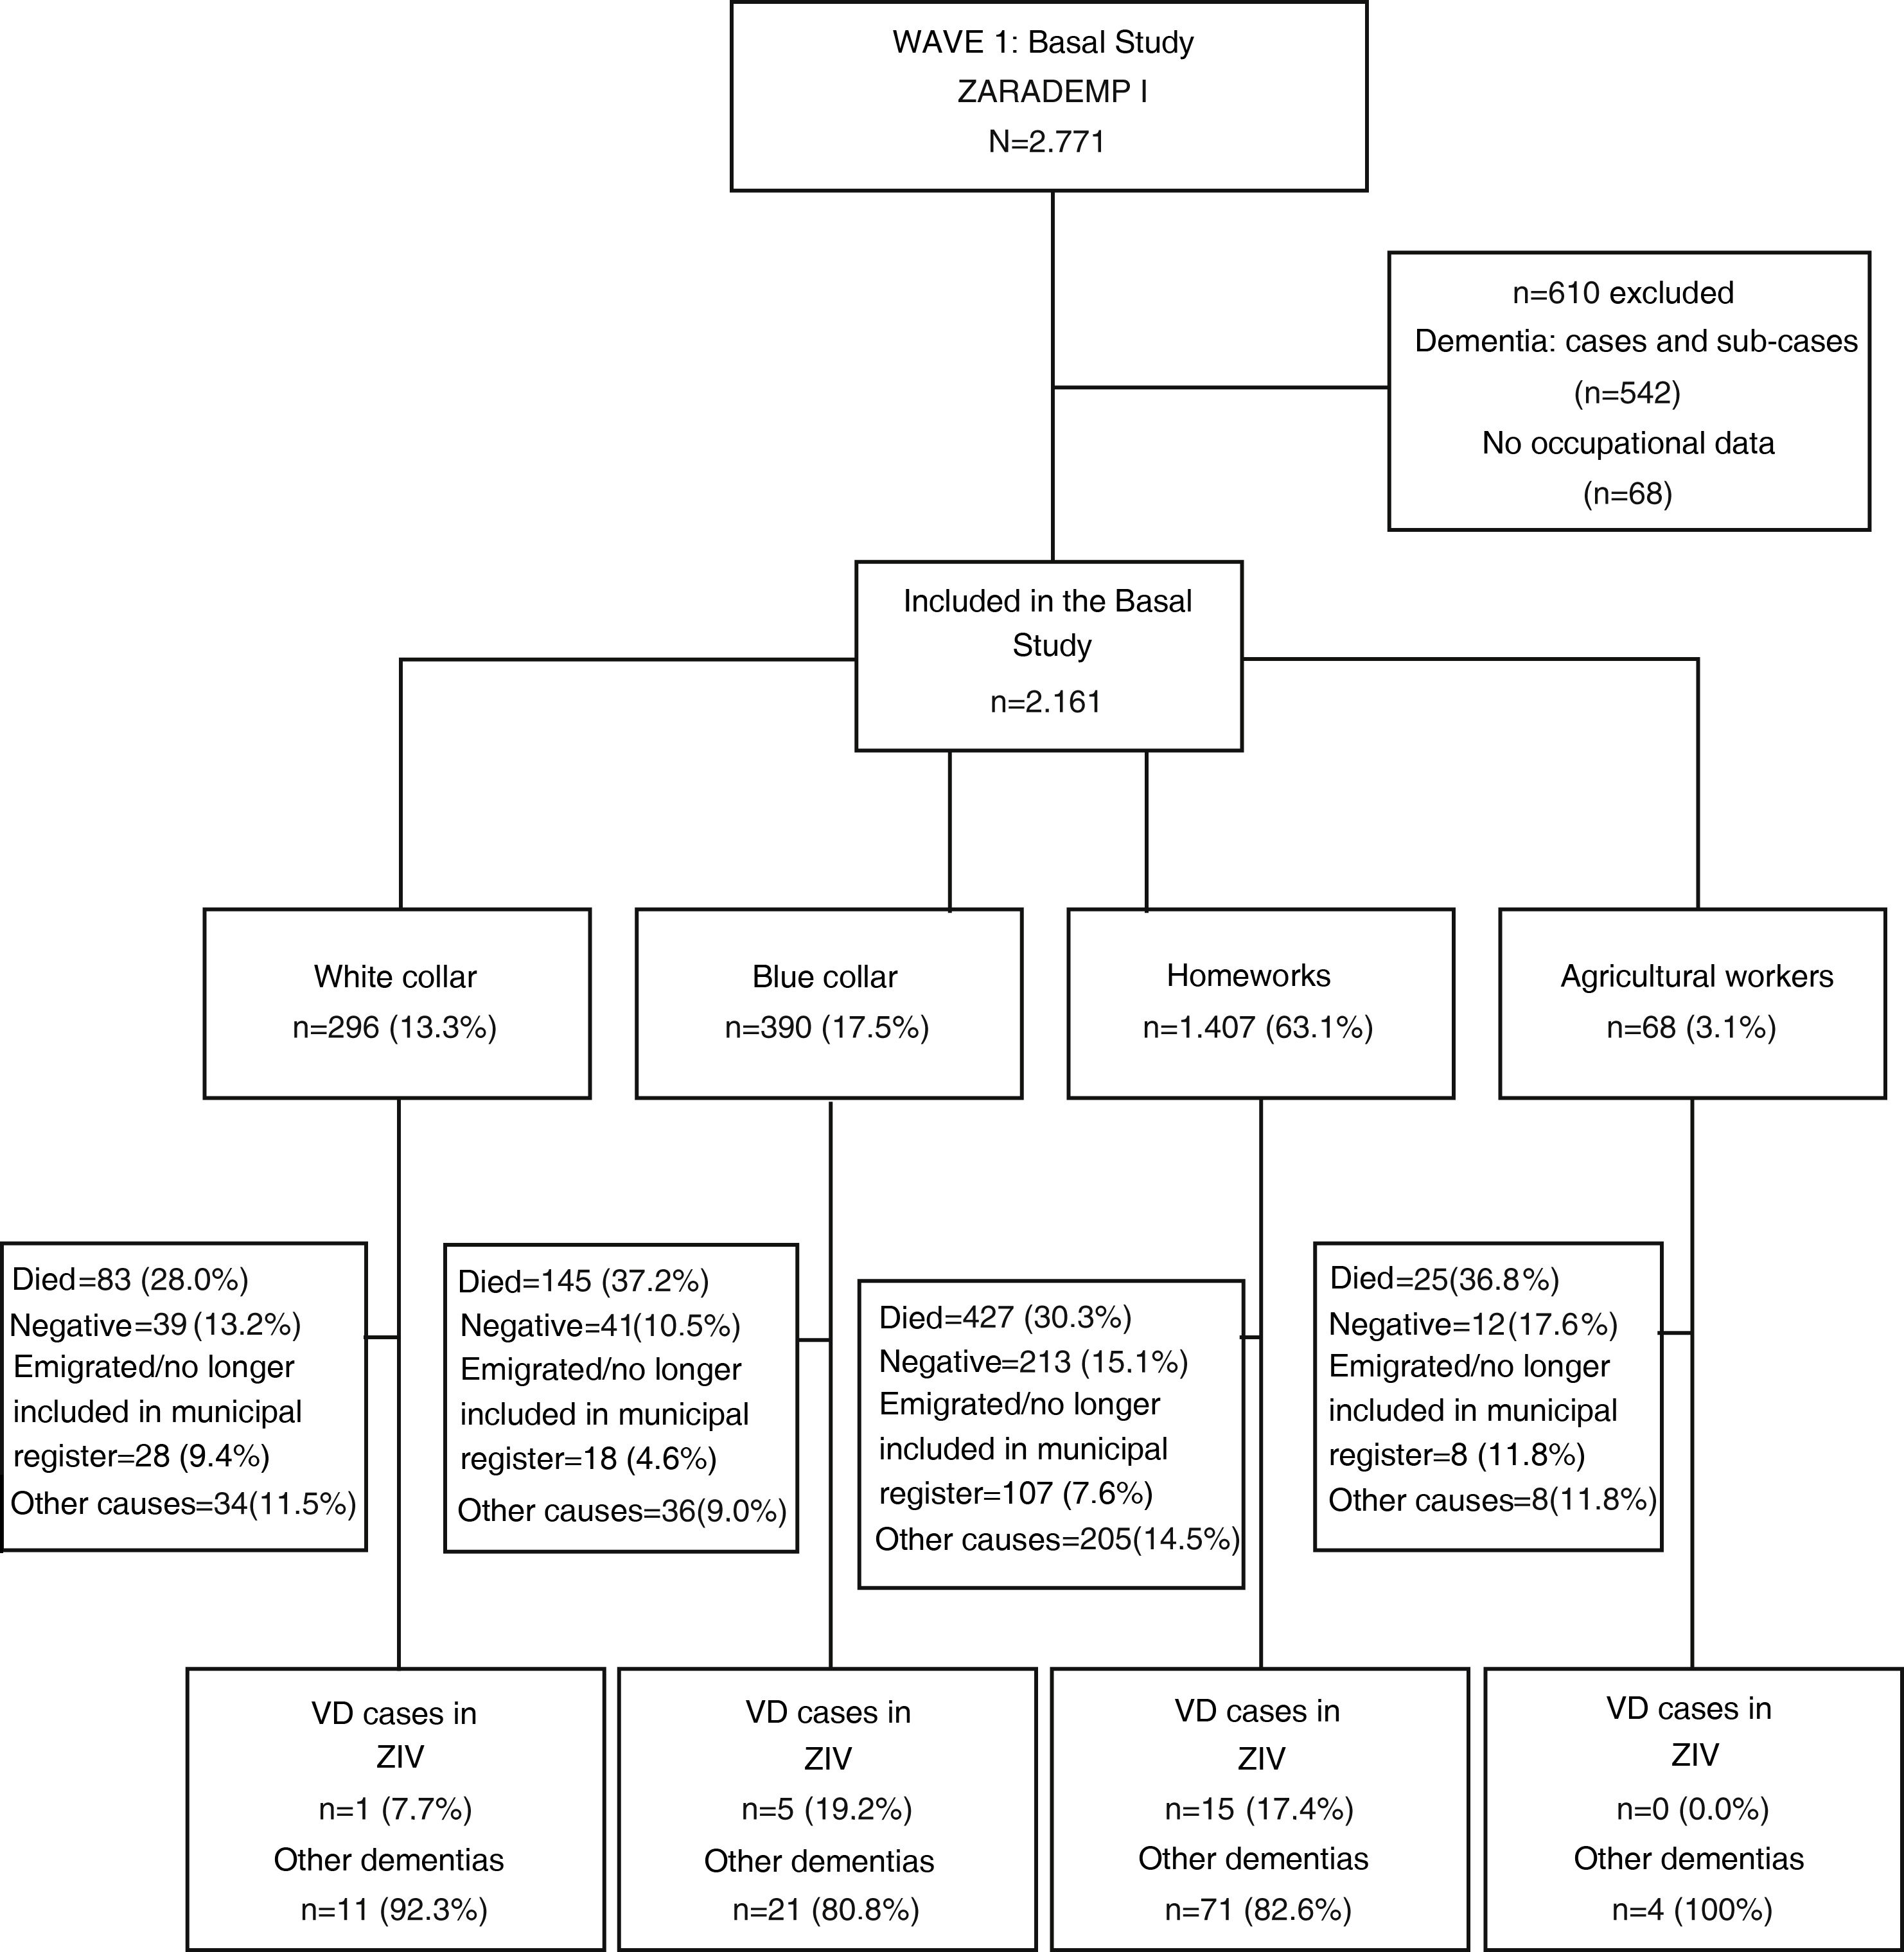
ResultsSample characteristics1,722 (44.3%) of the 3,883 subjects included at the start of the study were men. 659 (36.1%) of them were classified as white collar, 829 (45.4%) were classified as blue collar and 234 (12.8%) were classified as agricultural workers (Fig. 1). None of the men were classified within the occupation category housework. Of the 2,161 women included in the study, 296 (13.3%) were classified as white collar, 390 (17.5%) as blue collar, 1,407 (63.1%) as housework and 68 (3.1%) as agricultural workers. No cases of VD were found in any of the latter group of women, so they were eliminated from subsequent analyses (Fig. 2).
.")
.")
Table 1 shows the sociodemographic and clinical characteristics of the subjects studied according to their main occupation and differentiating them according to sex. The average age of the men at the start of the study was the greatest in the category of agricultural workers (75.6±9.3), while it was similar in the other 2 groups analysed, with an average age of 71.3±9.1 years for white collar workers and 71.4±8.9) for blue collar ones. A higher proportion of illiterate men was found in the latter category (13.0%), with lower proportion of subjects with diabetes (8.2%) and lower average scores in the MMSE (26.3±3.7). The average age of the women in white collar occupations was lower (70.6±8.9). Regarding the potential risk factors for VD, lower proportions of women with diabetes were found (8.1%), together with vascular disease (2.1%) and hypertension (65.5%), as well as higher average scores in the MMSE (28.2±1.7). The lowest percentage of women who lived alone was found among those who were chiefly occupied with housework.
Basal characteristics of the subjects according to occupation and sex.
| Men | Women | |||||||
|---|---|---|---|---|---|---|---|---|
| Occupational categories | Occupational categories | |||||||
| White collar (n=659) | Blue collar (n=829) | Agricultural workers (n=234) | p | White collar (n=296) | Blue collar (n=390) | Housework (n=1.407) | P | |
| Initial age, average±SD | 71.3±9.1 | 71.4±8.9 | 75.6±9.3 | <.001 | 70.6±8.9 | 72.7±9.1 | 72.3±9.2 | <.001 |
| Educational level, n (%) | <.001 | <.001 | ||||||
| Illiterate | 8 (1.2) | 58 (7.1) | 30 (13.0) | 10 (3.4) | 32 (8.2) | 152 (10.9) | ||
| Primary education | 357 (54.8) | 682 (83.1) | 193 (83.5) | 160 (54.2) | 332 (85.3) | 1.135 (81.3) | ||
| Secondary education or higher | 287 (44.0) | 81 (9.9) | 8 (3.5) | 125 (42.4) | 25 (6.4) | 109 (7.8) | ||
| Lives alone, n (%) | 65 (9.9) | 73 (8.8) | 15 (6.4) | .279 | 84 (28.4) | 110 (28.2) | 312 (22.2) | .023 |
| Depression (AGECAT), n (%) | 28 (4.2) | 46 (5.5) | 14 (6.0) | .426 | 45 (15.2) | 79 (20.3) | 222 (15.8) | .111 |
| Diabetes, n (%) | 79 (12.1) | 122 (14.9) | 19 (8.2) | .019 | 24 (8.1) | 45 (11.6) | 194 (13.9) | .046 |
| Vascular disease, n (%) | 38 (6.1) | 67 (8.5) | 18 (8.1) | .220 | 6 (2.1) | 23 (6.2) | 39 (2.9) | .008 |
| Hypertension, n (%) | 418 (63.6) | 548 (66.3) | 152 (65.0) | .550 | 194 (65.5) | 284 (72.8) | 998 (70.9) | .131 |
| BMI, n (%) | .156 | .001 | ||||||
| Normal weight | 233 (35.5) | 252 (30.4) | 69 (29.5) | 116 (39.2) | 103 (26.5) | 403 (28.7) | ||
| Overweight | 352 (53.6) | 462 (55.7) | 135 (57.7) | 146 (49.3) | 217 (55.8) | 743 (52.9) | ||
| Obesity | 72 (11.0) | 115 (13.9) | 30 (12.8) | 34 (11.5) | 69 (17.7) | 258 (18.4) | ||
| MMSE, average ±SD | 28.1±2.4 | 27.3±2.4 | 26.3±3.7 | <.001 | 28.2±1.7 | 26.9±2.4 | 26.8±32.5 | <.001 |
SD: Standard Deviation; BMI: Body Mass Index; MMSE: Mini-Mental State Examination.
Statistically significant data are shown in bold type.
41 cases of VD were detected during the 12-year follow-up, 20 in men and 21 in women (Table 2). The highest proportion of VD cases occurred in men with agricultural occupations, while the blue-collar women had the highest proportion of VD cases (Table 2). Thus, in comparison with the white-collar group, the rate of incidence doubled in the male agricultural workers and multiplied by 2 and 4 for women occupied in housework and those in blue collar jobs, respectively. Nevertheless, none of these differences attained statistical significance.
Cases and rate of incidence of vascular dementia according to occupational category.
| Men | |||||
|---|---|---|---|---|---|
| Cases of VD, n (%) | Individuals-year | Rate of incidence (95% CI) | RTI (95% CI) | P | |
| White collar (n=659) | 8 (1.2) | 5.069.24 | 1.58 (0.68–3.11) | ||
| Blue collar (n=829) | 7 (0.8) | 5.907.65 | 1.18 (0.48–2.44) | .75 (.27–2.07) | .580 |
| Agricultural workers (n=234) | 5 (2.1) | 1.519.49 | 3.29 (1.07–7.68) | 2.09 (.68–6.37) | .197 |
| Women | |||||
|---|---|---|---|---|---|
| Cases of VD, n (%) | Individuals-year | Rate of incidence (95% CI) | RTI (95% CI) | P | |
| White collar (n=296) | 1 (.3) | 2.468.32 | .41 (.01–2.26) | ||
| Blue collar (n=390) | 5 (1.3) | 3.103.44 | 1.61 (.52–3.76) | 3.98 (.46–34.04) | .208 |
| Housework (n=1.407) | 15 (1.1) | 10.562.16 | .96 (.54–1.59) | 3.51 (.46–26.54) | .225 |
VD: Vascular dementia; 95% CI: 95% Confidence Interval; RTI: Incidence Rates Ratio.
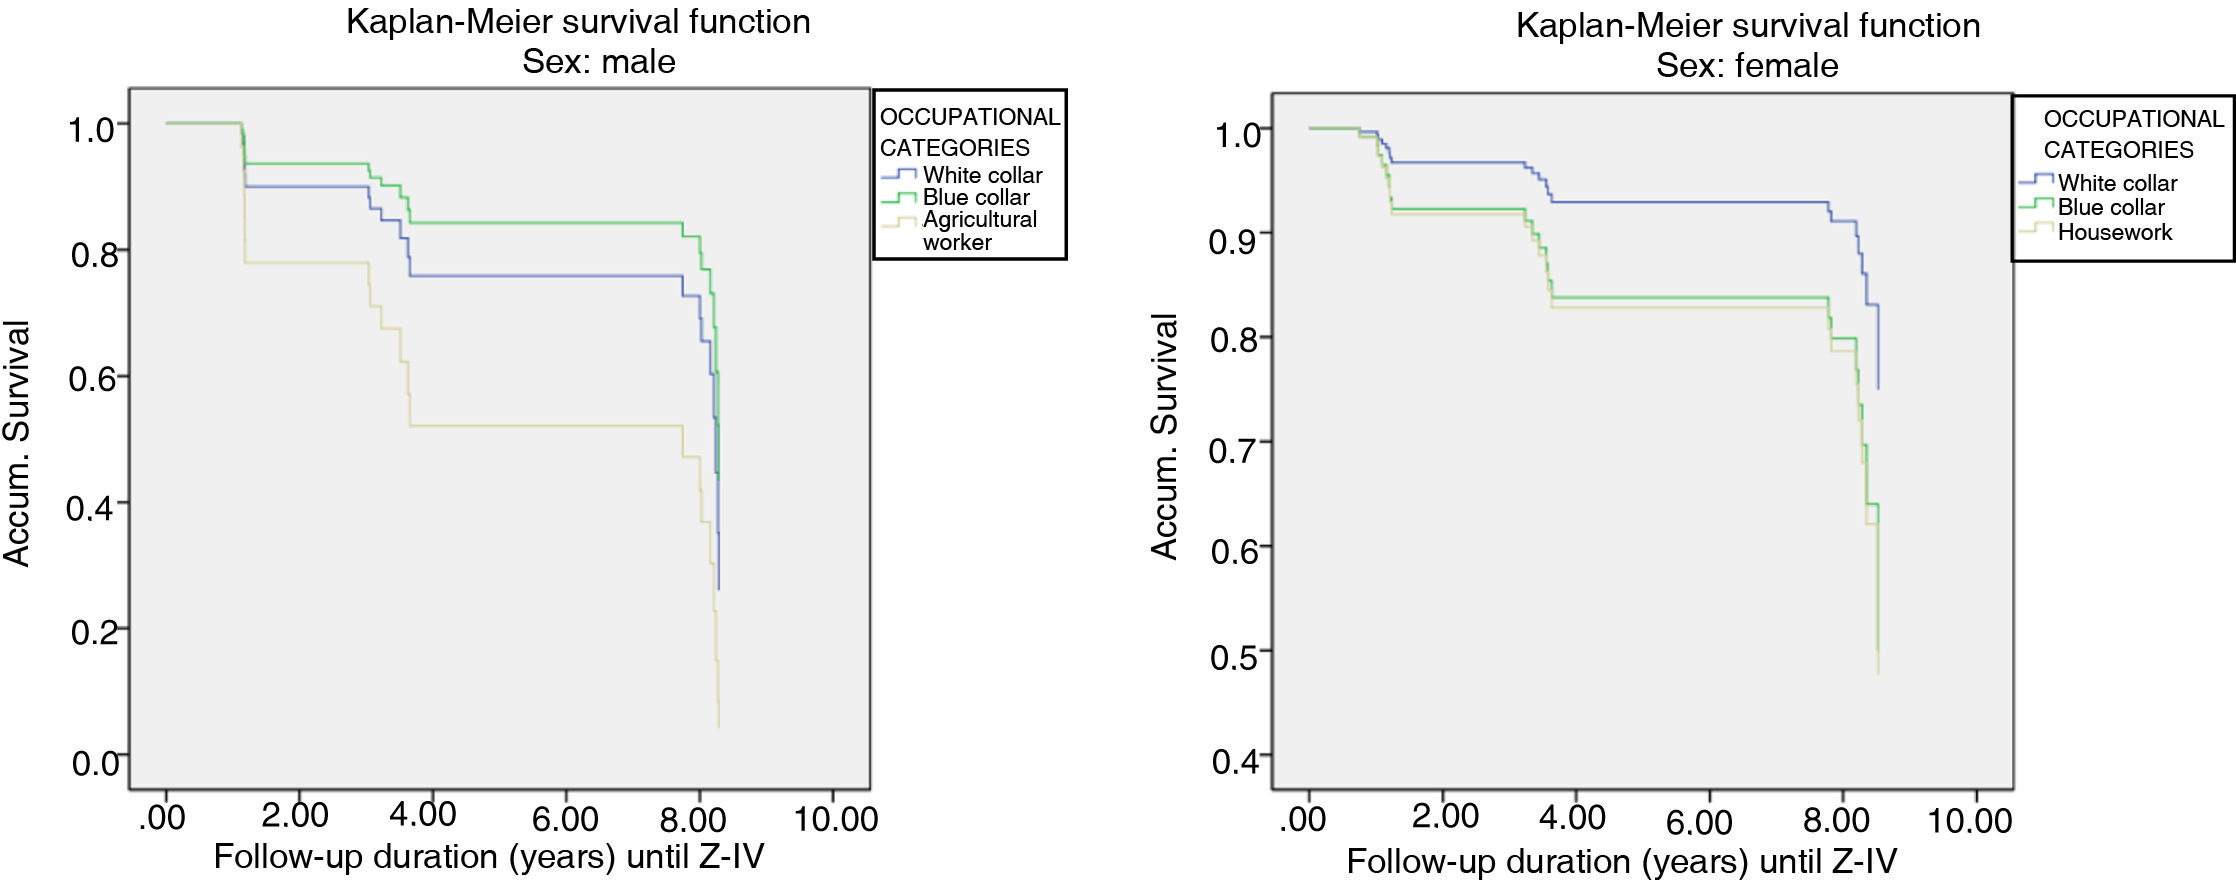
Fig. 3 shows the VD survival curves according to the occupational categories. The blue-collar men show the most favourable survival in case of VD, and this difference is marginally significant (Chi2=5.03, P=.081). In the women the white-collar workers were the most likely to survive VD, although this did not attain statistical significance (Chi2=1.10, P=.578).
.")
Table 3 shows the results of Cox regression analysis for the risk of VD associated with type of occupation, differentiating between men and women.
Prediction of vascular dementia cases stratified according to sex.
| 1st Modela | 2nd Modelb | 3rd Modelc | ||||
|---|---|---|---|---|---|---|
| HR (95% CI) | P | HR (95% CI) | P | HR (95% CI) | P | |
| Men | ||||||
| Occupational categories | ||||||
| White collar (n=659) | 1 | – | 1 | – | 1 | – |
| Blue collar (n=829) | .62 (.22–1.72) | .358 | .99 (.33–3.00) | .992 | .61 (.20–1.89) | .393 |
| Agricultural workers (n=234) | 2.36 (.72–7.73) | .156 | 1.45 (.41–5.18) | .564 | .72 (.18–2.83) | .636 |
| Age | 1.10 (1.02–1.19) | .020 | 1.11 (1.02–1.20) | .012 | ||
| Illiteracy (n=96) | 1.08 (.13–9.24) | .941 | .56 (.06–5.20) | .612 | ||
| Vascular risk factors (n=1.259) | 3.93 (1.12–13.76) | .032 | ||||
| Women | ||||||
| Occupational categories | ||||||
| White collar (n=296) | 1 | – | 1 | – | 1 | – |
| Blue collar (n=390) | 2.41 (0.28–20.63) | .422 | 2.33 (.27–20.28) | .445 | 2.04 (.23–17.94) | .520 |
| Housework (n=1.407) | 2.57 (0.34–19.60) | .361 | 2.77 (.36–21.26) | .326 | 2.67 (.35–20.67) | .346 |
| Age | 1.05 (.98–1.11) | .159 | 1.04 (.98–1.1) | .239 | ||
| Illiteracy (n=194) | .62 (.21–1.88) | .399 | 1.82 (.59–5.58) | .296 | ||
| Vascular risk factors (n=1.598) | 2.09 (.58–7.47) | .258 | ||||
HR: Hazard Ratio; 95% CI: 95% Confidence Interval.
aModel 1: this only includes the main occupation throughout life.
bModel 2: model 1 plus age and educational level (illiteracy).
cModel 3: model 2 plus vascular risk factors (diabetes, obesity and hypertension).
In the men it can be seen in model 2 that agricultural workers attain the highest risk of suffering VD (HR 1.45; 95% CI 0.41–5.18), although this is not statistically significant. However, in model 3, which also includes vascular risk factors, this association is completely lost (HR 0.72; 95% CI 0.18–2.83); and in fact, in model 3 only the vascular risk factors variable (HR 3.93; 95% CI 1.12–13.76; P=.032), together with age, attains statistical significance.
A tendency in the risk of VD was found in the women depending on occupational category. This was doubled in blue-collar workers and multiplied by 2.7 in those whose main occupation was housework compared to those in white collar jobs. Although this effect did was not statistically significant in the multivariate model (at 0.096 for blue collar workers and 0.361 for those whose occupation was housework), the magnitude of the effect in both cases was considered to be moderate for female blue-collar workers (Cohen’s d=0.54) and fairly large for those in housework (Cohen’s d=0.77).
DiscussionOur study detected a moderate but not significant effect for female blue-collar workers (Cohen’s d=0.54) and those in housework (Cohen’s d=0.77), in comparison in both cases with those in white-collar work. We found no association in the men between occupation and VD, while other risk factors (such as age, diabetes or BMI) had a clearer affect than was the case for their occupation.
As the descriptive analysis of the sample shows, there are significant differences between the MMSE scores of the different occupational groups, in the men as well as in the women. Although these low scores may be thought to be associated with the risk of VD, the MMSE had no significant association with the risk of VD in the sample as a whole or when it was stratified according to sex, so that it was not taken into account in the multivariate model.
The results of our study differ from those of the case-control by Mortel et al.12 With occupational categories similar to those used by us, their study found a higher risk of VD in blue collar workers (OR 5.22; 95% CI 2.36–11.54) and white-collar workers (OR 2.99; 95% CI 1.50–5.95) in comparison with management levels. This association was stronger in subjects with a low educational level.12 In a similar way, Ravaglia et al.13 found an association between VD and educational level, with far higher risks of VD in subjects with less than 3 years of schooling (from 0 to one year, with an OR of 12.3; 95% CI 3.2–47.1; from 2 to 3 years, with an OR of 3.7; 95% CI 1.3–10.6). Due to this, although the educational level variable was not found to be significant in our study, we decided to include it in the survival analysis.
The discrepancy with our results may be explained by the higher number of VD cases in our study, in 61 men and 41 women, as opposed to 20 and 21, respectively. Nor can the possibility be ruled out that the different results of these studies may be due to variations in the diagnostic criteria for VD and lack of uniformity in the methods used to evaluate potential risk factors.
The fact that we found no significant associations between occupation and VD may be associated with the lack of any link between educational level and VD in our sample, given that subjects with a higher educational level are more likely to work in white collar jobs than is the case for those who are uneducated.24
The systematic review by Then et al.25 analysed the influence of psychosocial conditions at work on cognitive deterioration and dementia in a selection of 17 publications. It showed that a protective effect emerged against the risk of dementia in highly demanding intellectual activities, those which involve a high level of cognitive stimulation and a heavy mental workload. Nevertheless, of the studies included in this review only the one by Andel et al.11 specifically centred on VD, and it found a significant association between the risk of VD and a lack of control over work (OR 1.17; 95% CI 1.04–131) and a lack of social support (OR 1.15; 95% CI 1.03–1.28).
Regarding cardiovascular risk factors, in our sample of men we found that although agricultural workers were at higher risk of suffering VD (HR 1.45; 95% CI 0.41–5.18), this disappeared when a control for vascular risk factors was applied (HR 0.72; 95% CI 0.18–2.83). This finding is similar to the one described by Helmer et al.,14 as they found a higher risk of VD in agricultural workers (RR 1.90; 95% CI 1.05–3.43). According to these authors, this was explained by the presence of at least one vascular risk factor that was significantly associated with the risk of VD.
It is interesting to find differences in the effect of these risk factors depending on sex. A statistically significant association was found between the incidence of VD and age (HR 1.13; 95% CI 1.03–1.24), diabetes (HR 45.33; 95% CI 3.25–632.50) and obesity (HR 6.32; 95% CI 1.60–25.04) in men but not in women.
The reason for these differences may be found in a recent review26 of vascular risk factors which contribute to cognitive deterioration and dementia, determining their influence according to sex; thus diabetes, obesity in middle age and hypertension increase this risk in women, while cerebrovascular accidents, hyperlipidaemia and heart disease contribute to a higher risk in men.
However, certain limitations must be taken into account when interpreting these results. These include the small number of VD cases, which leads to a lack of power in the statistical analyses, hindering the emergence of significant differences. To overcome this drawback, we report on the Cohen’s d statistic, finding moderate clinical effects for the association between occupation and VD in women. The rejection rate of around 20% from sampling to the start of Wave I is significant. Nevertheless, this rejection rate was foreseen in the design of the study,15,16 and the data on losses and abandonment may be compared with those of similar studies.16 Another limitation of this study is that the data that were gathered initially on occupations do not correspond to the categories used in some of the standardized instruments. It was therefore necessary to make certain changes in the classification of the occupations to improve the comparability of our results, and this may have introduced a distortion in how the subjects were classified. Notwithstanding this, unlike the heterogeneity of the occupations which underlie the design of previous studies, we have compensated for this by coding the occupational categories using standardized instruments such as the CNO-11 or the 2008 International Standard Classification of Occupations, which makes it possible to compare this study with other national and international ones.
To conclude, we found an effect that was moderate but not significant between occupation and the risk of VD in women. Occupation was not associated with the risk of VD in men, and it was more closely associated with the presence of other risk factors such as age, diabetes or a high BMI). Given this discrepancy with previous studies, longitudinal studies designed to determine the actual degree of the relationship between occupation and the risk of VD are necessary. It is also necessary to clarify the role that the sex of subjects plays in this association.
FinancingThis work was supported by grants from the Fondo de Investigación Sanitaria, Instituto de Salud Carlos III, Ministerio de Economía y Competitividad, Madrid, Spain (grants 94/1562, 97/1321E, 98/0103, 01/0255, 03/0815, 06/0617, and G03/128) and the European Regional Development Fund (ERDF) of the European Union and the Government of Aragon (subsidy B15_17R).
Conflict of interestsThe authors have no conflict of interests to declare.
The following is Supplementary data to this article: