


This is the first study that addresses the relationship between 3×2 achievement goals, which are built based on the way of understanding the competence, and the satisfaction of the psychological need for competence in schoolchildren. The sample consists of 263 (133 men and 130 women, M=12.40, SD=.49). Three measurements are taken over two years. Analyzes of structural equations are made using true intraindividual change. The results show the predictive value (transversal and longitudinal) of the six goal orientations on the satisfaction of the need for competence; however, they establish differences depending on definition and valence. These results support the latest advances in achievement goals theory, which offers a more precise definition of goals based exclusively on the perception of competence.
Este es el primer estudio que aborda la relación entre las metas de logro 3×2, que se construyen con base en el modo de entender la competencia, y la satisfacción de la necesidad psicológica de competencia en jóvenes escolares. La muestra está formada por 263 personas (133 varones y 130 mujeres; M=12.40, DT=.49). Se toman tres medidas a lo largo de dos años. Se realizan análisis de ecuaciones estructurales utilizando el verdadero cambio intraindividual. Los resultados muestran el valor predictivo (transversal y longitudinal) de las seis orientaciones de meta sobre la satisfacción de la necesidad de competencia; no obstante, se establecen diferencias en función de la definición y de la valencia. Estos resultados avalan los últimos avances en la teoría de metas de logro, que ofrece una definición más precisa de las metas basada exclusivamente en la percepción de competencia.
Achievement goal theory (AGT) is one of the most widely acknowledged frameworks for studying and explaining academic motivation. In this framework, the individual is perceived as an intentional organism that operates rationally regarding objectives (Nicholls, 1984). This theory situates competence, and the way it is understood by different individuals, as its central axis. People differ in how they understand competence based on individual and situational factors (Elliot & Dweck, 2005). However, the construct of achievement goals has evolved in recent years from a general concept, explaining both the behavior and the aim or outcome expected in an achievement context (Nicholls, 1989), to an approach that describes the construct as a goal and assumes competence as a conceptual core, by offering a more precise definition exclusively based on competence (Elliot, 1999).
In parallel to this conceptual evolution, theorists have been reconsidering both the number and type of achievement goals. Nicholls (1984) defined two conceptions of ability that determine two different types of goals (dichotomous model). Mastery or task goals in which competence is constructed self-referentially, and performance or ego goals in which competence is constructed based on social comparison, or hetero-referentially. Over time, this model evolved into three dimensions (trichotomous model), due to the recognition of two types of valence in performance goals (performance-approach and performance-avoidance goals). Later, four goals were proposed by considering that both the mastery and the performance goals should be split into approach and avoidance goals (Elliot & McGregor, 2001). The introduction of avoidance goals addresses the possibility of avoiding negative outcomes in the construction of achievement goals (Elliot, 1999; Elliot & Harackiewicz, 1996; Middleton & Midgley, 1997).
In the last decade, AGT has taken a new step by proposing the 3×2 achievement goal model (Elliot, Murayama, & Pekrun, 2011; Murayama, Elliot, & Friedman, 2012). According to these authors, competence may be defined with respect to the standard used in evaluation, in other words, the referent considered to determine if one is doing well or badly. Consequently, three basic evaluative standards may be identified: an absolute standard (task), an intrapersonal standard (self), and a normative standard (other). Task-based goals use the absolute demands of the task as the referent for evaluation (e.g., to perform many exercises and skills correctly). Self-based goals use their intrapersonal trajectory as the referent for evaluation (e.g., to do the exercises better than I usually do). Other-based standards use a referent of interpersonal evaluation (e.g., to outperform other students in tasks and skills). However, competence also may be evaluated as a positive and desirable possibility (i.e., valence of approach to success) or as a negative and undesirable possibility (i.e., valence of avoidance of failure) (Elliot & Harackiewicz, 1996; Elliot & McGregor, 2001).
In this way, the 3×2 achievement goal model (Elliot et al., 2011) is composed of six achievement goals derived from crossing the three standards used to define competence and the two ways competence is valenced. Task-approach goals (TAp, task-based competence), task-avoidance goals (TAv, avoidance of task-based incompetence), self-approach goals, (SAp, self-based competence), self-avoidance goals (SAv, avoidance of self-based incompetence), other-approach goals, (OAp, other-based competence), and other-avoidance goals (OAv, avoidance of other-based incompetence). The 3×2 model has been empirically tested in university and high school (Elliot et al., 2011; Méndez-Giménez, Cecchini, Fernández-Río, Méndez-Alonso, & Prieto-Saborit, 2017; Méndez-Giménez, Cecchini, Méndez-Alonso, Prieto-Saborit, & Fernández-Río, 2018), in sport (Mascret, Elliot, & Cury, 2015) and in Physical Education contexts (Méndez-Giménez, García-Romero, & Cecchini, 2018; Méndez-Giménez, Cecchini, & Fernández-Río, 2014).
Self-determination theory (SDT; Ryan & Deci, 2000, 2002) states that all individuals have the requirement to satisfy three basic needs for the development and maintenance of psychological health and well-being, one of which is the basic psychological need for competence. Competence is the psychological need to exert a significant effect on the environment. It refers to the innate propensity to develop skills and abilities, and experience effectiveness in action. However, as previously stated, people differ in the way they understand competence and consequently how to evaluate and satisfy it in up to six different ways according to the 3×2 achievement goal model. That is to say, the need for competence should also be related to the particular way of constructing competence, in this case, the satisfaction of competence from the 3×2 achievement goal model.
Given the substantive progress that has been made with the 3×2 conceptual model, specifically in terms of the different ways competence is conceived, it is necessary to explore how all these constructs relate to the need for competence, both in transversal and longitudinal studies. Understanding these relationships between the 3×2 achievement goals and the satisfaction of the basic psychological need for competence (SBPNC) is a key issue in the development of AGT since this framework places competence (and by extension, the way to satisfy it) at its core. As basic psychological needs theory (Ryan & Deci, 2000, 2002) established, competence is defined as the ability to perform actions with the assurance that the result is what is expected or desired. Competence is linked to the satisfaction of a particular goal, that which the individual adopts. Consequently, when examining the relationships, all of the 3×2 achievement goals should be associated with the need for competence, albeit with different predictive values. It is also expected that some 3×2 achievement goals will tend to satisfy competence more than others, especially if the following premises of the theoretical framework are considered (Elliot et al., 2011):
(a) Approach goals should have a higher predictive value than avoidance goals on the SBPNC. Pekrun, Elliot, and Maier (2006, 2009) pointed out that using success as the center of regulatory activity encourages hope, enthusiasm, and excitement since the possibility of success is constantly remembered. These appetitive processes tend to promote full commitment to and facilitate a broad focus on task-involvement (Elliot, 1999). On the contrary, using failure as a center of regulation causes and perpetuates threat, anxiety, and vigilance (Pekrun et al., 2006, 2009). In general, pursuing goals based on approach rather than avoidance is much more pleasant and more suited to facilitating efficient and effective task-involvement (Elliot, Shell, Henry, & Maier, 2005).
(b) Task-based goals should have a higher predictive value than self-based goals, which should have higher predictive value than other-based goals. The use of a task-based evaluation standard for regulation is simple, since it only requires the ability to cognitively represent a task, and to discern the degree to which that task has been achieved or not (Elliot et al., 2011). According to these authors, this form of effort is probably optimal for the phenomenological experience of regulation. The use of a self-based standard is more complicated and requires more cognitive capacity than the use of a task-based standard. Even in its simplest form, self-based regulation requires the ability to cognitively represent two outcomes simultaneously (one of which is not present), and to evaluate the outcomes regarding a temporal sequence. Finally, the use of an interpersonal standard in the evaluation of other-based goals varies in complexity depending on whether the comparison with the other is concrete and present in the achievement situation (as in face-to-face competence) or whether it consists of normative regulatory information. In general, an interpersonal comparison requires the representation and use of a more abstract evaluation referent and a normative criterion of evaluation is not usually calibrated to provide an optimal challenge (Nicholls, 1989). Therefore, this goal may not be as ideal for the phenomenological experience of regulation as task-based or self-based goals (Elliot et al., 2011).
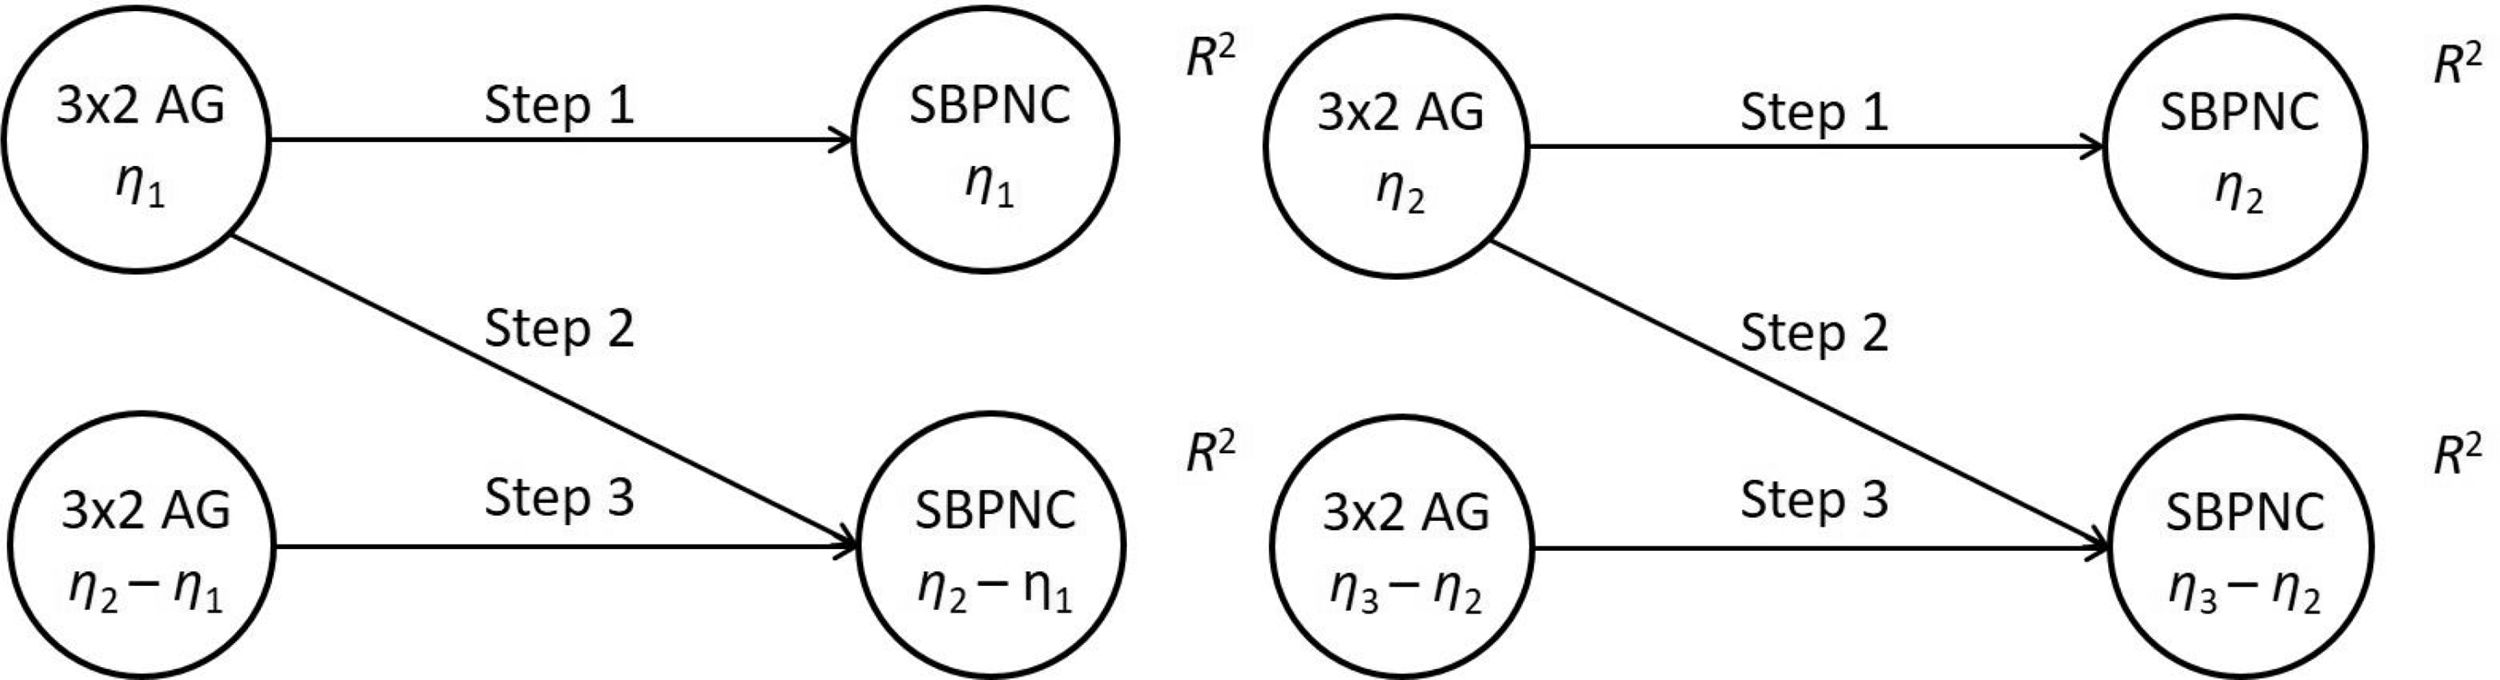
In the present study, measurements of 3×2 achievement goals and SBPNC were taken at three different times. With this information, structural equation analyses were performed in three successive steps: (a) cross-sectional analysis between these variables at T1 and T2; (b) longitudinal analyses between 3×2 achievement goals at T1 and T2 with the true intraindividual change (TIC) in the need for competence in η2−η1 and η3−η2, respectively; and, (c) TIC analysis between the 3×2 achievement goals in η2−η1 and η3−η2 with the need for competence in η2−η1 and η3−η2, respectively (Figure 1). Why is a step 1 included, or a model of transverse structural equations, when measurements are taken at three timepoints? The reason is that the 3×2 achievement goals model situates competence, and the way of understanding it, as a conceptual core (Elliot, 1999). For this reason a starting point is needed to check whether the predictions of this theory are fulfilled at the beginning of the model, in other words, that in step 1 every 3×2 achievement goal significantly predicts the need for competence, and that this predictive value is different depending on the definition and the valence (Elliot et al., 2005, 2011; Pekrun et al., 2009). The next step (2) is to confirm these results, in such a way that the 3×2 achievement goals (in η1 and η2) predict the TIC in all cases (η2−η1 and η3−η2). That is, which transverse measures (3×2 achievement goals) predict longitudinal changes in the need for competence. The last step (3) is to verify that the intraindividual changes in the 3×2 achievement goals predict intraindividual changes in the need for competence. Confirming these hypotheses would give strong support to the 3×2 AGT since it would be the first time that its predictions would be supported using both transversal and longitudinal types of analysis.
 and satisfaction of the basic psychological need for competence (SBPNC) between T1 and T2 (left) and T2 and T3 (right).")
This is the first study addressing the relationship between the 3×2 achievement goals, created based on how competence is understood, and the satisfaction of it in adolescents. We believe that the implications are important for the formulation of the theory itself since, in the case of inconsistent results, it should be revised. In addition, one may be able to answer questions that are at the center of the theory, such as whether the way competence is thought of in the creation of goals affects their level of satisfaction? For example, do TAp (in which competence is constructed in a self-referenced form), and OAp (in which competence is constructed based on social comparison) satisfy the perception of personal competence differently? Alternatively, do true intraindividual changes in the way of conceiving competence (in the elaboration of goals) have a positive effect on intraindividual changes in the satisfaction of the same (perceived competence)?”
Based on the information provided, the following hypotheses are formulated: (1) The 3×2 achievement goals will positively predict the need for competence (step 1) in all cases; (2) The predictive value will be different depending on the definition and the valence, in such a way that: 2.1. Task-based goals will have a higher predictive value than self-based goals, and these in turn will have a higher predictive value than other-based goals on the prediction of the need for competence; and 2.2. Approach goals will have more predictive value than avoidance goals on the need for competence; (3) The explained variance (R2) in step 1 of the 3×2 achievement goals over the need for competence will be higher at T2 than at T1; (4) The 3×2 achievement goals will negatively predict (since the η2 is subtracted from η1 and η3 from η2, respectively) the TIC of the need for competence in all cases; and (5) The TIC of the 3×2 achievement goals will positively predict the TIC of the need for competence in all cases.
MethodParticipantsThe sample consisted of 263 students from six high schools (133 boys and 130 girls), aged between 11 and 14 years old at T1(M=12.76, SD=.89). The data collection was carried out over three consecutive academic years.
InstrumentsQuestionnaire of 3×2 achievement goals in Physical Education, developed by Méndez-Giménez et al. (2014), based on the questionnaire produced by Elliot et al. (2011). The items are preceded by the phrase “In Physical Education lessons my goal is…”. It is composed of a total of 24 items grouped into six factors: TAp (e.g., “…to perform many exercises and tasks correctly”), TAv (e.g., “…to avoid doing the tasks poorly”), SAp (e.g., “…to perform the exercises better than I usually do”), SAv (e.g., “…to avoid performing the exercises worse than I usually do”), OAp (e.g., “…to outperform other students performing exercises and tasks”), OAv (e.g., “…to avoid doing exercises and tasks worse than other students”). Cronbach's alpha from the study by Méndez-Giménez et al. (2014) ranged between .74 (TAp) and .89 (OAp). In the present study, they ranged between .72 (OAv at T1) and .90 (OAp at T2). Participants indicated the degree of agreement with each of these statements using a 5-point Likert scale, from 1 (not at all true for me) to 5 (totally true for me).
Satisfaction of the basic psychological need for competence. We used the competence subscale of the version translated into Spanish and adapted to Physical Education by Moreno, González-Cutre, Chillón, and Parra (2008) of the Scale of Measurement of Basic Psychological Needs in Exercise (Vlachopoulos & Michailidou, 2006). This dimension is made up of four items (e.g., “I feel that I made great progress concerning the end goal that I set myself”). All the items are preceded by the heading “In Physical Education lessons…”. The items correspond to a 5-point Likert scale that ranged from 1 (totally disagree) to 5 (totally agree). Cronbach's alpha in the study by Moreno et al. (2008) was .78, and in the present study it ranges between .75 and .80 at the three timepoints.
The fundamental reason why Cronbach's alpha was used as the single measure for internal consistency of the instruments is to be able to compare the results found in the present study with those in the literature that use the same measurement. The metric properties of the instruments used should not be restricted to the internal consistency evaluated by Cronbach's alpha, but necessary information about validity should also be included, in addition to providing evidence of reliability, from the analysis of data by confirmatory factor analysis (CFA). For this reason, the results of the complete final models and also the estimated parameters are presented.
ProcedureThe questionnaire was administered and completed in a regular physical education class in the third term of each academic year. Participants were informed that the questionnaire was anonymous and that there were no correct or incorrect answers. Permission of the Ethics Commission for Research of the University and the consent of families and teachers were obtained.
Data analysisEight participants were absent in the second wave of measurement and 12 participants in the third wave. To make use of all the data, the “Expectation-Maximization” (EM) algorithm was used for covariance matrices. Estimators with incomplete data can be obtained by maximum likelihood from the EM algorithm, and according to Schafer (1999), the estimators can be more efficient than those that would be obtained with multiple imputations because it does not require simulations or depend on a statistical or econometric model.
In the field of psychology, modeling the true intraindividual change (TIC) is a line of research that has progressed significantly with the application of structural equation modeling techniques with repeated measure data (e.g., Little, Schnabel, & Baumert, 2000). The most widely used technique is the latent growth curve (LGC) model, which analyses the growth curves by decomposing them into latent variables that represent an intersection and a linear component of change. However, although the LGC allows the examination of pattern of change during the entire period of the study, this technique does not allow the modeling of TIC for a specific time interval (Otis, Grouzet, & Pelletier, 2005). Within this line of research, the scores of the TIC, proposed by Steyer, Partchev, and Shanahan (2000), could be analyzed at the latent level instead of the observed level, offering a great advantage in distinguishing the change components from the measurement error components. Furthermore, in TIC models, the true intraindividual change, and not a particular component of it as in LGC models, can be correlated with other variables, as in the present study. We chose TIC over LGC modeling for two main reasons. Firstly, we wanted to explore the true change in itself instead of its linear, quadratic or cubic components (separately). Secondly, we wanted to examine the relationships between changes in 3×2 achievement goals and changes in the need for competence. Although both TIC and LGC models may examine this type of correlation, only TIC allowed us to explore the distinction between the change from T1 to T2 and from T2 to T3 (Otis et al., 2005). It allowed us to verify the three steps proposed in our study. It is true that this technique also has some disadvantages, the most important being that they are more complex structural models and more difficult to understand. However, we estimate that the advantages greatly outweigh the disadvantages by contributing a little used technique in previous studies that has important methodological implications.
TIC is based on the assumption that at least two variables measure the same latent variable on at least two occasions, and that the measurement model is invariant over time. The parcels procedure (sets of items) was used to form two indicators per construct (Little, Cunningham, Shahar, & Widaman, 2002) as well as an internal consistency approach to create packages (two items per factor) for the variables analyzed, in such a way that the measurement items of the same subscale are combined within the same parcel. The advantages and disadvantages of using parcels is an ongoing debate (e.g., Little, Rhemtulla, Gibson, & Schoemann, 2013; Rocha & Chelladurai, 2012). Even in the ideal case that the scales are one-dimensional (that is, without correlated measurement errors or cross-loading), that the model is correctly specified and that the observed variables are normally distributed and multivariate, it has been shown that the statistics of structural equation modeling (SEM) fit and parameter estimates vary depending on how the indicators are assigned to the parcels (McIntosh, Edwards, & Antonakis, 2014). Therefore, it was necessary to proceed with care and also report the variability of the fit statistics and parameter estimates in the hypothesized model through a randomized allocation of the indicators for the parcels (Little et al., 2002).
To test the hypothesis that the measurement model was invariant over time, 14 confirmatory factor analyses (CFAs) were performed, one for each 3×2 achievement goal and another for the need for competence in the TIC between T1 and T2, and between T2 and T3. This model is called a multistate model with invariant parameters (Steyer et al., 2000). The most substantive part of this model of structural equations is the need for factor loads to remain constant over time. The fit in all models does not change significantly. The ΔS-Bχ2 (2) ranges between .22 and 1.57, and the significance is, in all cases, less than .05. These results support factorial invariance. The second stage is to test a reference model, the base model. The indicators of each latent variable at T2 were then returned to the corresponding latent variables at T1 (first year), and the latent variables at T3 to the corresponding latent variables at T2 (second year). By adding these coefficients and by keeping the corresponding factor loads constant (which are the same over the time points), the latent factors are transformed at T2 (or, if applicable, at T3), into true intraindividual change scores during the year of measurement (from T1 to T2 or, where appropriate, from T2 to T3). Therefore, this approach allows us to test the proposed model based on intraindividual changes (e.g., Gniewosz & Watt, 2017). In order to determine the most appropriate estimators, an exploratory analysis of the data was carried out. The coefficient of multivariate kurtosis in all the models analyzed varied between 56.82 and 95.81, which indicates that the sample presents a non-normal distribution. For this reason, analyses based on the use of the Satorra-Bentler chi-square (S-Bχ2) statistic and robust standard estimates (instead of the usual chi-square maximum likelihood statistic) were performed since they serve as a correction for χ2 when the distribution assumptions are violated (Byrne, 2008). Taking into account the fact that the sample presented a non-normal distribution, the EQS 6.2 program was used (Bentler, 2005).
The following indices of fit were considered in our strategy for evaluating the fit of the model. We used the Comparative Fit Index (*CFI) as an index of incremental fit, the calculation of which is based on the statistic S-Bχ2. We used the robust version of the Root Mean Square Error Approximation (*RMSEA) as a measure of absolute fit, which takes into account the error of approximation in the population (Browne & Cudeck, 1993). This discrepancy, measured by the *RMSEA, is expressed by the degree of freedom, which is why it is sensitive to the complexity of the model. Values below .05 indicate a good fit, and values as high as .08 represent a reasonable error of approximation in the population. Finally, we used the Root Mean Square Residual (SRMR). The following values are suggested as indicative of a good fit: ≥ .95 for the *CFI, ≤ .08 for the *RMSEA (Byrne, 2008).
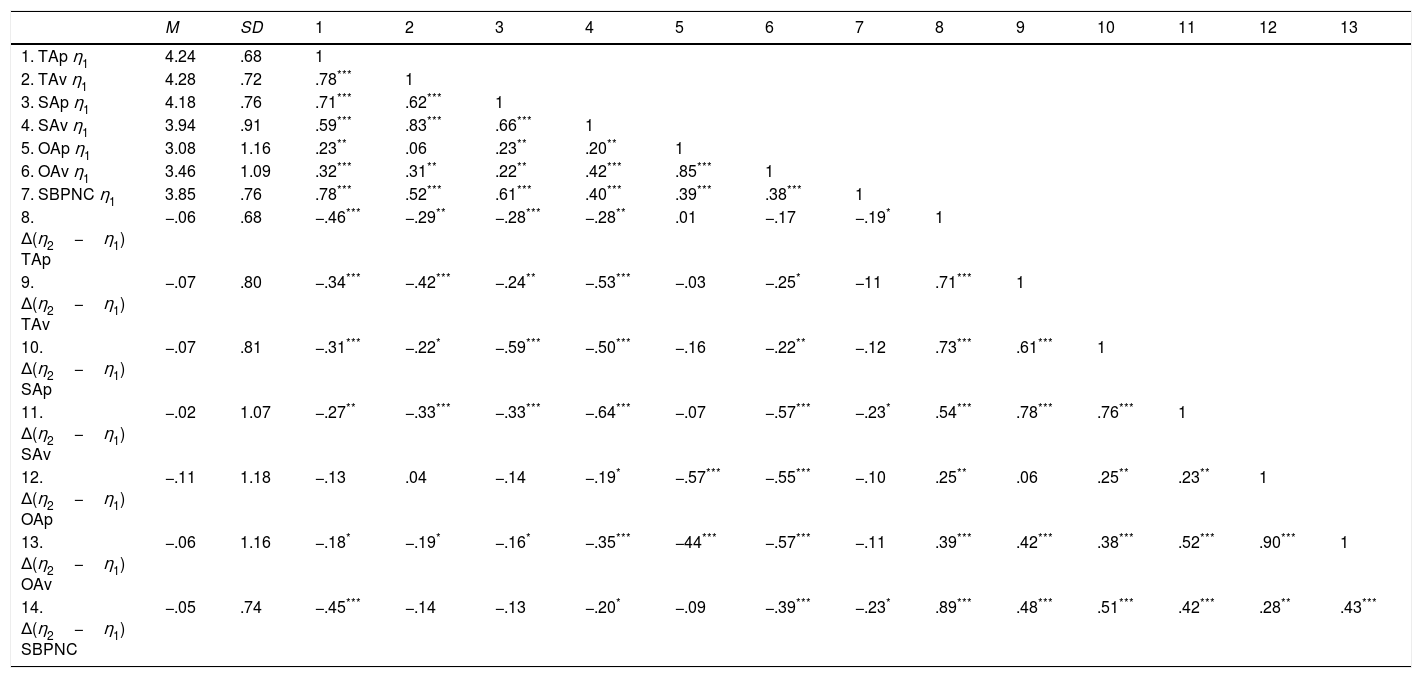
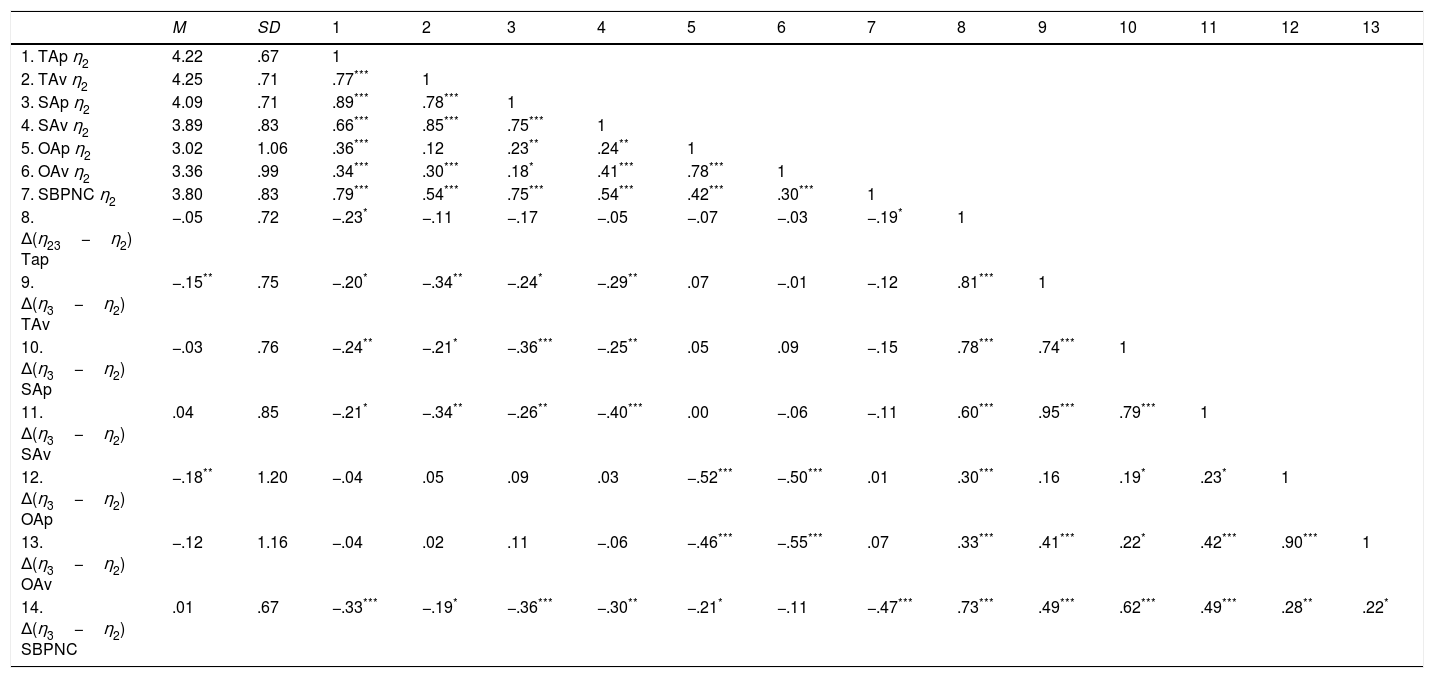
ResultsDescriptive analysisTables 1 and 2 include the means and bivariate correlations between T2 and T1 and between T3 and T2 in all latent variables. No significant changes were observed between T1 and T2 in any of the analyzed variables, but changes were seen in TAv and OAp between T2 and T3, in which their values increased. This general trend does not exclude possible differences in the TIC. Although there is no significant change at a group level, some students may have perceived the change more than others.
Averages, standard deviations, and correlations between T2 and T1 in all latent variables
| M | SD | 1 | 2 | 3 | 4 | 5 | 6 | 7 | 8 | 9 | 10 | 11 | 12 | 13 | |
|---|---|---|---|---|---|---|---|---|---|---|---|---|---|---|---|
| 1. TAp η1 | 4.24 | .68 | 1 | ||||||||||||
| 2. TAv η1 | 4.28 | .72 | .78*** | 1 | |||||||||||
| 3. SAp η1 | 4.18 | .76 | .71*** | .62*** | 1 | ||||||||||
| 4. SAv η1 | 3.94 | .91 | .59*** | .83*** | .66*** | 1 | |||||||||
| 5. OAp η1 | 3.08 | 1.16 | .23** | .06 | .23** | .20** | 1 | ||||||||
| 6. OAv η1 | 3.46 | 1.09 | .32*** | .31** | .22** | .42*** | .85*** | 1 | |||||||
| 7. SBPNC η1 | 3.85 | .76 | .78*** | .52*** | .61*** | .40*** | .39*** | .38*** | 1 | ||||||
| 8. Δ(η2−η1) TAp | −.06 | .68 | −.46*** | −.29** | −.28*** | −.28** | .01 | −.17 | −.19* | 1 | |||||
| 9. Δ(η2−η1) TAv | −.07 | .80 | −.34*** | −.42*** | −.24** | −.53*** | −.03 | −.25* | −11 | .71*** | 1 | ||||
| 10. Δ(η2−η1) SAp | −.07 | .81 | −.31*** | −.22* | −.59*** | −.50*** | −.16 | −.22** | −.12 | .73*** | .61*** | 1 | |||
| 11. Δ(η2−η1) SAv | −.02 | 1.07 | −.27** | −.33*** | −.33*** | −.64*** | −.07 | −.57*** | −.23* | .54*** | .78*** | .76*** | 1 | ||
| 12. Δ(η2−η1) OAp | −.11 | 1.18 | −.13 | .04 | −.14 | −.19* | −.57*** | −.55*** | −.10 | .25** | .06 | .25** | .23** | 1 | |
| 13. Δ(η2−η1) OAv | −.06 | 1.16 | −.18* | −.19* | −.16* | −.35*** | −44*** | −.57*** | −.11 | .39*** | .42*** | .38*** | .52*** | .90*** | 1 |
| 14. Δ(η2−η1) SBPNC | −.05 | .74 | −.45*** | −.14 | −.13 | −.20* | −.09 | −.39*** | −.23* | .89*** | .48*** | .51*** | .42*** | .28** | .43*** |
Note. TAp=task-approach goals; TAv=task-avoidance goals; SAp=self-approach goals; SAv=self-avoidance goals; OAp=other-approach goals; OAv=other-avoidance; SBPNC=satisfaction of the basic psychological need for competence.
Averages, standard deviations and correlations between T3 and T2 in all latent variables
| M | SD | 1 | 2 | 3 | 4 | 5 | 6 | 7 | 8 | 9 | 10 | 11 | 12 | 13 | |
|---|---|---|---|---|---|---|---|---|---|---|---|---|---|---|---|
| 1. TAp η2 | 4.22 | .67 | 1 | ||||||||||||
| 2. TAv η2 | 4.25 | .71 | .77*** | 1 | |||||||||||
| 3. SAp η2 | 4.09 | .71 | .89*** | .78*** | 1 | ||||||||||
| 4. SAv η2 | 3.89 | .83 | .66*** | .85*** | .75*** | 1 | |||||||||
| 5. OAp η2 | 3.02 | 1.06 | .36*** | .12 | .23** | .24** | 1 | ||||||||
| 6. OAv η2 | 3.36 | .99 | .34*** | .30*** | .18* | .41*** | .78*** | 1 | |||||||
| 7. SBPNC η2 | 3.80 | .83 | .79*** | .54*** | .75*** | .54*** | .42*** | .30*** | 1 | ||||||
| 8. Δ(η23−η2) Tap | −.05 | .72 | −.23* | −.11 | −.17 | −.05 | −.07 | −.03 | −.19* | 1 | |||||
| 9. Δ(η3−η2) TAv | −.15** | .75 | −.20* | −.34** | −.24* | −.29** | .07 | −.01 | −.12 | .81*** | 1 | ||||
| 10. Δ(η3−η2) SAp | −.03 | .76 | −.24** | −.21* | −.36*** | −.25** | .05 | .09 | −.15 | .78*** | .74*** | 1 | |||
| 11. Δ(η3−η2) SAv | .04 | .85 | −.21* | −.34** | −.26** | −.40*** | .00 | −.06 | −.11 | .60*** | .95*** | .79*** | 1 | ||
| 12. Δ(η3−η2) OAp | −.18** | 1.20 | −.04 | .05 | .09 | .03 | −.52*** | −.50*** | .01 | .30*** | .16 | .19* | .23* | 1 | |
| 13. Δ(η3−η2) OAv | −.12 | 1.16 | −.04 | .02 | .11 | −.06 | −.46*** | −.55*** | .07 | .33*** | .41*** | .22* | .42*** | .90*** | 1 |
| 14. Δ(η3−η2) SBPNC | .01 | .67 | −.33*** | −.19* | −.36*** | −.30** | −.21* | −.11 | −.47*** | .73*** | .49*** | .62*** | .49*** | .28** | .22* |
Note. TAp=task-approach goals; TAv=task-avoidance goals; SAp=self-approach goals; SAv=self-avoidance goals; OAp=other-approach goals; OAv=other-avoidance; SBPNC=satisfaction of the basic physiological need for competence.
Positive correlations of all 3×2 achievement goals were seen with the need for competence in η1 and η2. Significant correlations were also seen between the 3×2 achievement goal η1 (TAp, SAv, and OAv) and the need for competence η2−η1, and between the 3×2 achievement goals η2 (TAp, TAv, SAp, SAv, and OAp) and the need for competence η3−η2. The negative correlation between the latent change variables (η1 and η2−η1) is due to the fact that η1 is a component of the difference η2−η1, therefore, if the variances of two latent variables are equal and their correlation is less than one, the covariance (and, therefore, the correlation) between η1 and η2−η1 is negative (Steyer, 2005). Finally, there were positive correlations between all the 3×2 achievement goals η2−η1 and the need for competence η2−η1, and between all the 3×2 achievement goals η3−η2 and the need for competence η3−η2, consequently the patterns of change in the 3×2 achievement goals were related to the patterns of change in the need for competence.
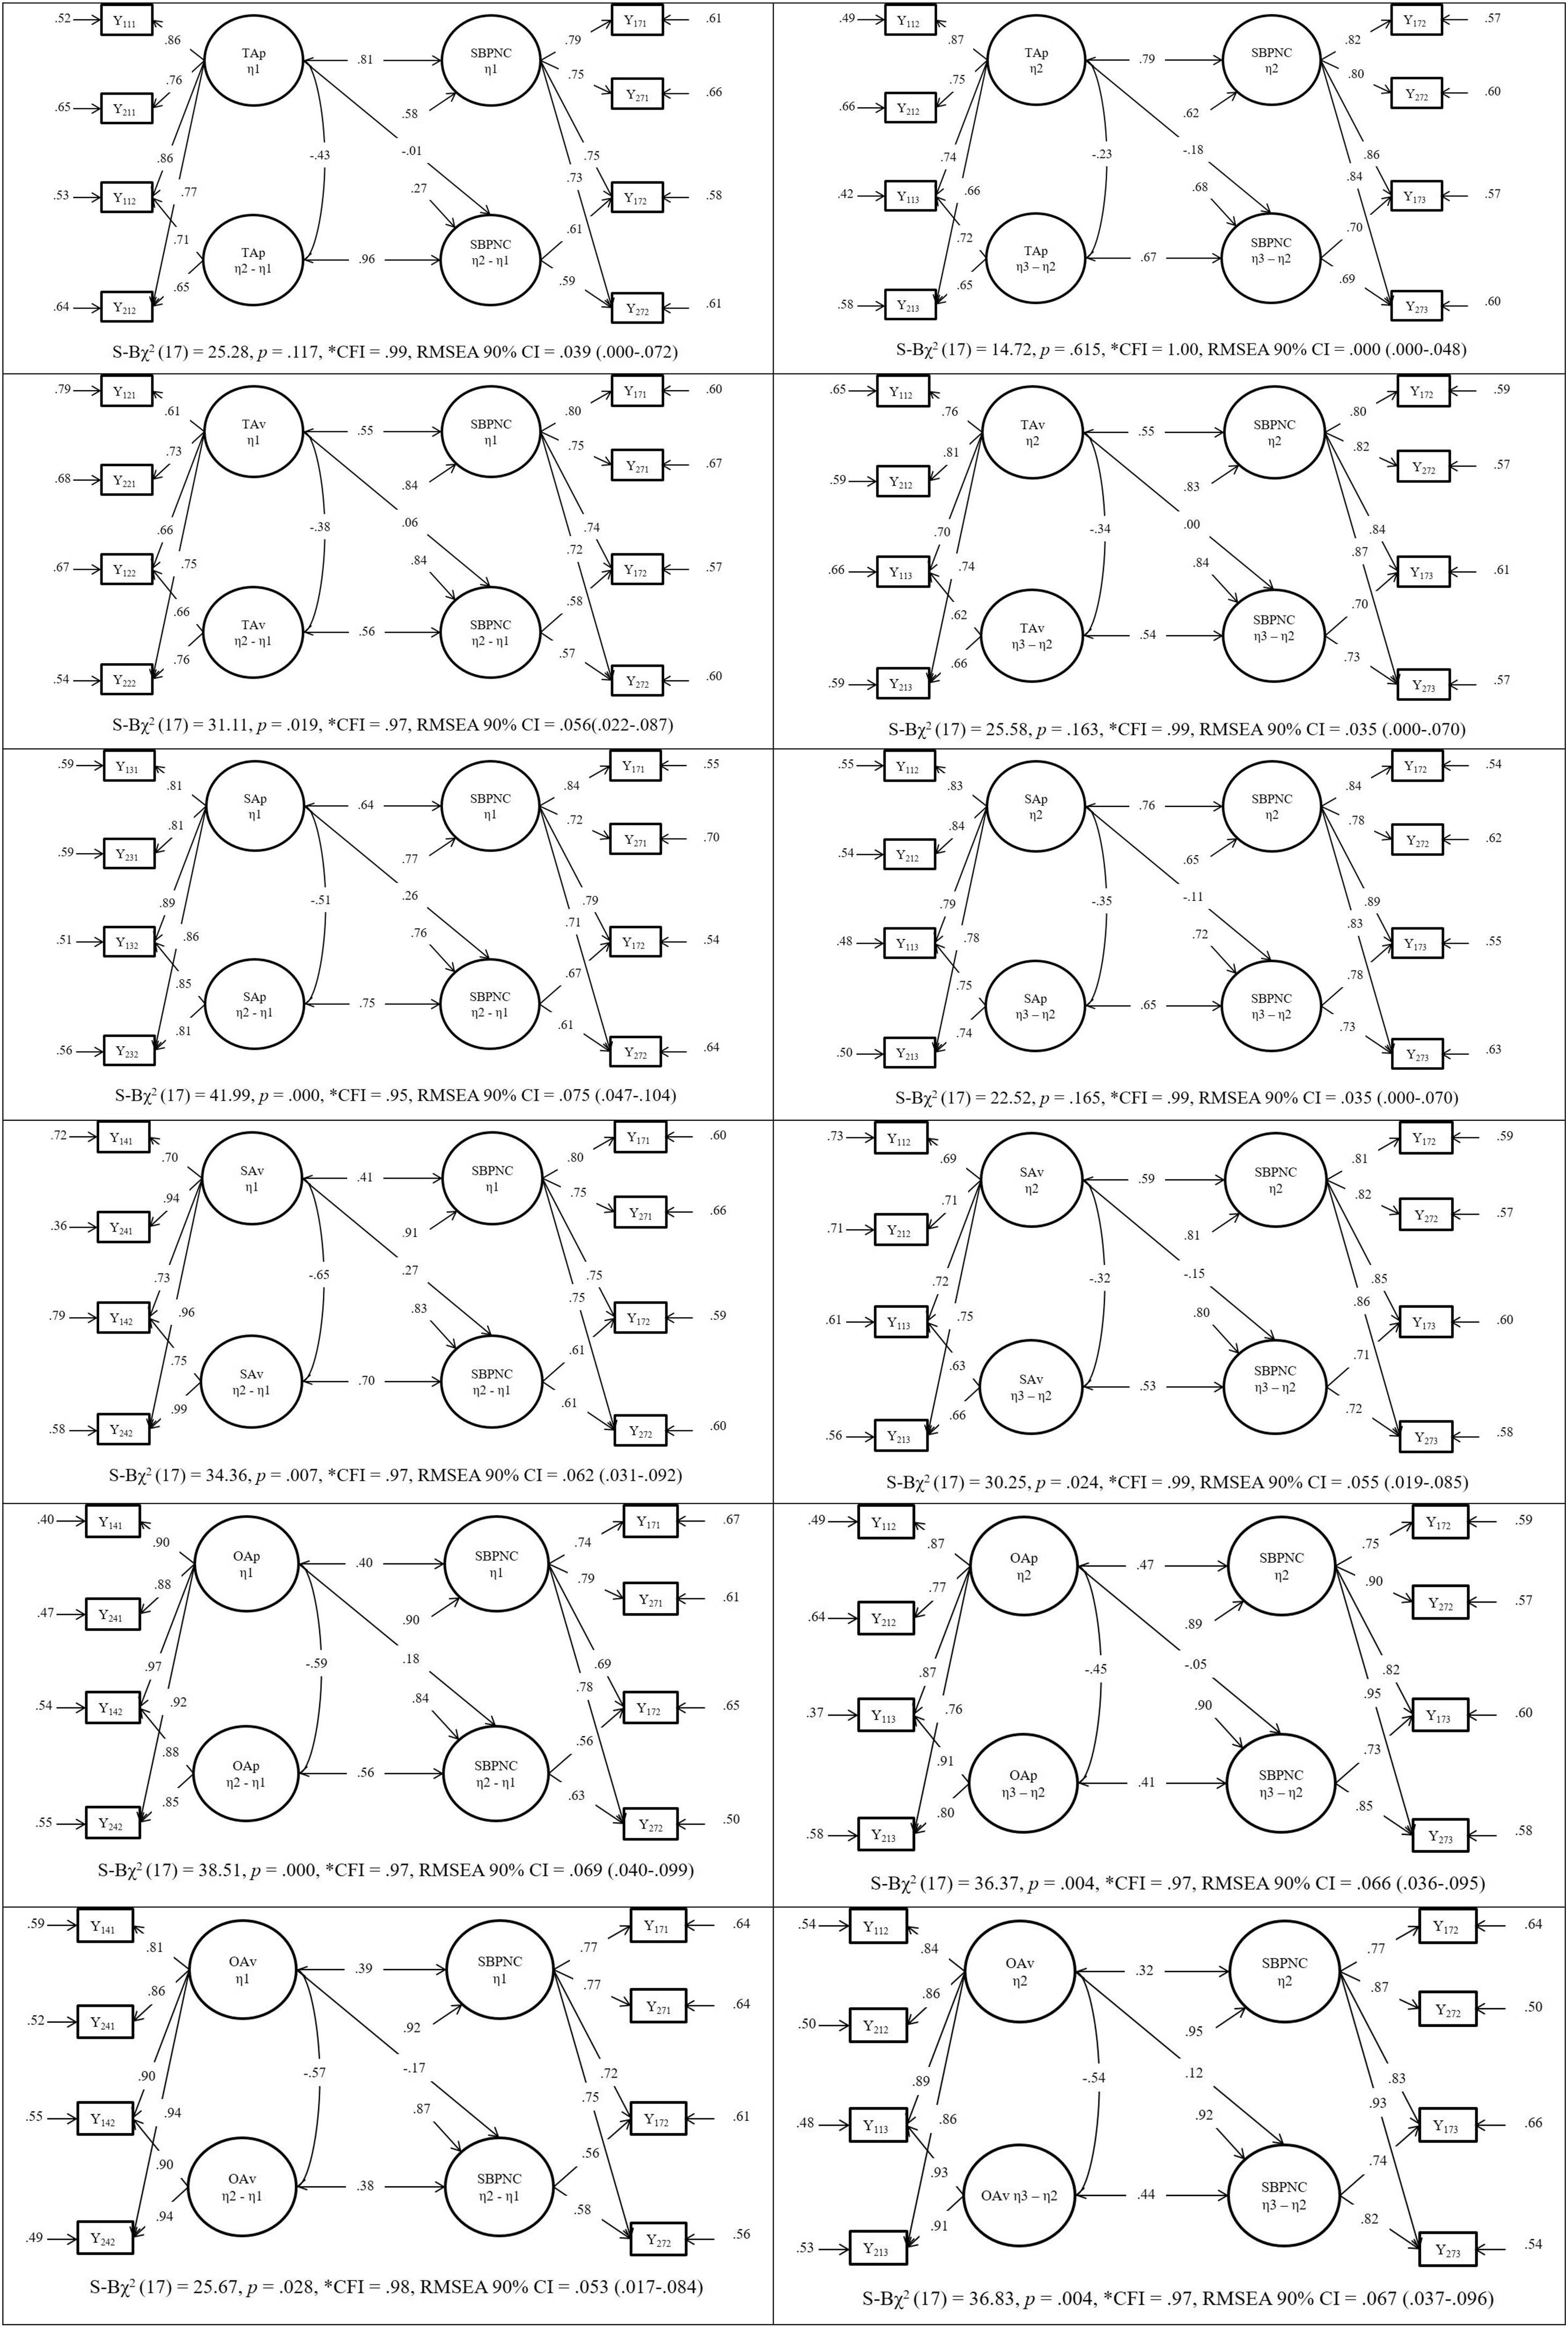
Testing the proposed modelsThe results of the SEM analysis show that all the models provide a satisfactory fit to the data (Figure 2).

Complete final models in which all the estimated parameters are illustrated. Note. TAp=task-approach goals; TAv=task-avoidance goals; SAp=self-approach goals; SAv=self-avoidance goals; OAp=other-approach goals; OAv=other-avoidance; SBPNC=satisfaction of the basic psychological need for competence. *p<.05; **p<.01; ***p<.001.
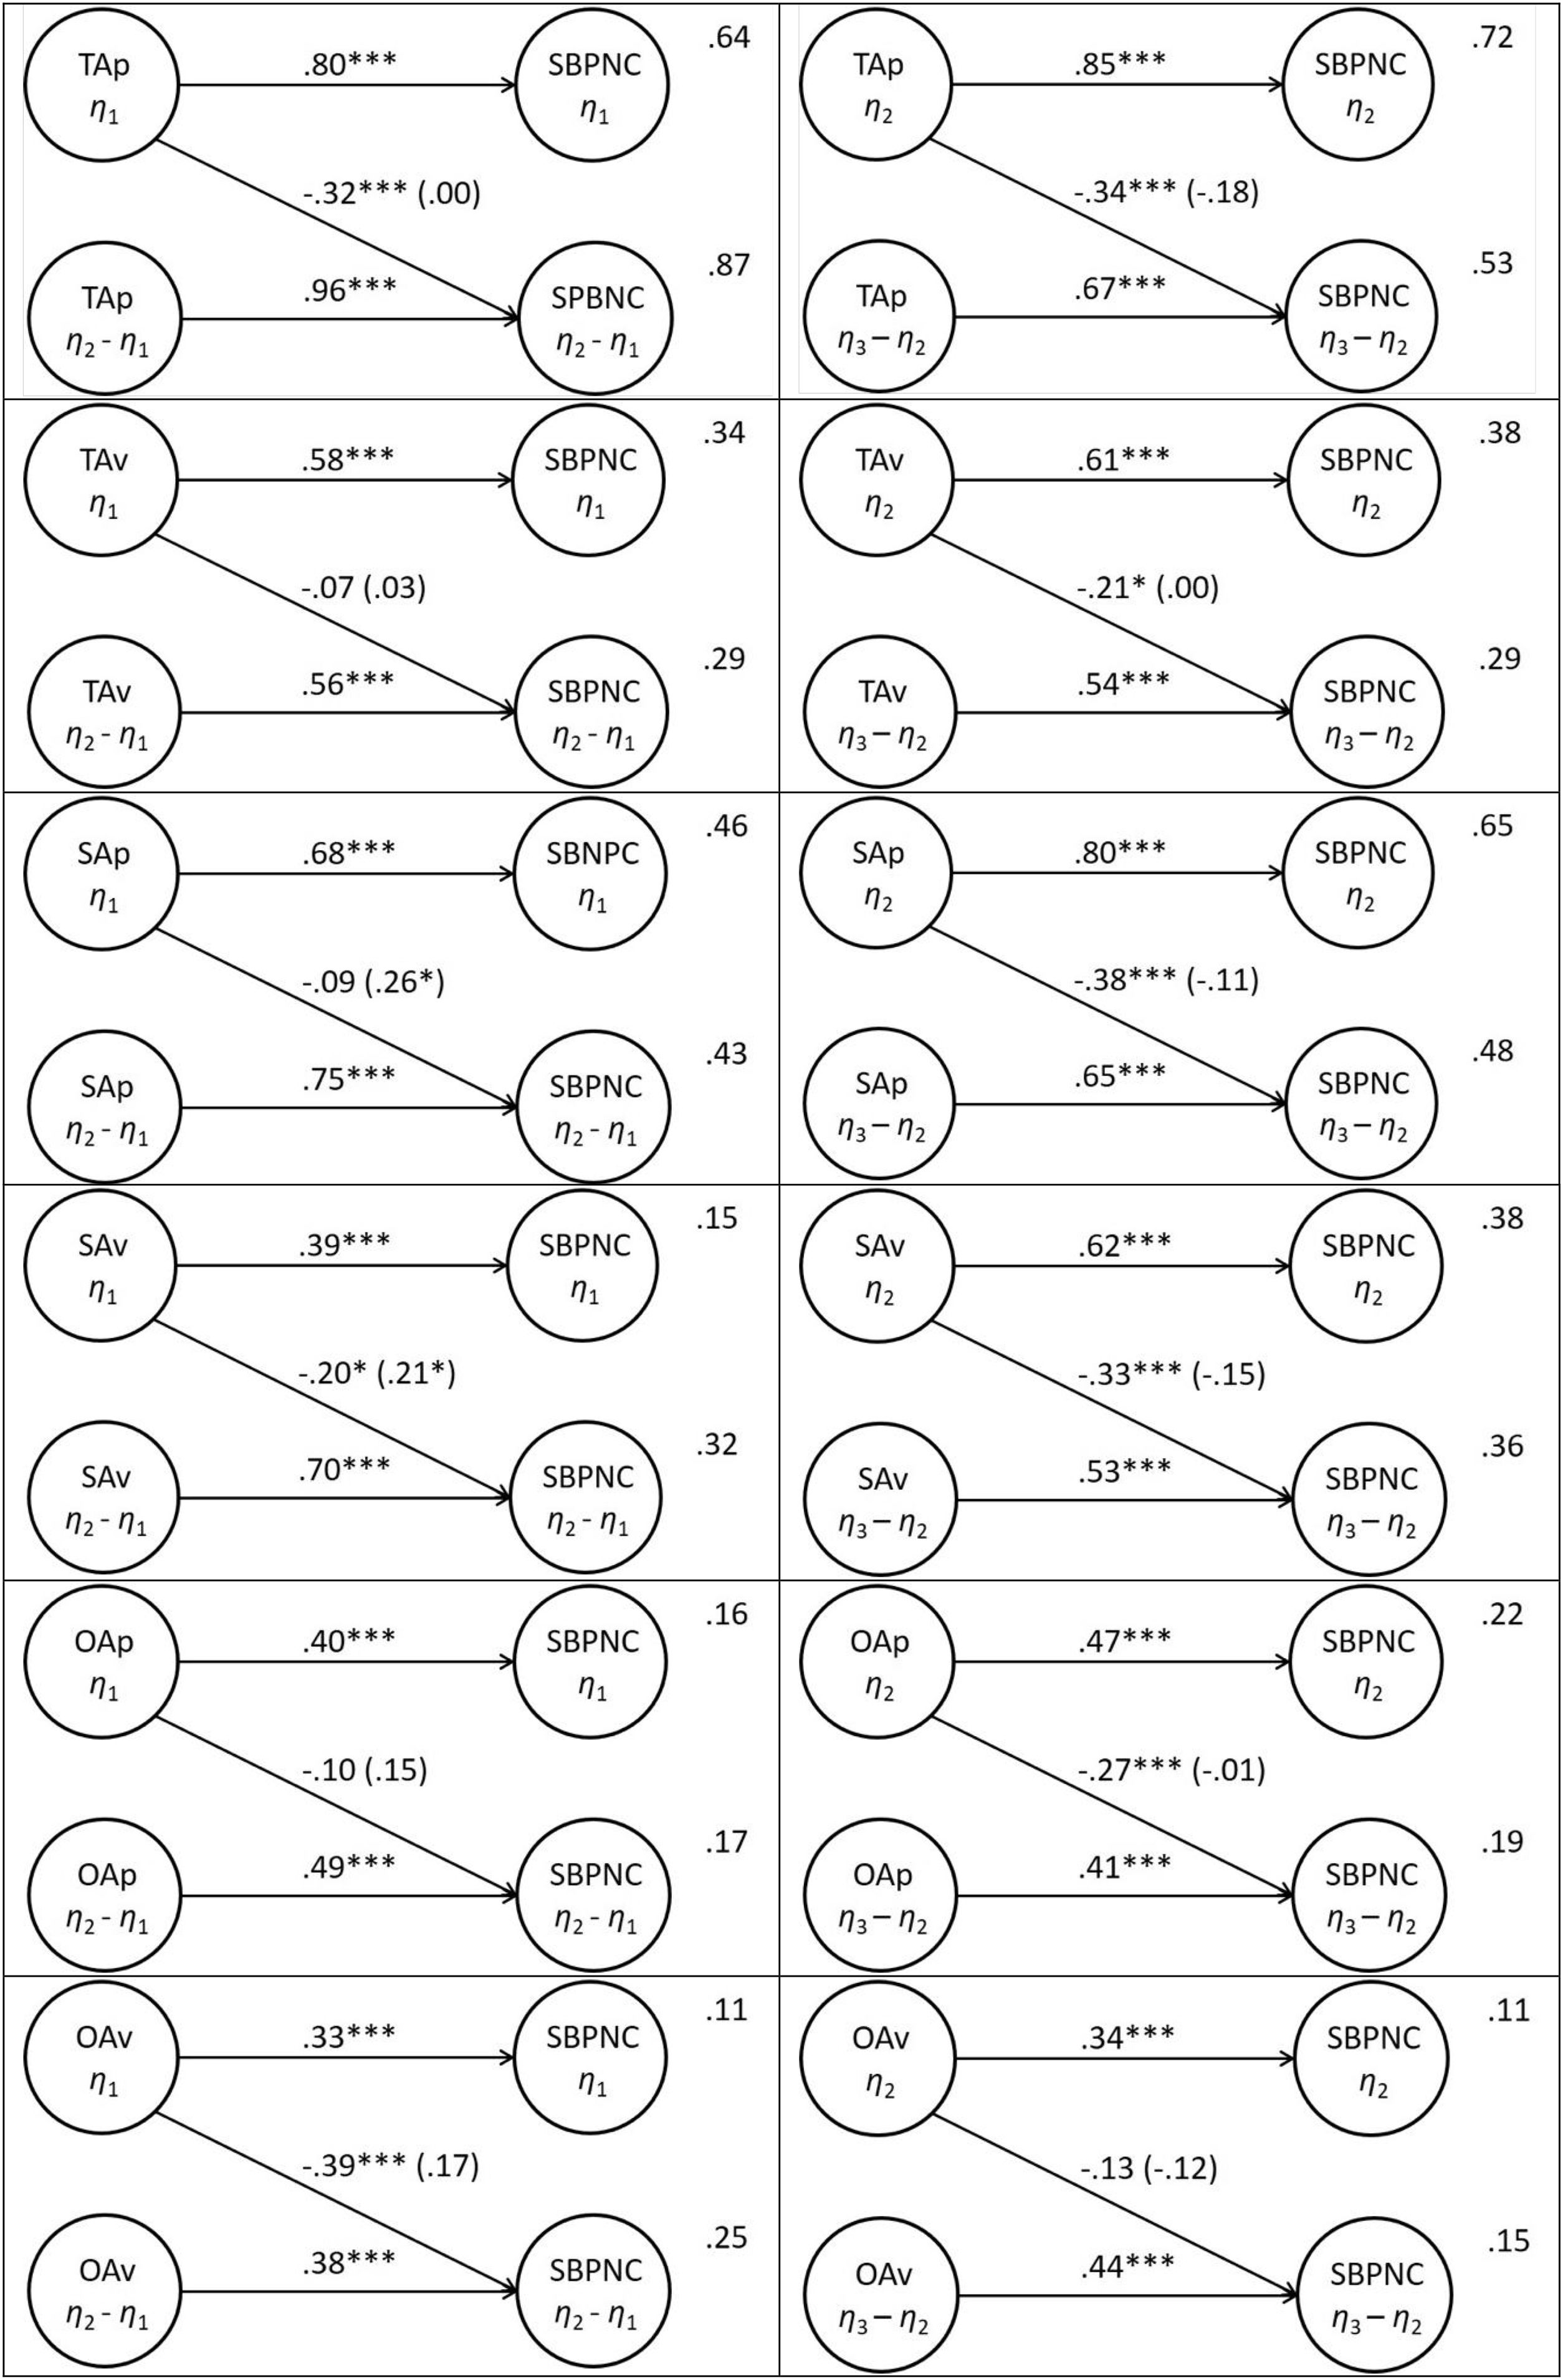
In all of the models the 3×2 achievement goals (η1 and η2) positively predict the need for competence (η1 and η2, step 1), explaining between 11% and 72% of the variance (Figure 3). However, this predictive value is different depending on the definition. Task-based goals explain (overall) an average of 52%, while self-based goals explain (together) an average of 41%, and other-based goals, an average of 15% of the variance of the need for competence. Differences are also observed in terms of valence, the approach goals explain (overall) an average of 47.5%, while the avoidance goals explain (together) an average of 24.5% of the variance of the need for competence.

Analysis of structural equations in three successive steps between the 3×2 achievement goals and the satisfaction of the basic psychological need for competence between T1 and T2, and T2 and T3. Note. TAp=task-approach goals; TAv=task-avoidance goals; SAp=self-approach goals; SAv=self-avoidance goals; OAp=other-approach goals; OAv=other-avoidance; SBPNC=satisfaction of the basic psychological need for competence. The predictive value of the 3×2 achievement goals in T1/T2 on the SBPNC is recorded in parentheses in step 3.
The results also show that the variance explained in step 1 of the 3×2 achievement goals on the need for competence is not higher at T2 than at T1 in all cases (OAv). However, by averaging the variance explained in step 1 with that obtained in step 2 we see that they explain (as a whole) an average of 31% in step 1 and an average of 41% in step 2. Likewise, 3×2 achievement goals both in η1 and in η2 predict significantly and negatively (since subtracting η2 from η1 and η3 from η2, respectively) the TIC of the need for competence in eight of the twelve cases. Specifically, the four cases in which there is no significant prediction are in the TAv, SAp and OAp goals in the transition from T1 to T2 and in the OAv goals in the transition from T2 to T3. Finally, we see that the TIC of the 3×2 achievement goals positively predicts the TIC of the need for competence in all cases (Figure 2).
DiscussionThe aim of this study was to explore the relationships between the 3×2 achievement goals and the need for competence, for which different SEM were tested in three successive steps. The first hypothesis presupposed that the 3×2 achievement goals should positively predict the need for competence (step 1). The results confirm this hypothesis in all cases, and are consistent with the premises of the theoretical framework (Elliot et al., 2011; García-Romero, 2015; Vlachopoulos & Michailidou, 2006) and partially consistent with the study by Méndez-Giménez et al. (2014), whose results show TAp, OAp and SAv as positive predictors of the need for competence and TAv as a negative predictor. The 3×2 achievement goals framework assumes competence as a conceptual core (Elliot, 1999); consistent with this, in our study all goals predict the satisfaction of competence.
However, it was hypothesized that this predictive value should be different depending on the definition (hypothesis 2.1) so that task-based goals would have a higher predictive value than self-based goals, and these, in turn, higher that the other-based goals, on the prediction of the need for competence. The results allow us to accept this hypothesis. Evaluating the degree to which the achievement of a task is acquired is simple since it only requires comparing the results obtained with those expected at the time. However, self-based regulation requires the ability to mentally represent two outcomes simultaneously (one of which is not present), and to evaluate the results sequentially (Elliot et al., 2011). It is, therefore, a cognitive process that requires more capacity. Finally, the evaluation of other-based goals requires the use of a more abstract evaluation reference and, consequently, providing optimal results with the evaluation criterion are more complicated (Nicholls, 1989). The consequence is that the prediction of the need for competence becomes increasingly weaker as the focus of the definition changes in the following sequence: task→self→other.
Hypothesis 2.2 postulates that the predictive value should also vary according to the valence. Thus, the approach goals should have a higher predictive value in the need for competence than the avoidance goals. The results of the study also support this hypothesis. Approach-based goals in general demonstrated higher predictive value in the need for competence than avoidance goals, which is in line with the theoretical framework. As the theory points out, approach goals use success as the center of regulatory activity and tend to encourage fuller commitment to goal involvement (Elliot, 1999), while using failure as the center of regulation reduces commitment (Pekrun et al., 2006, 2009).
The third hypothesis was that the variance explained in step 1 of the 3×2 achievement goals on the need for competence would be higher at T2 than at T1. The results do not allow us to accept this hypothesis. However, when the total variances explained at T1 and T2 were averaged, we saw that in the second case the percentage was higher. Empirical work on goal-based regulation indicates that mentally contrasting a future possibility with a present reality facilitates evaluation and strengthening (Oettingen et al., 2009). When students evaluate their goals at T1, they imagine a desired future, and immediately afterward they reflect on the current situation that hinders the achievement of this desired future, and when feasibility is high, they strongly commit to reaching the goal (Oettingen et al., 2009). Consequently, at T2, more of the variance should be explained by better adjustment of the regulation of achievement goals as a consequence of learning and cognitive development.
The observed cross-sectional results had to be confirmed by a longitudinal study, which was carried out in step 2 (hypothesis 4) in such a way that the 3×2 achievement goals should predict the intraindividual changes on the need for competence, in all cases (step 2). Our findings confirm this hypothesis in most cases, except for TAv (η1)→ SBPNC (η2−η1), SAp (η1)→SBPNC (η2−η1), OAp (η1)→SBPNC (η2−η1), and OAv (η2)→SBPNC (η3−η2). When students reevaluate the need for competence at T2, they do so based on the experiences they have had between T1 and T2 in reaching their achievement goals; some will have remained stable and others will not. In the case of TAv, SAp, and OAp, this prediction does not occur in the changes that occurred between T1 and T2, but in those that occurred between T2 and T3 in the TIC of the need for competence. These results seem to indicate better regulation of these achievement goals based on personal experience and the students getting older. In the case of OAv, we believe that the reason is different and that it is related to valence and definition in this type of goal which are less precise than in the others.
The final hypothesis predicted that the TIC of the 3×2 achievement goals would positively predict the TIC of the need for competence in all cases (Elliot et al., 2011; Vlachopoulos & Michailidou, 2006), and the results corroborate this hypothesis. In addition we believe that they explain, to a large extent, some contradictory data that appear in the results related to hypothesis 4. When the students reevaluate the need for competence at T2 and T3, they also reevaluate the 3×2 achievement goals in parallel. These intraindividual changes should be correlated. The reason is that at T2 and T3 they again picture their desired future and reflect on the current situation after an experience in which they have been able to verify the achievements or failures of the goals pursued at T1 and T2, and the difficulty of the obstacles that they had set out to overcome. This reflects the true evaluation of the 3×2 achievement goals that requires awareness of the changes which happen over time-related to competence as a conceptual core (Elliot, 1999).
This study has some limitations. The first is the sample size that does not allow another type of analysis, such as joint regressions of the 3×2 achievement goals TIC on the need for competence. Another limitation relates to the way in which the need for competence is measured. The 3×2 AGT is based on the principles that there are different individual ways of constructing competence and, consequently, instruments should be created that allow us to measure the different ways of satisfying it.
Please cite this article as: Cecchini J-A, Méndez-Giménez A, García-Romero C. Relaciones entre metas de logro 3×2 y satisfacción de la necesidad psicológica básica de competencia. Rev Psicodidáct. 2019;24:53–61. https://doi.org/10.1016/j.psicod.2018.09.001
