


The aims of this study were twofold: (a) to examine the structural validity of the Spanish version of the 3×2 Achievement Goals Questionnaire (Elliot, Murayama, & Pekrun, 2011) in the non-university academic context, and (b) to analyze the predictive patterns of achievement goals on self-determined motivation and life satisfaction. A total of 2630 high school students agreed to participate. The results of a Confirmatory Factor Analysis support the hypothetical model which, compared with ten alternative models, produced the best fit to the data. Validity and internal consistency were satisfactory. Regression analyses showed different predictive patterns between task-based and self-based goals, although both approaches were adaptive. The three approaches positively predicted life satisfaction. Their implication is discussed from a theoretical framework.
Los objetivos de la investigación han sido dos: (a) examinar la validez estructural de la versión española del Cuestionario de Metas de Logro 3×2 (Elliot, Murayama, y Pekrun, 2011) en el contexto académico no universitario, y (b) analizar los patrones predictivos de las metas de logro sobre la motivación autodeterminada y la satisfacción con la vida. Una muestra de 2630 estudiantes de educación secundaria y bachillerato accede a participar. Los resultados del Análisis Factorial Confirmatorio apoyan el modelo hipotético que, comparado con otros diez modelos alternativos, produce el mejor ajuste a los datos. La validez y la consistencia interna son satisfactorias. Los análisis de regresión señalan patrones predictivos diferenciales entre las metas basadas en la tarea y el yo, si bien ambas metas de aproximación se han mostrado adaptativas. Las tres metas de aproximación predicen positivamente la satisfacción con la vida. Se discute su implicación desde el marco teórico.
The concept of goal, as a self-regulated way of guiding individuals toward future aims, is central in the study of human motivation, and particularly in academic motivation. Achievement goals have been defined as the aims based on competence used to guide behavior (Elliot, 1999). Therefore, competence is the conceptual nucleus of achievement goals. It can be defined as the standard used in assessment and it constitutes a reference to asses if actions are being performed correctly or not.
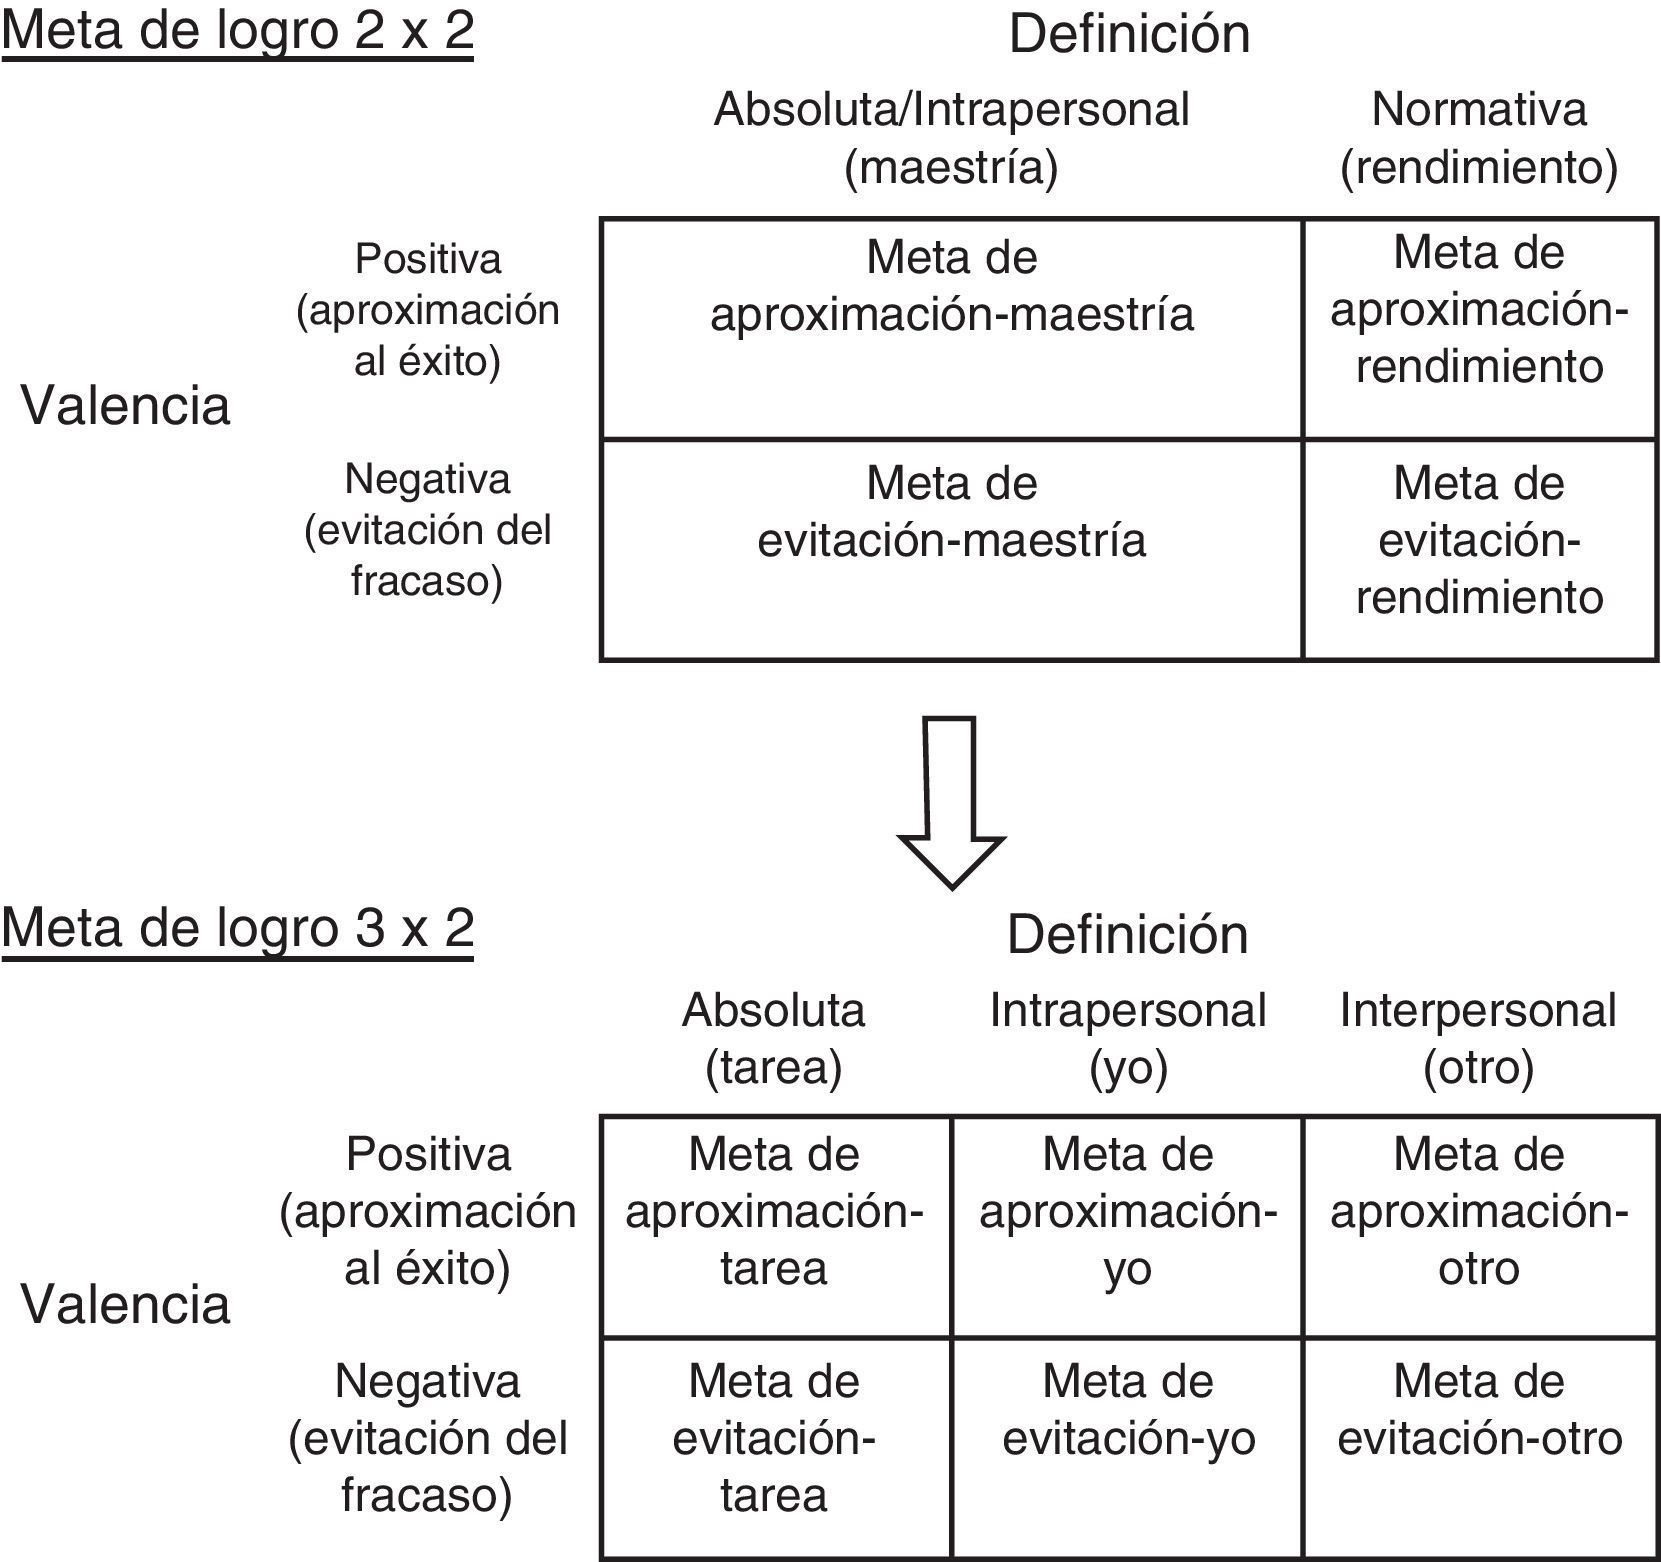
Evolution of the achievement goal models: dichotomic, trichotomic, 2×2 and 3×2The dichotomic model emerged first (i.e., Ames, 1992), which differentiated between mastery and performance goals. Later, it evolved into the trichotomic model, where performance goals were divided between approach and avoidance (i.e., Elliot & Church, 1997). Shortly, Elliott and McGregor (2001) defined the 2×2 framework based on the combination of the two dimensions of competence: definition and valence (Figure 1). Individuals can define their competence in relation to two standards: mastery (intrapersonal) and performance (interpersonal or normative). Valence can be positive or achievement approach or negative or failure avoidance. Both dimensions (definition and valence) can intersect yielding four achievement goals: mastery-approach, mastery-avoidance, performance-approach and performance-avoidance.
 and Elliot et al. (2011).")
Achievement goal framework evolution. Based on Elliot and McGregor (2001) and Elliot et al. (2011).
The four 2×2 types of achievement goals have been associated to different variables (Elliot & McGregor, 2001; Méndez-Giménez, Fernández-Río, & Cecchini, 2015; Van Yperen, 2006). Mastery-approach goals have been linked to positively valenced variables (i.e., high achievement needs, intrinsic motivation or task interest). Performance-approach goals have been related to both positively valenced variables (competence and real performance) and negatively valenced variables (anxiety, worry, negative affect and strained relations). Performance-avoidance goals have been connected to adverse consequences such as negative affect, anxiety, low commitment and task interest. Finally, mastery-avoidance goals adopt a more negative pattern than mastery-approach goals, but more positive than performance-avoidance goals (Elliot & McGregor, 2001).
Elliot et al. (2011) introduce the 3×2 achievement goal model, which identifies one type of goal for each of the three standards used to assess competence: task-based, self-based and other-based. This means separating task goals and self goals. Task-based goals use an absolute standard as the assessment reference: the requirements of the task. Therefore, competence is defined in terms of doing it well or wrong in relation to what the task demands. Self-based goals use an intrapersonal standard as the assessment reference. Consequently, competence is defined in terms of doing it well or wrong in relation to how one has done it in the past or potentially could do it in the future. Other-based goals use a normative and interpersonal standard as the assessment reference. Therefore, competence is defined in terms of doing it well or wrong in relation to others (Murayama, Elliot, & Friedman, 2012).
The 3×2 achievement goals model (Elliot et al., 2011) determines six different achievement goals derived from the combination of the three standards used to define competence and the two types of valence (Figure 1). Task-approach goals, focused on achieving competence through the task (for example, “performing the task correctly”), task-avoidance goals, focused on avoiding incompetence based on the task (for example, “avoiding doing the task incorrectly), self-approach goals, focused on achieving competence based on oneself (for example, “performing better than before”), self-avoidance goals, focused on avoiding incompetence based on oneself (for example, “avoiding performing worse that before”), other-approach goals, focused on achieving competence based on others (for example, “performing better than others”), and other-avoidance goals, focused in avoiding incompetence based on others (for example, “avoiding performing worse than others”).
Connections between achievement goals and relevant outcomesResearch on the links between 3×2 achievement goals and motivational consequences is far from conclusive. Elliot et al. (2011) found consistent adaptive links of the task-approach goals (intrinsic motivation, learning efficacy) and moderate links of the other-approach goals (exam performance, learning efficacy), and the self-approach goals (energy in class). Self-avoidance goals have been negatively linked to energy and absorption in class. Likewise, other-avoidance goals are considered maladaptive because of their negative connections with exam performance, positive with exam worry and a negative tendency toward intrinsic motivation. Brondino, Raccanello, and Pasini (2014) found that task-approach goals positively predict positive emotions and negatively, negative emotions. Self-approach goals positively predict enjoyment. On the other hand, task-avoidance goals negatively predict positive emotions, and other-approach goals positively predict positive emotions (enjoyment, hope, pride). Other-approach goals and self-avoidance goals do not predict any emotion. However, Diseth (2015) concluded that task-approach goals, but also other-approach goals, connect with more functional elements of motivational variables (i.e., self-efficacy, learning strategies), while self goals (both approach and avoidance) show an opposite pattern (i.e., less academic achievement or learning strategies). Despite the fact that there is evidence that task-approach goals offer an advantage on motivational consequences, Diseth (2015) has questioned the positive connections of self-approach goals and has upgraded the value of the other-approach goals, compared to what Elliot and McGregor (2001) found in their performance goals.
The 3×2 Achievement Goal Questionnaire (3×2 AGQ) is a valid tool to assess the six types of achievement goals in college students (Elliot et al., 2011). This questionnaire includes 18 items which focus on the task of completing exams in a certain class. Each item represents the types of achievement goals which students can follow or not to pass a subject in psychology and they are assessed through a 7-point likert scale from 1 (not true of me) to 7 (extremely true of me). The 3×2 has been translated and validated to the Chinese (Wu, 2012), Norwegian (Diseth, 2015), and Hungarian (Urbán, Orosz, Kerepes, & Jánvári, 2014), confirming its structure in all cases. Similarly, it has been adapted to the sport context (Mascret, Elliot, & Cury, 2015) and to physical education (Méndez-Giménez, Cecchini-Estrada, & Fernández-Río, 2014). Up to date, its psychometric properties have not been assessed in the Spanish academic context. Achievement goals are usually assessed in a specific domain, in relation to a specify class, a subject or a matter, but they can be assessed in the general domain (Hulleman, Schrager, Bodman, & Harackewicz, 2010). In the present study, the original scale has been adapted to assess goals adopted by secondary education students when they perform exams in all subjects.
The first goal was to examine the structural validity and the internal reliability of the 3×2 model in the Spanish secondary education academic context using the Spanish version of the 3×2 AGQ. In line with Elliot et al. (2011), the goal is to asses if the six goals represent empirically different constructs and if the 3×2 model offers a better fit to the data than several alternative models. The hypothesis was that the 3×2 model will fit better than the other models. The second goal was to deepen on the relationships between the 3×2 achievement goals and relevant motivational outcome variables in the academic context. The hypothesis was that task-approach and self-approach goals will be more adaptive (i.e., positively linked with the self-determination index and with life satisfaction), while other-approach goals will exhibit adaptive and maladaptive connections (i.e., negatively linked to the self-determination index and positively with life satisfaction). Finally, avoidance strategies will be, generally, maladaptive.
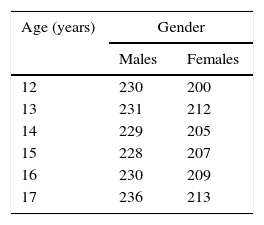
MethodParticipantsA total of 2764 secondary education students from 34 different schools from 17 Spanish provinces (two schools from each province) agreed to participate. Only ten participants did not present the parent's informed consent, and consequently, did not take part in the study. Moreover, 124 questionnaires were disregarded because of inconsistency in the answers or missing data, being the final sample of 2630 participants (52.62% males and 47.38% females). 185 had less than 8% of missing data. Therefore, they were imputed with values derived from a multiple regression in which three item scores from the same congeneric set of indicators were used as the predictor variables (Bentler, 2005). A stratified random sampling technique was used on each province, school and grade. A simple random sampling was performed on the Spanish Ministry of Education schools’ list. Fourteen students per grade on each school were asked to answer the questionnaire, using random sampling on the school's student list. The number of participants per province was between 158 and 164. The age range was 12–17 years, with a mean age of 14.39 years (SD=1.18). Table 1 shows participants’ distribution based on gender and age, and it is homogeneous χ2 (5)=17.17, p<.01.
ProcedureA back-to-back translation of the items of the 3×2 AGQ from Elliot et al. (2011), under the supervision of two experts, to assess its similarity with the original scale (Table 2 shows the final version). The schools were contacted to obtain permission from principals and parents. Several preliminary tests were conducted to assess item comprehension in small samples. Prior to data collection, participating teachers were informed of the protocol to be used to fill out the questionnaires. They were completed during a regular class (30min), online using Google Forms. Teachers insisted that participation was voluntary and that all answers were kept confidential and they did not affect school grades. All data was analyzed using SPSS 20.0 and EQS 6.2.
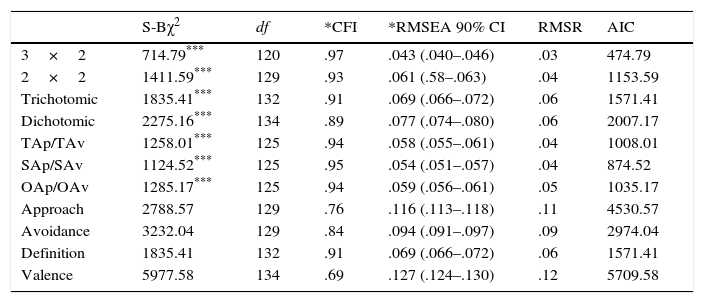
Comparison of fit indices of the hypothesized model with the alternative models
| S-Bχ2 | df | *CFI | *RMSEA 90% CI | RMSR | AIC | |
|---|---|---|---|---|---|---|
| 3×2 | 714.79*** | 120 | .97 | .043 (.040–.046) | .03 | 474.79 |
| 2×2 | 1411.59*** | 129 | .93 | .061 (.58–.063) | .04 | 1153.59 |
| Trichotomic | 1835.41*** | 132 | .91 | .069 (.066–.072) | .06 | 1571.41 |
| Dichotomic | 2275.16*** | 134 | .89 | .077 (.074–.080) | .06 | 2007.17 |
| TAp/TAv | 1258.01*** | 125 | .94 | .058 (.055–.061) | .04 | 1008.01 |
| SAp/SAv | 1124.52*** | 125 | .95 | .054 (.051–.057) | .04 | 874.52 |
| OAp/OAv | 1285.17*** | 125 | .94 | .059 (.056–.061) | .05 | 1035.17 |
| Approach | 2788.57 | 129 | .76 | .116 (.113–.118) | .11 | 4530.57 |
| Avoidance | 3232.04 | 129 | .84 | .094 (.091–.097) | .09 | 2974.04 |
| Definition | 1835.41 | 132 | .91 | .069 (.066–.072) | .06 | 1571.41 |
| Valence | 5977.58 | 134 | .69 | .127 (.124–.130) | .12 | 5709.58 |
OAp/OAv: other-approach/other-avoidance, SAp/SAv: self-approach/self-avoidance, TAp/TAv: task-approach/task-avoidance.
The Spanish version of the 3×2 AGQ from Elliot et al. (2011) was used. The stem was changed to: “My goals on the exams of the subjects that I am taking are…” (Table 2).
Academic motivationThe Spanish version of the Academic Motivation Scale (AMS) from Vallerand et al. (1992), validated for Spanish secondary education contexts by Núñez et al. (2010). It includes 28 items distributed in seven scales: amotivation (i.e., “I used to have good reasons for coming to the school, but no I ask myself if it is worthy”), external regulation (i.e., “to obtain a prestigious job”), introjected regulation (i.e., “because I want to prove myself that I can finish school”), identified regulation (i.e., “because I think that the education I am getting will improve my working competence”), intrinsic motivation to knowledge (i.e., “because I feel pleasure and satisfaction when I learn new things”), intrinsic motivation to achievement (i.e., “for the pleasure that I feel when I get good grades), intrinsic motivation to stimulating experiences (i.e., “because I am excited when I read about the topics that I like”). Each subscale includes four items which refer to reasons why students go to school. Participants answer in a 7-point likert scale from (1) not at all, to (7) totally. The self-determination index (SDI) is calculated using the following formula: [2×(IM to knowledge+IM to achievement+IM to stimulating experiences)/3+Identified Reg.]−[Introjected Reg.+External Reg.)/2+(Amotivation×2)].
Life satisfactionThe questionnaire developed by Diener, Emmons, Larsen, and Griffin (1985) was used. It is composed of a single factor and five items (i.e., “If I could live my life again, I would like everything to be the same). This instrument has been validated for Spanish contexts by Cabañero et al. (2004) and it uses a 5-point likert scale from (1) strongly disagree to (5) strongly agree.
Data analysisAnalyses were conducted using SPSS 22.0 and EQS 6.2 programs. The original model was assessed using a confirmatory factor analysis. The sample was not normally distributed. Consequently, the Satorra-Bentler chi-square (S-Bχ2) and the robust standard estimates instead of the maximum likelihood method chi-square (MLχ2). Evaluation of the goodness-of-fit to the simple data was determined using the incremental fit index *CFI (Comparative Fit Index); the *RMSEA (Root Mean Square Error Approximation) and the RMSR (Root Mean Square Residual) were used as absolute fit indexes. The *CFI is the robust version of the CFI and its computation is based on the S-Bχ2 (a score of .95 indicates a good fit). The *RMSEA is the robust version of the RMSEA and takes into account into account the error of approximation in the population (scores below .05 indicate a good fit). Additionally, a 90% confidence interval for RMSEA was used. Finally, a RMSR score below .08 indicates a good fit.
Regression analyses: Achievement goals as predictive variablesSeveral multiple hierarchical regression analyses (stepwise) were performed to examine the achievement goals as predictive variables of self-determined motivation and life satisfaction, separately (dependent variables). According to the theoretical framework, the goals were introduced in four blocks following the next order: task-approach, self-approach, other-approach and avoidance goals. Each of the approach goals have been found important, while the avoidance goals have been found less relevant in the prediction outlined. This is the reason why they were included at the same time in the fourth block. The basic model used in these analyses was the 3×2 model. Preliminary analyses showed that the variance inflation factor (VIF) for the achievement goals varied between 2.06 and 2.97 (below the cut off criteria of 10) and the tolerance scores ranged between .33 and .48, which indicates the absence of multicollinearity. The Durbin-Watson score was 1.84 and 1.89, respectively. Scores between 1 and 3 are acceptable for error independence.
ResultsComparison of the hypothesized model (3×2) with alternative modelsThe method used by Elliot et al. (2011) to compare the fit to the hypothesized model (3×2) with ten alternative models was used: (1) the 2×2 model, where goals based on the other load in its latent hypothetical factors, while the goals of the same valence based on the task and on the self load together in joint latent factors; (2) the trichotomic model, where goals based on the other load together in their hypothesized latent factors, but the goals based on the task and based on the self load together in a joint latent factor; (3) the dichotomic model, where the goals based on the other load together in a joint latent factor, and the goals based on the task and on the self load together in another joint latent factor; (4) the TAp/TAv (task-approach/task-avoidance), where all items load in their hypothesized factors, except the task-approach and task-avoidance items that load together in a joint latent factor; (5) the SAp/SAv (self-approach/self-avoidance), where all items load in their hypothesized latent factors, except the self-approach and self-avoidance items, which load together in a joint latent factor; (6) the OAp/OAv (other-approach/other-avoidance), where all items load in their hypothesized latent factors, except the other-approach and other-avoidance items, which load together in a joint latent factor; (7) the approach model, where all avoidance items load in their hypothesized latent factors, but all the approach items load together in a joint latent factor; (8) the avoidance model, where all approach items load in their hypothesized latent factors, but all avoidance items load together in a joint latent factor; (9) the definition model, where all competence items load together in joint latent factors, and (10) the valence model, where all items that share the valence load together in joint latent factors. The Akatike information criterion (AIC) was used to compare the hypothesized model with the alternative ones (Kline, 2005). Values in the chi-square difference test significantly larger than 0 in an alternative model indicate that the alternative model provides a worse fit to the data. Lower values in the AIC indicate a better fit.
Table 2 shows the goodness of fit indices of the different models and it indicates that the hypothesized model (3×2) shows a better fit than the rest of the alternative models. All the standardized factor loadings range between moderate to strong (.64–.90) and each fit index satisfy the criteria for a good fit to the model.
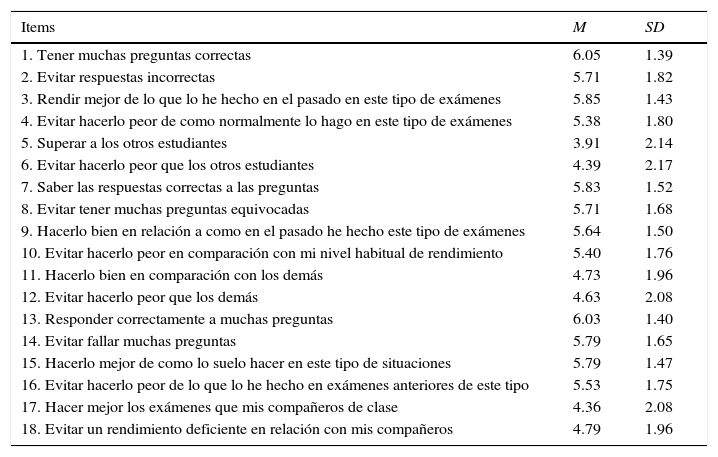
Descriptive dataTable 3 shows descriptive statistics of all items of the 3×2 achievement goal questionnaire.
Means and standard deviations of the questionnaire
| Items | M | SD |
|---|---|---|
| 1. Tener muchas preguntas correctas | 6.05 | 1.39 |
| 2. Evitar respuestas incorrectas | 5.71 | 1.82 |
| 3. Rendir mejor de lo que lo he hecho en el pasado en este tipo de exámenes | 5.85 | 1.43 |
| 4. Evitar hacerlo peor de como normalmente lo hago en este tipo de exámenes | 5.38 | 1.80 |
| 5. Superar a los otros estudiantes | 3.91 | 2.14 |
| 6. Evitar hacerlo peor que los otros estudiantes | 4.39 | 2.17 |
| 7. Saber las respuestas correctas a las preguntas | 5.83 | 1.52 |
| 8. Evitar tener muchas preguntas equivocadas | 5.71 | 1.68 |
| 9. Hacerlo bien en relación a como en el pasado he hecho este tipo de exámenes | 5.64 | 1.50 |
| 10. Evitar hacerlo peor en comparación con mi nivel habitual de rendimiento | 5.40 | 1.76 |
| 11. Hacerlo bien en comparación con los demás | 4.73 | 1.96 |
| 12. Evitar hacerlo peor que los demás | 4.63 | 2.08 |
| 13. Responder correctamente a muchas preguntas | 6.03 | 1.40 |
| 14. Evitar fallar muchas preguntas | 5.79 | 1.65 |
| 15. Hacerlo mejor de como lo suelo hacer en este tipo de situaciones | 5.79 | 1.47 |
| 16. Evitar hacerlo peor de lo que lo he hecho en exámenes anteriores de este tipo | 5.53 | 1.75 |
| 17. Hacer mejor los exámenes que mis compañeros de clase | 4.36 | 2.08 |
| 18. Evitar un rendimiento deficiente en relación con mis compañeros | 4.79 | 1.96 |
Task-approach: 1, 7, 13.
Task-avoidance: 2, 8, 14.
Self-approach: 3, 9, 15.
Self-avoidance: 4, 10, 16.
Other-approach: 5, 11, 17.
Other-avoidance: 6, 12, 18.
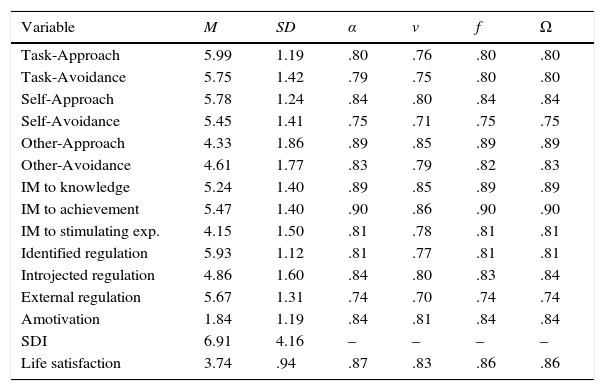
Table 4 shows descriptive statistics, ranges and internal consistencies of the different variables: achievement goal, motivational regulations, SDI and life satisfaction. Internal consistency was adequate, ranging between α=.75 for self-avoidance goals, and α=.89 for other-approach goals. Motivational regulations and life satisfaction internal consistency was also acceptable.
Descriptive statistics and internal consistency
| Variable | M | SD | α | v | f | Ω |
|---|---|---|---|---|---|---|
| Task-Approach | 5.99 | 1.19 | .80 | .76 | .80 | .80 |
| Task-Avoidance | 5.75 | 1.42 | .79 | .75 | .80 | .80 |
| Self-Approach | 5.78 | 1.24 | .84 | .80 | .84 | .84 |
| Self-Avoidance | 5.45 | 1.41 | .75 | .71 | .75 | .75 |
| Other-Approach | 4.33 | 1.86 | .89 | .85 | .89 | .89 |
| Other-Avoidance | 4.61 | 1.77 | .83 | .79 | .82 | .83 |
| IM to knowledge | 5.24 | 1.40 | .89 | .85 | .89 | .89 |
| IM to achievement | 5.47 | 1.40 | .90 | .86 | .90 | .90 |
| IM to stimulating exp. | 4.15 | 1.50 | .81 | .78 | .81 | .81 |
| Identified regulation | 5.93 | 1.12 | .81 | .77 | .81 | .81 |
| Introjected regulation | 4.86 | 1.60 | .84 | .80 | .83 | .84 |
| External regulation | 5.67 | 1.31 | .74 | .70 | .74 | .74 |
| Amotivation | 1.84 | 1.19 | .84 | .81 | .84 | .84 |
| SDI | 6.91 | 4.16 | – | – | – | – |
| Life satisfaction | 3.74 | .94 | .87 | .83 | .86 | .86 |
Note: α: Cronbach's alpha, v: average variance extracted, f: composite reliability, Ω: McDonald's omega.
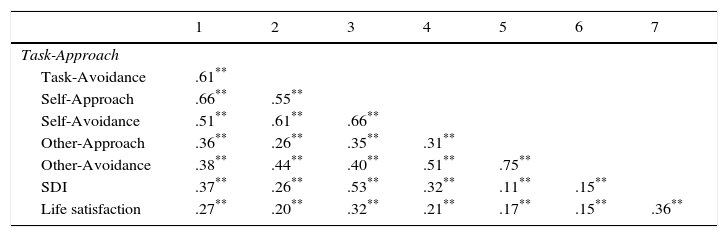
Table 5 shows bivariate correlations among achievement goals, SDI and life satisfaction. Most of the correlations among achievement goals are positive and moderate, ranging from r=.26 in self-approach and task-avoidance to r=.75 on both “other” goals. On the other hand, goals based on “other” show the lowest correlations with SDI and life satisfaction.
Bivariate correlations among variables
| 1 | 2 | 3 | 4 | 5 | 6 | 7 | |
|---|---|---|---|---|---|---|---|
| Task-Approach | |||||||
| Task-Avoidance | .61** | ||||||
| Self-Approach | .66** | .55** | |||||
| Self-Avoidance | .51** | .61** | .66** | ||||
| Other-Approach | .36** | .26** | .35** | .31** | |||
| Other-Avoidance | .38** | .44** | .40** | .51** | .75** | ||
| SDI | .37** | .26** | .53** | .32** | .11** | .15** | |
| Life satisfaction | .27** | .20** | .32** | .21** | .17** | .15** | .36** |
SDI: self-determination index.
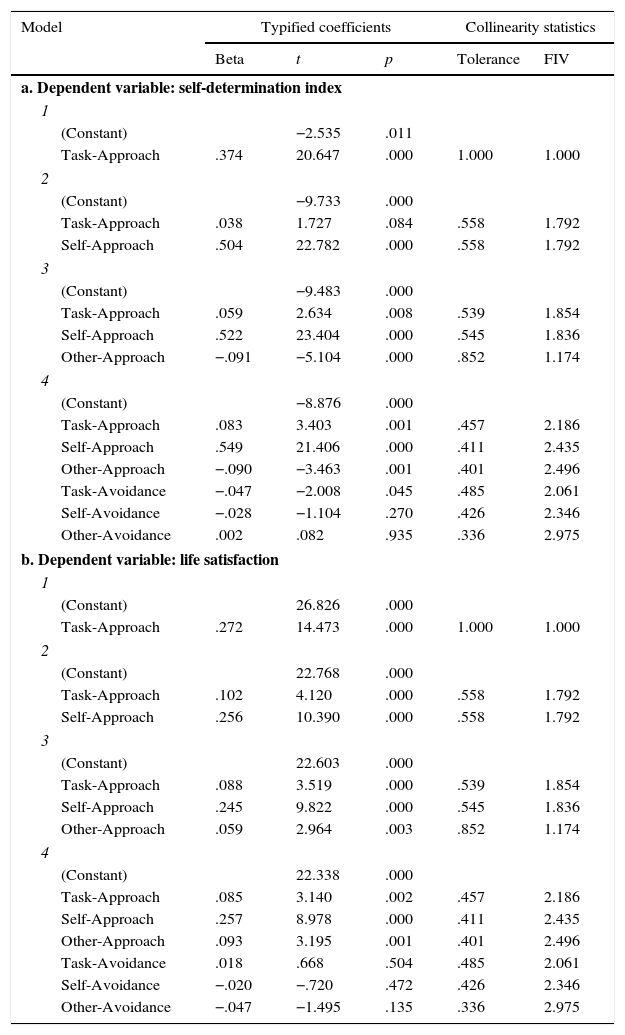
The SDI regression in the 3×2 model has revealed that task-approach goals F(6, 2620)=179.29, (β=.08; p=.001), and self-approach goals (β=.55; p<.001) are positive predictors of the SDI, while other-approach goals (β=−.09, p=.001) and task-avoidance goals (β=−.05, p=.045) are negative predictors. Self-avoidance goals and other-avoidance goals are not statistically significant predictors. Each one of the models explained 14%, 28.2%, 28.9% and 29.1% of the SDI variance, respectively (Table 6).
Regression analyses coefficient
| Model | Typified coefficients | Collinearity statistics | |||
|---|---|---|---|---|---|
| Beta | t | p | Tolerance | FIV | |
| a. Dependent variable: self-determination index | |||||
| 1 | |||||
| (Constant) | −2.535 | .011 | |||
| Task-Approach | .374 | 20.647 | .000 | 1.000 | 1.000 |
| 2 | |||||
| (Constant) | −9.733 | .000 | |||
| Task-Approach | .038 | 1.727 | .084 | .558 | 1.792 |
| Self-Approach | .504 | 22.782 | .000 | .558 | 1.792 |
| 3 | |||||
| (Constant) | −9.483 | .000 | |||
| Task-Approach | .059 | 2.634 | .008 | .539 | 1.854 |
| Self-Approach | .522 | 23.404 | .000 | .545 | 1.836 |
| Other-Approach | −.091 | −5.104 | .000 | .852 | 1.174 |
| 4 | |||||
| (Constant) | −8.876 | .000 | |||
| Task-Approach | .083 | 3.403 | .001 | .457 | 2.186 |
| Self-Approach | .549 | 21.406 | .000 | .411 | 2.435 |
| Other-Approach | −.090 | −3.463 | .001 | .401 | 2.496 |
| Task-Avoidance | −.047 | −2.008 | .045 | .485 | 2.061 |
| Self-Avoidance | −.028 | −1.104 | .270 | .426 | 2.346 |
| Other-Avoidance | .002 | .082 | .935 | .336 | 2.975 |
| b. Dependent variable: life satisfaction | |||||
| 1 | |||||
| (Constant) | 26.826 | .000 | |||
| Task-Approach | .272 | 14.473 | .000 | 1.000 | 1.000 |
| 2 | |||||
| (Constant) | 22.768 | .000 | |||
| Task-Approach | .102 | 4.120 | .000 | .558 | 1.792 |
| Self-Approach | .256 | 10.390 | .000 | .558 | 1.792 |
| 3 | |||||
| (Constant) | 22.603 | .000 | |||
| Task-Approach | .088 | 3.519 | .000 | .539 | 1.854 |
| Self-Approach | .245 | 9.822 | .000 | .545 | 1.836 |
| Other-Approach | .059 | 2.964 | .003 | .852 | 1.174 |
| 4 | |||||
| (Constant) | 22.338 | .000 | |||
| Task-Approach | .085 | 3.140 | .002 | .457 | 2.186 |
| Self-Approach | .257 | 8.978 | .000 | .411 | 2.435 |
| Other-Approach | .093 | 3.195 | .001 | .401 | 2.496 |
| Task-Avoidance | .018 | .668 | .504 | .485 | 2.061 |
| Self-Avoidance | −.020 | −.720 | .472 | .426 | 2.346 |
| Other-Avoidance | −.047 | −1.495 | .135 | .336 | 2.975 |
The life satisfaction regression in the 3×2 model has showed that task-approach goals F(3, 2623)=209.45, (β=.08; p=.002), self-approach goals (β=.26; p<.001) and other-approach goals (β=.09; p=.001) are positive predictors of life satisfaction. Task-avoidance, self-avoidance and other-avoidance goals are not predictors. Each one of the models explained 4.4%, 11%, 11.3% and 11.5% variance of the dependent variable, respectively (Table 6).
DiscussionThe goal of the present study was to examine the structural validity and the psychometric properties of the 3×2 achievement goal questionnaire in the secondary education academic context, and explore the connections among the six achievement goals. It tries to answer Elliot et al. (2011) claim of extending their original research (focused on psychology college students) to younger individuals in different educational contexts. A wide sample of Spanish adolescent students informed of their achievement goals in their general academic context. Data from the six achievement goals is reliable and the hypothesized model provides a good fit. Furthermore, regarding the first hypothesis, the 3×2 model provides a better fit than the alternative models (2×2, dichotomic, trichotomic, among others). Results provide additional support for the separation of the task and self goals, and confirm the 3×2 achievement goal model in adolescence. Our results are in line with the ones obtained by Wu (2012) in secondary education Chinese students, and Urbán et al. (2014) in Hungarian university students. The present study focused on the goals adopted by students when they face their exams globally, not in a specific subject. Students’ goal orientations are based in the combination of a personal tendency and the specificity of a subject matter. Nevertheless, Jansen, Hornstra, Prins, Peetsma, and Veen (2015) found that students’ goal profiles have a general subject profile. Around 60% of students showed similar profiles in different subjects, which supports the idea that goal orientation profiles can be considered stable tendencies.
Correlations among achievement goals have been found positive and moderate, in line with those reported by Elliot et al. (2011) and bit lower than those of Urbán et al. (2014). As in previous studies (Diseth, 2015), some factors yielded higher correlations: specially other-approach an other-avoidance goals. However, these factors could be considered equal. Murayama, Elliot, and Yamagata (2011) conducted a profound analysis to distinguish approach and avoidance performance goals, and despite the moderate to high positive correlation found, they have supported the need to differentiate both constructs. Previous research has showed that all achievement goals correlate higher among younger students than college students (Bong, 2009).
A surprising result was that the six achievement goals positively correlated with both SDI and life satisfaction. Each factor, independently, produce positive effects on the outcome variables. However, their effects become negative (i.e., task-avoidance in regression on SDI) or not significant (i.e., self-avoidance and other-avoidance in the regression on life satisfaction) when all predictors are introduced at the same time. Previous research has found similar results (Elliot et al., 2011). A possible explanation could be that considering these positive correlations among different goals, avoidance in the bivariate correlation analysis becomes positively associated with the outcome variables, because it implies a simultaneous orientation to the approach goals. However, when the approach effects are controlled (are maintained constant), the “pure” avoidance effect becomes not significant or even negative. However, the interpretation of these effects should be done carefully and assessed in future research.
Participants presented higher approach goals than avoidance goals, except on self-approach goals. In line with American and German students (Elliot et al., 2011), participants were: first, task oriented, second, self-oriented and third, other oriented, which suggest a tendency to adopt absolute standards as a reference in exams. However this tendency could be influenced by cultural elements. David (2014) informed that the Filipino students tend to adopt an achievement goal profile oriented toward intrapersonal assessment standards. Future research works should try to assess if cultural diversity leads to differences in the adoption of task goals or self goals among students. In the present study, the 3×2 achievement goals scores were higher than those reported among Italian and Filipino college students (Brondino et al., 2014; David, 2014) and similar to those reported for American and German college students (Elliot et al., 2011). The only published study on adolescents (Wu, 2012) reported lower scores on task and self goals, and similar on other goals.
The second goal of the present study was to deepen on the relationship among the 3×2 achievement goals and relevant outcome motivational variables. In line with the theoretical framework, task-approach and self-approach goals were shown as adaptive, positively predicting students’ self-determined motivation and life satisfaction. The other-approach goals also predicted positively life satisfaction, but they join task-avoidance goals as negative predictors of self-determined motivation, which partially contradict Diseth's (2015) assumptions.
These results are consistent with those found by Elliot et al. (2011) on the task-approach goals and intrinsic motivation, and partially congruent with those obtained by Yang and Cao (2013) in the e-learning context, which showed that self-approach goals predict intrinsic motivation. In the physical education context, Méndez-Giménez et al. (2014) informed of a stronger adaptive pattern on the task-approach goals than the self-approach and other goals. In the sport context, Mascret et al. (2015) showed positive connections of the task-approach goals with more outcome variables (intrinsic interest and perceived competence) than self-approach goals (intrinsic interest) or other-approach goals (perceived competence).
On the other hand, task-avoidance goals negatively predict the SDI, but not the self-avoidance goals, which reinforce the branching promoted by the 3×2 model (Elliot et al., 2011). In the Méndez-Giménez et al. (2014) study, other-avoidance goals emerge as negative predictors. Both findings indicate that avoidance goals should not be promoted. Future studies should try to clarify to what extent goals connect negatively with motivational outcomes.
Comparing the 2×2 and the 3×2 models, results are consistent with Van Yperen's (2006) ideas, but they shed some more light. Both task-approach and self-approach goals (mastery-approach in the 2×2 model) have been positively linked to positive outcomes. Other-approach goals (performance approach) have been positively associated with positive valenced variables (i.e., life satisfaction), but negatively with positive variables (i.e., SDI). Other-avoidance goals (performance-avoidance in the 2×2 model) have been negatively connected with positive outcomes (i.e., life satisfaction). Finally, the branching task-avoidance and self-avoidance goals (performance-avoidance) allowed us to deepen in a differentiate pattern of relations (negative or neutral).
In light of the findings, several pedagogical implications are suggested: secondary education teachers should promote class climates and assessment procedures that foster task-approach and self-approach goals to increase the most self-determined types of motivation and students well-being. This means helping the student focus on the task and his/her own intrapersonal path as competence benchmarks and face both challenges successfully.
A first limitation of the study is the number of variables introduced in the regression analyses. This could have produced a restricted pattern of relations. A second limitation is the research design used, since it does not allow for causal links. Future research should explore the structural validity of this tool with primary education students, examine the evolution of the 3×2 achievement goals in the academic context during the infancy-adolescence transition and discover if the findings of the present study can be generalized with other relevant motivational-affective variables in the academic context. Another issue to assess is the interaction of the goals when they are adopted simultaneously. How the six goals combine should be explored and assess the most adaptive 3×2 goal profiles in a large number of outcome variables. Finally, it would be advisable to explore the validity of the 3×2 framework in adolescents of different countries and cultures.
Please cite this article as: Méndez-Giménez A, Cecchini-Estrada J-A, Fernández-Río J, Mendez-Alonso D, Prieto-Saborit J-A. Metas de logro 3×2, motivación autodeterminada y satisfacción con la vida en educación secundaria. Rev Psicodidáct. 2017;22:150–156.
