

To associate the nutritional status and the self-perception of nutritional status with the use of licit drugs among adolescents.
MethodsA cross-sectional study was conducted in which 210 adolescents answered a questionnaire on alcohol and tobacco experimentation and self-perceptions about their nutritional status. The correspondence between the adolescents’ perception of their own nutritional status and actual nutritional status was analyzed, as well as associations between nutritional status, self-perception of nutritional status, gender, age, and presence of smokers at home with alcohol and tobacco use. The variables were analyzed separately in a bivariate analysis and, subsequently, a multivariate analysis determined the factors associated with drug use.
ResultsThe study included 210 adolescents with a median age of 148 months; 56.6% were females. Of the total sample, 6.6% have tried cigarettes, and 20% have tried alcohol; 32.3% had BMI Z-Score≥1, 12.85% had BMI Z-Score≥2, and 50.7% had a correct perception of his/her weight. After a multivariate analysis, only the self-perception about weight statistically influenced experimentation of tobacco, and patients who identified themselves as having very high weight were more likely to experiment tobacco (odds ratio (OR) 13.57; confidence interval (95% CI) 2.05–89.8; p=0.007); regarding alcohol use, adolescents who identified themselves as having high weight were 2.4 times more likely to experiment with alcohol than adolescents that identified themselves as having normal weight (95% CI 1.08–5.32, p=0.031).
ConclusionsAdolescents with self-perception of excess weight may constitute a risk group for alcohol and tobacco use.
Associar o estado nutricional e a autopercepção do estado nutricional com a experimentação de drogas lícitas em adolescentes.
MétodosEstudo transversal no qual 210 adolescentes responderam a um questionário sobre experimentação de álcool e tabaco e sobre suas autopercepções nutricionais. Foi analisada a concordância entre autopercepção nutricional do adolescente e seu estado nutricional, bem como associações entre o estado nutricional, a autopercepção nutricional, sexo, idade e presença de tabagistas em casa com a experimentação de álcool e tabaco. As variáveis foram analisadas separadamente em análise bivariada e, a seguir, análise múltipla determinou fatores associados à experimentação.
ResultadosParticiparam do estudo 210 adolescentes com mediana de idade de 148 meses, 56,6% do sexo feminino. Do total da amostra, 6,6% já experimentaram cigarro e 20% já experimentaram álcool; 32,3% tinham Z-escore IMC≥1 e 12,85% tinham Z-escore IMC≥2 e 50,7% acertaram suas classificações nutricionais. Após análise multivariada, apenas a autoimagem sobre o peso influenciou estatisticamente na experimentação de fumo. Pacientes que se identificavam com peso muito alto apresentaram maior chance de experimentação de fumo (odds ratio (OR) 13,57; intervalo de confiança (95% IC) 2,05–89,8; p=0,007); em relação ao uso de álcool, adolescentes que se identificavam com peso alto apresentaram chance de uso de álcool 2,40 vezes maior do que crianças que se viam com peso normal (IC 95% 1,08–5,32; p=0,031).
ConclusõesAdolescentes com autopercepção de excesso de peso podem constituir um grupo de risco para a experimentação de álcool e tabaco.
There has been a significant increase in the number of overweight children and adolescents in the last two decades worldwide.1–3 In Brazil, when comparing data between 1975 and 2010 in the age group between 10 and 19 years, excess weight increased from 3.7% to 21.7% in boys and 7.6% to 19% in girls. According to the Brazilian Institute of Geography and Statistics (Instituto Brasileiro de Geografia e Estatística – IBGE) data, 34.8% of boys and 32% of girls were overweight and 16.6% of boys and 11.8% of girls were obese in 2010.4
Obesity has become the most prevalent chronic non-communicable disease in children and adolescents, with major future effects on health.5 Excess weight in this population is associated with the occurrence of type 2 diabetes mellitus and cardiovascular disease, increased prevalence of obesity and increased morbidity and mortality in adulthood, as well as increased risk of psychosocial problems and psychological abuse at school.6–10
Adolescence should be seen as a phase of growth and development, characterized by transformation. It is a stage of human life characterized by biological, psycho-emotional and socio-cultural changes that constitute an important period to implement new practices, behaviors and gain autonomy.11 The discrepancy between these changes may contribute to the adolescents’ dissatisfaction with their bodies and lead to risky behaviors and vulnerability. Previous studies have suggested that adolescents generally perceive their nutritional status inappropriately12,13; most often, this population tends to underestimate their own nutritional status, especially those who are overweight. However, in recent years, there has been a change in the perception of adolescent nutritional status, more prone to overestimation and the habit of dieting, especially girls, reflecting the consequences of the ideal thin body glorified by society.12,13
The normal adolescence syndrome consists of important features such as the search for one's identity, group trends, mood swings, the evolution of sexuality and separation from parents, among others.11 These characteristics may interfere with the perception that adolescents have about their own nutritional status and thus, with their degree of satisfaction with their own body image.14
The adolescent dissatisfied with his/her body image can resort to risky behaviors, such as very restrictive diets, practice of unsafe sex and use of licit and illicit drugs in order to change one's body or to be more accepted by their peers15,16 Every year, millions of adolescents around the world lose their lives, most due to automobile accidents, suicide and homicide,17 often associated with the consumption of alcohol or other drugs.
It is known that early use of licit drugs constitutes an immediate hazard to the adolescent's health.18 Some studies have suggested that when experimenting with illicit drugs in adolescence is associated with other risk factors, such as family history of substance abuse, practice of other risk behaviors, substance abuse among peers, lack of interest in school activities, among others, it can be the first step toward the abuse of these drugs or experimenting with illicit drugs in the future.18,19
In Brazil, there have been few studies to verify the association between nutritional status and the adolescent's self-perception of his/her nutritional status and experimentation of licit drugs, and few studies have associated the adolescent's perception of the nutritional status with nutritional diagnostic criteria. Our goal is to verify the association between excess weight or self-perception of excess weight and experimentation with alcohol and tobacco in adolescence.
MethodThis is a cross-sectional study carried out from February to March 2010 in the emergency department of the University Hospital at the University of Sao Paulo – USP (HU – USP).
The nutritional status of 210 adolescents aged 10–14 years, whose legal guardian had sought hospital care for the adolescent, was evaluated. A convenience sample was used, with the inclusion of one adolescent per hour, from 1 PM to 7 PM, from Monday to Friday, during the study period.
The emergency department where the study was carried out belongs to a secondary hospital, of low complexity, with rare cases of patients presenting with chronic underlying diseases. The study excluded adolescents who, at the time of the treatment, had diarrhea and/or vomiting complaints, patients with chronic diseases (including asthma), changes in the general status on admission and adolescents that during or shortly after treatment, showed worsening in the general status or were referred for emergency care observation. The most frequent complaints were colds and flu, hoarseness, sore throat, ear pain, conjunctivitis, urinary complaints, menstrual cramps, headache, acute skin changes and mild trauma.
The adolescents were included in the study after the free and informed consent form was signed by a parent or legal guardian, and after the adolescent agreed to participate in the study and answer the questionnaire. All participants had the weight measured using a Toledo electronic scale, model 2096 PP/2, series 10113407, 2007 (Toledo®, São Paulo, Brazil), with a precision of 50g and capacity of 200kg, calibrated by a specialized company according to the criteria of the National Institute of Metrology, Quality and Technology (INMETRO).
Height was measured using a fixed Tonelli aluminum stadiometer, model E 150 A (Tonelli®, Santa Catarina, Brazil), with a precision of 1mm and measurement capacity of 400–2200mm. The measurements were performed in triplicate and the mean value was used to calculate the body mass index (BMI), using the formula: weight in kg/height.2
The adolescents answered a questionnaire that consisted of the following questions: (1) Do you attend school? (2) What grade are you in? (3) Have you ever smoked? (4) Do you smoke regularly? If yes, how many cigarettes do you smoke a day? (5) Do you live with someone who smokes? (6) Have you ever drunk alcohol? (7) Do you drink alcohol regularly? If yes, how often do you drink alcohol? and (8) What do you think of your weight? Five answers were offered for this last question, which included the following alternatives: (1) very low; (2) low; (3) it is OK as it is; (4) high and (5) very high. The answer “I do not know” was made available to all questions, but disregarded in the analysis.
The questionnaire was completed by the adolescents in a private room, so that responses were not influenced by the presence of the parent/guardian. The questionnaires were answered in the presence of the researcher for any clarification of doubts; however, without interfering with the responses.
The World Health Organization (WHO) criteria were used for the nutritional diagnosis. The adolescents’ responses about their nutritional status were evaluated together with the WHO diagnostic criteria, using BMI Z-score according to gender. The study found that the adolescent got a correct classification of his/her nutritional status in the following situations: BMI Z-score <−3 and the answer about his/her own weight was “Very Low”; BMI Z-score between −3 and −2 and the answer was “Low”; BMI Z-score between −2 and +1 and the answer was “It's OK as it is”; BMI Z-score between +1 and +2 and the answer was “High”; and BMI-Z score >+2 and the answer was “Very High”.
The answers obtained from the questionnaires were first described and categorized according to the adolescent's gender. The responses on the nutritional status were compared with the objective nutritional classification to assess the adolescents’ self-perception, initially in the whole sample, and then, according to gender. We also analyzed the association between the adolescent's nutritional status and alcohol or tobacco experimentation, and between the adolescent's nutritional self-classification and experimentation of the same licit drugs.
The quantitative characteristics were described according to the consumption of alcohol and tobacco with the use of summary measures (mean, standard deviation, median, minimum and maximum values) and compared between groups using Student's t-tests. The assessed qualitative characteristics were described according to the consumption of alcohol and tobacco with the use of absolute and relative frequencies and significant associations were verified using the chi-square test or Fisher's exact test. The odds ratio (OR) of each variable of interest with the use of alcohol and tobacco was estimated with the respective 95% confidence intervals, using simple logistic regression.
Multiple logistic regression models were estimated for consumption of alcohol and tobacco, selecting the variables that showed significance levels <0.20 (p<0.20) in the bivariate tests. The tests were performed with a 5% significance level. This study was approved by the Research Ethics Committee of Hospital Universitário da USP (registration CEP/HU-USP 868/09).
ResultsA total of 210 adolescents aged 10–14 years, with a median age of 148 months, were included in the study. Of these, 56.6% were females and all attended school, with 79.2% of adolescent males and 62.3% of females being enrolled between the 5th and 7th grades of Elementary School.
Regarding the experimentation of licit drugs, 6.6% had tried cigarettes, 0.95% smoked regularly (at least one cigarette a day) and 44.7% lived with at least one smoker in the house. As for alcohol, 20% had tried it, and 0.48% drank regularly (one adolescent reported drinking alcohol once a week).
Regarding the adolescents’ nutritional classification, 32.3% had BMI Z-score ≥1, of which 50% were boys and 12.85% had BMI Z-score ≥2, of which 51.8% of them were boys. Of the 210 adolescents who participated in the study, seven were unable to classify their nutritional status, choosing the answer “I do not know”; these responses were not considered in the analysis, thus totaling 203 adolescents. Of these, 50.7% correctly classified their nutritional status. Of those that incorrectly classified their nutritional status, 69% underestimated, whereas 31% overestimated their own nutritional status.
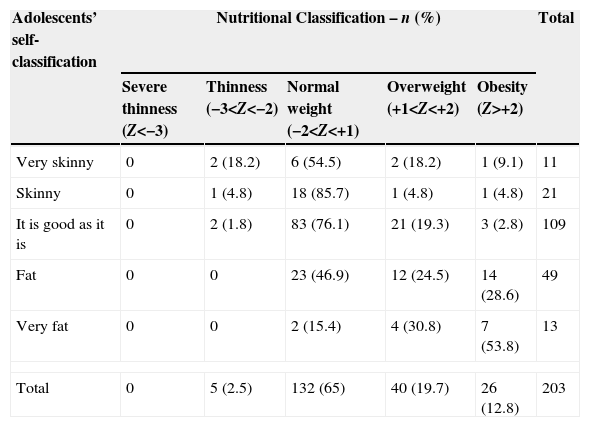
Among the adolescents that classified themselves as having high weight, 24.5% actually had BMI Z-score between +1 and +2. Of those that classified themselves as having very high weight, 53.8% were obese (BMI Z-score>+2). Among the adolescents with excess weight (Z-score>+1) and who incorrectly classified their nutritional status, 65.1% underestimated it, as shown in Table 1.
Adolescents’ own opinions on their nutritional status and their objective nutritional classification according to body mass index Z-score (Z).
| Adolescents’ self-classification | Nutritional Classification – n (%) | Total | ||||
|---|---|---|---|---|---|---|
| Severe thinness (Z<−3) | Thinness (−3<Z<−2) | Normal weight (−2<Z<+1) | Overweight (+1<Z<+2) | Obesity (Z>+2) | ||
| Very skinny | 0 | 2 (18.2) | 6 (54.5) | 2 (18.2) | 1 (9.1) | 11 |
| Skinny | 0 | 1 (4.8) | 18 (85.7) | 1 (4.8) | 1 (4.8) | 21 |
| It is good as it is | 0 | 2 (1.8) | 83 (76.1) | 21 (19.3) | 3 (2.8) | 109 |
| Fat | 0 | 0 | 23 (46.9) | 12 (24.5) | 14 (28.6) | 49 |
| Very fat | 0 | 0 | 2 (15.4) | 4 (30.8) | 7 (53.8) | 13 |
| Total | 0 | 5 (2.5) | 132 (65) | 40 (19.7) | 26 (12.8) | 203 |
Among girls, 49.2% correctly classified their nutritional status; of those that incorrectly classified it, 60% underestimated and 40% overestimated their nutritional status. Among boys, 52.9% correctly classified their nutritional status; among those that incorrectly classified their nutritional status, 82.5% underestimated and 17.5% overestimated it. Of the girls with excess weight, 27.2% correctly classified their nutritional status, and of those that incorrectly classified it, 65.15% underestimated it. Of all the boys with excess weight, 30.3% correctly classified their nutritional status, and of those that incorrectly classified it, 69.7% underestimated it.
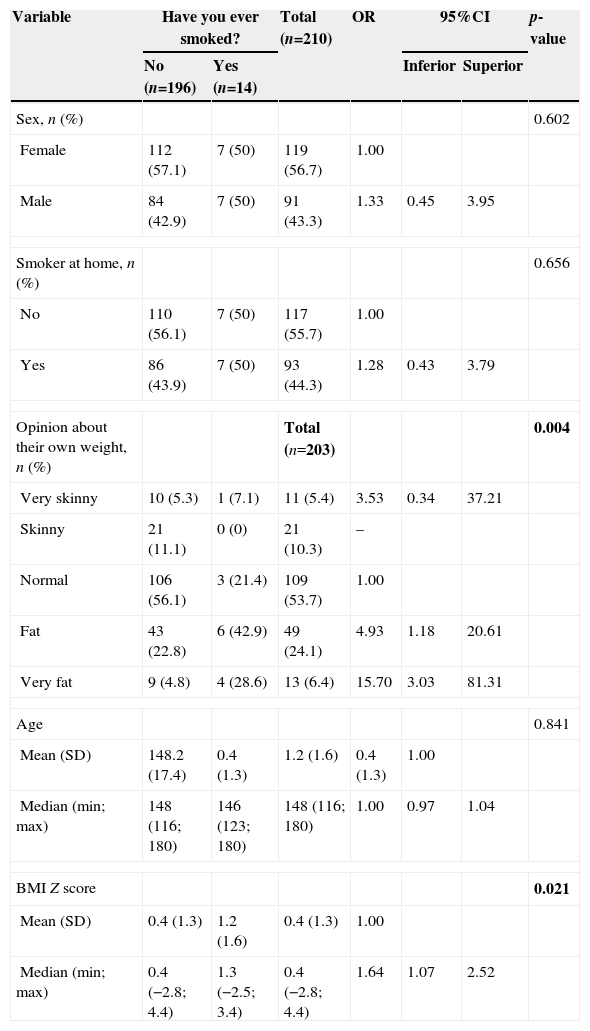
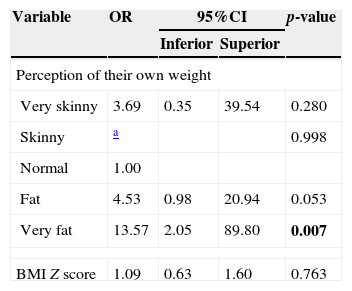
As for the bivariate analysis for tobacco use, Table 2 shows that, alone, the adolescents’ self-perception of their own weight and BMI Z-score influenced tobacco experimentation (p=0.004 and p=0.021, respectively). In the multivariate regression, as shown in Table 3, it is observed that only the self-image on weight was associated with smoking experimentation, and children who saw themselves as having very high weight were more likely to experiment tobacco use (OR: 13.57; 95% CI: 2.05–89.8, p=0.007).
Description of the assessed characteristics according to smoking experimentation.
| Variable | Have you ever smoked? | Total (n=210) | OR | 95%CI | p-value | ||
|---|---|---|---|---|---|---|---|
| No (n=196) | Yes (n=14) | Inferior | Superior | ||||
| Sex, n (%) | 0.602 | ||||||
| Female | 112 (57.1) | 7 (50) | 119 (56.7) | 1.00 | |||
| Male | 84 (42.9) | 7 (50) | 91 (43.3) | 1.33 | 0.45 | 3.95 | |
| Smoker at home, n (%) | 0.656 | ||||||
| No | 110 (56.1) | 7 (50) | 117 (55.7) | 1.00 | |||
| Yes | 86 (43.9) | 7 (50) | 93 (44.3) | 1.28 | 0.43 | 3.79 | |
| Opinion about their own weight, n (%) | Total (n=203) | 0.004 | |||||
| Very skinny | 10 (5.3) | 1 (7.1) | 11 (5.4) | 3.53 | 0.34 | 37.21 | |
| Skinny | 21 (11.1) | 0 (0) | 21 (10.3) | – | |||
| Normal | 106 (56.1) | 3 (21.4) | 109 (53.7) | 1.00 | |||
| Fat | 43 (22.8) | 6 (42.9) | 49 (24.1) | 4.93 | 1.18 | 20.61 | |
| Very fat | 9 (4.8) | 4 (28.6) | 13 (6.4) | 15.70 | 3.03 | 81.31 | |
| Age | 0.841 | ||||||
| Mean (SD) | 148.2 (17.4) | 0.4 (1.3) | 1.2 (1.6) | 0.4 (1.3) | 1.00 | ||
| Median (min; max) | 148 (116; 180) | 146 (123; 180) | 148 (116; 180) | 1.00 | 0.97 | 1.04 | |
| BMI Z score | 0.021 | ||||||
| Mean (SD) | 0.4 (1.3) | 1.2 (1.6) | 0.4 (1.3) | 1.00 | |||
| Median (min; max) | 0.4 (−2.8; 4.4) | 1.3 (−2.5; 3.4) | 0.4 (−2.8; 4.4) | 1.64 | 1.07 | 2.52 | |
OR, odds ratio; CI, confidence interval; SD, standard deviation.
Multiple logistic regression model for the response variable smoking experimentation by adolescents.
| Variable | OR | 95%CI | p-value | |
|---|---|---|---|---|
| Inferior | Superior | |||
| Perception of their own weight | ||||
| Very skinny | 3.69 | 0.35 | 39.54 | 0.280 |
| Skinny | a | 0.998 | ||
| Normal | 1.00 | |||
| Fat | 4.53 | 0.98 | 20.94 | 0.053 |
| Very fat | 13.57 | 2.05 | 89.80 | 0.007 |
| BMI Z score | 1.09 | 0.63 | 1.60 | 0.763 |
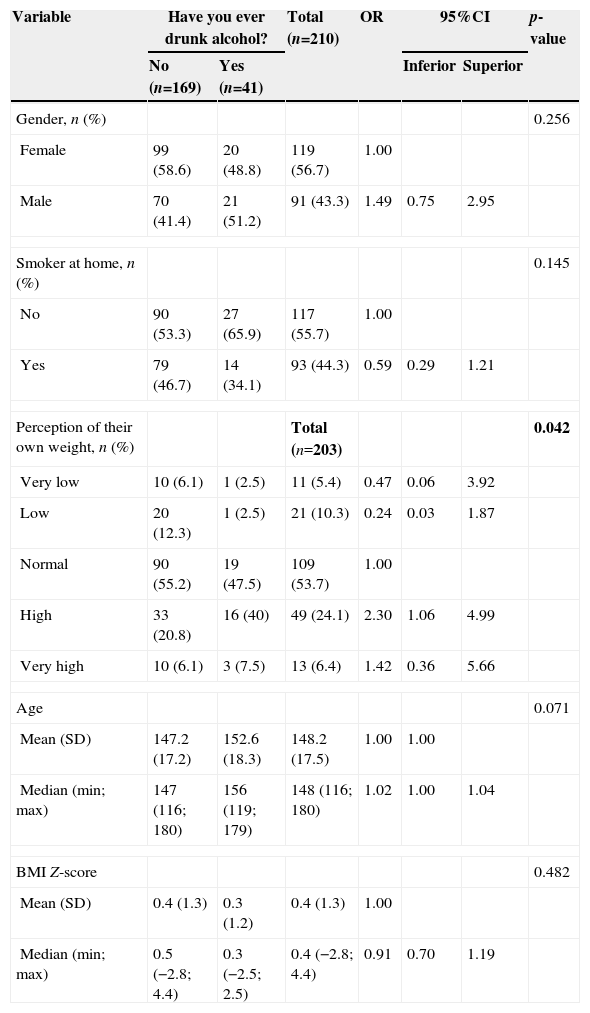
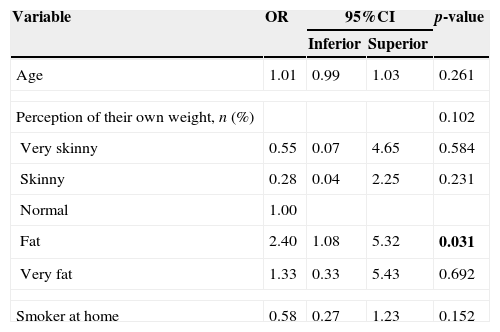
Regarding the experimentation of alcohol, it was verified that, according to Table 4, in the bivariate analysis, only the self-perception of their own weight influenced the use of alcohol by adolescents (p=0.042). The multivariate analysis (Table 5) shows that only the self-perception of their own weight together influenced the experimentation of alcohol by the adolescents and those who classified themselves as having high weight had a 2.40-fold higher chance of alcohol consumption than those who classified themselves as having normal weight.
Description of the assessed characteristics evaluated according to alcohol experimentation.
| Variable | Have you ever drunk alcohol? | Total (n=210) | OR | 95%CI | p-value | ||
|---|---|---|---|---|---|---|---|
| No (n=169) | Yes (n=41) | Inferior | Superior | ||||
| Gender, n (%) | 0.256 | ||||||
| Female | 99 (58.6) | 20 (48.8) | 119 (56.7) | 1.00 | |||
| Male | 70 (41.4) | 21 (51.2) | 91 (43.3) | 1.49 | 0.75 | 2.95 | |
| Smoker at home, n (%) | 0.145 | ||||||
| No | 90 (53.3) | 27 (65.9) | 117 (55.7) | 1.00 | |||
| Yes | 79 (46.7) | 14 (34.1) | 93 (44.3) | 0.59 | 0.29 | 1.21 | |
| Perception of their own weight, n (%) | Total (n=203) | 0.042 | |||||
| Very low | 10 (6.1) | 1 (2.5) | 11 (5.4) | 0.47 | 0.06 | 3.92 | |
| Low | 20 (12.3) | 1 (2.5) | 21 (10.3) | 0.24 | 0.03 | 1.87 | |
| Normal | 90 (55.2) | 19 (47.5) | 109 (53.7) | 1.00 | |||
| High | 33 (20.8) | 16 (40) | 49 (24.1) | 2.30 | 1.06 | 4.99 | |
| Very high | 10 (6.1) | 3 (7.5) | 13 (6.4) | 1.42 | 0.36 | 5.66 | |
| Age | 0.071 | ||||||
| Mean (SD) | 147.2 (17.2) | 152.6 (18.3) | 148.2 (17.5) | 1.00 | 1.00 | ||
| Median (min; max) | 147 (116; 180) | 156 (119; 179) | 148 (116; 180) | 1.02 | 1.00 | 1.04 | |
| BMI Z-score | 0.482 | ||||||
| Mean (SD) | 0.4 (1.3) | 0.3 (1.2) | 0.4 (1.3) | 1.00 | |||
| Median (min; max) | 0.5 (−2.8; 4.4) | 0.3 (−2.5; 2.5) | 0.4 (−2.8; 4.4) | 0.91 | 0.70 | 1.19 | |
OR, odds ratio; CI, confidence interval; SD, standard deviation.
Results of the multiple logistic regression model for the response variable alcohol experimentation by adolescents.
| Variable | OR | 95%CI | p-value | |
|---|---|---|---|---|
| Inferior | Superior | |||
| Age | 1.01 | 0.99 | 1.03 | 0.261 |
| Perception of their own weight, n (%) | 0.102 | |||
| Very skinny | 0.55 | 0.07 | 4.65 | 0.584 |
| Skinny | 0.28 | 0.04 | 2.25 | 0.231 |
| Normal | 1.00 | |||
| Fat | 2.40 | 1.08 | 5.32 | 0.031 |
| Very fat | 1.33 | 0.33 | 5.43 | 0.692 |
| Smoker at home | 0.58 | 0.27 | 1.23 | 0.152 |
OR, odds ratio; CI, confidence interval.
Till date, there are no known data on the association between body weight perception by adolescents and the risk of experimenting with licit drugs. Our study showed that the self-assessment of weight in cases of overweight and obesity may be associated with increased chance of consumption of these drugs during adolescence.
The high prevalence of overweight (32.3%) and obesity (12.9%) found in this study reinforces the increasing global trend of these nutritional disorders in children and adolescents.1–4 In our study, the prevalence of excess weight was higher in boys, and this is a trend that is observed in the younger age groups.4 Excess weight in adolescents is, by itself, a major cardiovascular risk factor and, when associated with alcohol use and smoking, can lead to important and early effects on adult health.5,20
The overall agreement between the adolescent's self-perception and their nutritional classification given by BMI Z-score was 50.7%. This value differs from previous studies in Brazil, which suggest that 65–70% of adolescences correctly evaluate their nutritional status.21,22 This difference is due to two main reasons. First, our sample encompasses an age group that includes early adolescence (10–14 years), while another Brazilian study analyzed the late adolescence age range (14–19 years), with the latter being more stable from a physiological point of view and better able to achieve correct self-perception of one's body.22 Second, the population evaluated in this study attended public schools, while the population from the other study carried out in Salvador and that evaluated the same age group attended private schools, which may suggest that socioeconomic differences interfere with the adolescent's nutritional status self-perception; however, additional data on such differences are necessary to support this conclusion.22
Among the adolescents that incorrectly assessed their nutritional status, most underestimated the weight. This was observed in both genders, including adolescents with excess weight; however, boys underestimated their own nutritional status more often than girls (82.5% vs. 60%). This may reflect a cultural characteristic of praising “strong” boys in all age groups, especially among adolescents, who often seek a more muscular body.23 Previous studies have shown that since infanthood, boys have their weights more often underestimated by their mothers than girls.24 As our study only evaluated early adolescence, many answers given by the adolescents may reflect maternal opinions.
In the present study, many adolescents lived with at least one smoker at home; however, this factor was not associated with experimentation of licit drugs, a finding that differs from findings of previous studies suggesting that parental example increases the risk of experimentation of these drugs by adolescents.18 In addition, in our study, the frequency of smoking experimentation was low (6.6%) compared with previous national data.25 A national survey carried out in 2004 in 12 Brazilian cities, with adolescents aged 13–15 years, showed that cigarette experimentation frequency is high, reaching 50% in Northeastern states.25 The results obtained in this study may reflect the global awareness effort about the dangers of smoking to health.26
Approximately 20% of the adolescents analyzed here had already tried alcohol, a lower frequency than that found in previous population studies, in which the percentage of alcohol experimentation among adolescents in São Paulo was higher than 70%.27 The explanation for this finding is the median age of our sample (12 years), with the most common age for first alcohol experimentation among adolescents being close to 12 years (20%) and increasing between 13 and 14 years (30–40%).28
Previous studies have shown similar data regarding the positive association between excess weight and tobacco experimentation.29,30 In these studies, it is suggested that excess food consumption can be conceptualized as an addictive behavior. Much of the evidence comes from neurobiological similarities between drug and food consumption. Moreover, an inverse association has been observed between alcohol consumption and body mass index, an association that can be influenced by psychosocial factors such as family history of alcoholism.28
A review study on excess weight and risk behavior in adolescence showed that the former is not necessarily a risk factor for the use of licit or illicit drugs; however, psychosocial factors involving overweight and obesity may increase adolescents’ vulnerability to this type of behavior.29 The present study showed a strong association between self-classification of having high or very high weight and the previous experimentation with tobacco and alcohol, regardless of the actual nutritional status of adolescents. A factor that may contribute to this association is the possible feeling of exclusion of adolescents who consider themselves obese in relation to their peers, as they are often the target of aggression and psychological abuse at school10 and, consequently, may resort to risky behaviors, such as the use of licit drugs in order to feel accepted by their groups.22,23,29
The present study has limitations that should be mentioned. The first is the selection of a convenience sample, which does not allow the extrapolation of the results to the general population. The second limitation involves the analysis of the nutritional status perception. As this is a subjective variable, the use of the questionnaire with closed alternatives may limit the adolescent's responses. Tools such as body silhouette scales and questionnaires to assess the self-perceived body image could improve the adolescents’ response specificity in relation to what they think about their own body. The third limitation is the lack of outpatient follow-up.
The emergency care approach may have interfered with the adolescents’ responses regarding the experimentation of licit drugs, due to a possible lack of trust regarding the confidentiality of answers or the stress caused by the event that led the adolescent to the emergency department. It is worth mentioning that there may be an overlap between the environmental and psychological factors that lead an adolescent to obesity and also to the use of licit and illicit drugs, which may have contributed further to the findings of the study. Finally, the questionnaire applied to the adolescents is designed only for the present study and has not been validated and its variability between examiners has not been assessed. A more reliable questionnaire tool can yield more reliable information on the variables associated with experimentation of licit drugs in adolescence.
In summary, our findings on the association between excess weight, self-perception of nutritional status and experimentation of licit drugs deserve special attention regarding the promotion of adolescent health, not only because the use of licit drugs is an immediate hazard to adolescents’ health, but because it can also be related to the abuse of these drugs in the future and the experimentation of illicit drugs.19,27,30
FundingThis study did not receive funding.
Conflicts of interestThe authors declare no conflicts of interest.
