

To identify dietary patterns of children and to verify their association with socio-economical, behavioral and maternal determinants.
MethodsA cross-sectional study with a random sample of 328 children aged 8 and 9 years. Dietary intake was assessed by food records in three nonconsecutive days and measured in grams of food groups and nutrients. Factor analysis and subsequent orthogonal rotation (varimax) were used to determine dietary patterns. Ordinal logistic regression was used to assess associations between dietary patterns and the studied determinants.
ResultsFive dietary patterns were observed: “Traditional,” “Sweetened beverages and snacks,” “Monotonous,” “Healthy” and “Egg-dairy.” A higher maternal level of education was directly associated with “Sweetened beverages and snacks” and “Egg-dairy’ standards. Low income children who were submitted to greater food restriction by parents/guardians followed the more “Traditional” standard, represented by the consumption of rice, beans, vegetables, cooked roots and tubers and red meat. The “Monotonous” pattern, represented by a high consumption of milk and chocolate powder, was most followed by children from the middle class. Children living in rural areas consumed more foods from the “Egg-dairy” pattern, when compared to those from the urban area.
ConclusionsDietary patterns of children were associated with family socioeconomic status, maternal level of education, practice of food restriction by parents/guardians and location of residence in urban or rural area. Better socioeconomic conditions contributed to a more nutritionally inadequate dietary pattern.
Identificar os padrões alimentares de crianças e verificar sua associação com determinantes socioeconômicos, comportamentais e maternos.
MétodosEstudo transversal com amostra aleatória de 328 crianças de oito e nove anos. O consumo alimentar foi avaliado por registros alimentares de três dias não consecutivos e quantificado em gramas de grupos alimentares e de nutrientes. Análise fatorial e subsequente rotação ortogonal (varimax) foram usadas para determinar os padrões alimentares. Regressão logística ordinal foi usada para verificar associações entre padrões alimentares e os determinantes estudados.
ResultadosCinco padrões alimentares foram extraídos: “Tradicional”, “Bebidas adoçadas e lanches”, “Monótono”, “Saudável” e “Ovo-lacto”. A maior escolaridade materna se associou de forma direta aos padrões “Bebidas doces e lanches” e “Ovo-lacto”. Crianças de baixo nível econômico e que recebiam maior restrição alimentar pelos pais/responsáveis aderiram mais ao padrão “Tradicional”, representado pelo consumo de arroz, feijão, hortaliças, raízes e tubérculos cozidos e carne vermelha. O padrão “Monótono”, representado pelo elevado consumo de leite e achocolatado, foi mais consumido por crianças de classe econômica intermediária. Crianças que residiam em zona rural consumiam mais alimentos do padrão “Ovo-lacto” comparadas com as de zona urbana.
ConclusõesOs padrões alimentares das crianças estiveram associados às condições econômicas da família, escolaridade materna, prática de restrição alimentar pelos pais/responsáveis e localização da residência em zona urbana ou rural. Melhores condições socioeconômicas contribuíram para um padrão alimentar nutricionalmente mais inadequado.
Childhood is a crucial period for the implementation of healthy eating and lifestyle habits, which are predictive for adult life.1 “Pesquisa de Orçamentos Familiares” (The Household Budget Survey) indicated that the food consumption of the Brazilian population combines a traditional diet based on rice and beans with foods with few nutrients and many calories.2
Traditionally, studies that assess the population's food intake are based on analysis of macro and micronutrients. Currently, the assessment of overall food consumption has been appreciated, as it better reflects the actual diet status.3 The study of dietary patterns allows associations between food combinations and certain health conditions to be made, often not detected in isolated analyses of food or nutrients.4 Another advantage of analyzing dietary patterns is due to its capacity to reduce the number of variables generated in the food intake analysis to a small number of factors, with highly inter-correlated items and a significant representation of the total diet.5,6
The study of health status in children should not be performed without understanding the family and social context in which the child is inserted. Parents influence the formation of the child's food habits through the food available in the household.1,7 In addition, parents tend to have their eating behaviors reproduced by the child, and they are important in establishing rules and standards related to food practices and lifestyle.8
Socioeconomic factors are important determinants of individual food consumption. In developing countries, the increase in obesity has been found mainly in the higher socioeconomic classes.7,9 Factors such as women working outside the home, easier preparation of food and behavior variables also contribute to the quality of the children's diet.10 Therefore, this study aimed to identify the dietary patterns of children and verify their association with socioeconomic, behavioral and maternal factors.
MethodThis is a cross-sectional study, carried out between 2012 and 2013, with children from Viçosa, state of Minas Gerais, Brazil. Sample size calculation was based on the total number of children aged 8 and 9 years, enrolled in the 3rd and 4th years of all public and private schools located in urban and rural areas of Viçosa (n=1297), considering a prevalence of 50% of metabolic syndrome, the outcome investigated in the bigger study in which this work is inserted. There is no consensus regarding the diagnostic criteria of metabolic syndrome in children, and by using the prevalence of 50% for sample calculation, the maximum sample number is guaranteed. A permissible error of 5% was also considered for the calculation, a 95% confidence interval and a sample loss of 20%, plus 10% for multivariate analysis, which resulted in the calculated sample of 385 children. Epi-Info 7.0 software was used for sample size calculation. Children's participation in the study occurred by drawing lots, with proportionality preservation by type of educational institution (public/private) and location of residence (urban/rural). The exclusion criteria were the presence of cardiovascular disease and/or type 1 diabetes, reported by parents/guardians and/or use of hypotensive or lipid-lowering drugs. Children were excluded if they had absent or incomplete data that were essential to the analyses.
The family socioeconomic status was categorized according to the “Critério de Classificação Econômica Brasil” (Brazil Economic Classification Criteria), as classes A, B1, B2, C1, C2 and D.11 Maternal education was categorized as: 0–4, 5–8, 9–11 and 12 or more years of schooling. Binary variables of home location (urban/rural zone) and maternal work outside the home (yes/no) were used. The mother's time spent with the child was analyzed as a continuous variable (hours/day).
The degree of food restriction was evaluated by the attitude of the parent/guardian when offering the child each of the following 15 food items: chocolate cake, sandwich cookies, snacks, hamburger, fries, pizza, artificial juices, soft drinks, milk and dairy products, butter, popcorn, ice-cream, chocolate, sweet pies and chewing gum. The collection of this variable was performed using a structured questionnaire by the study authors. Parents/guardians were asked if they “always,” “sometimes,” or “never” offered these foods to their children. The degree of food restriction by parents/guardians was evaluated by the percentage of answers “never.”
Children's dietary intake was assessed by food patterns determined from 3-day food records. The children were asked to fill in the records, with the help of parents/guardians and to give accurate and complete information about food and consumed quantities, covering three non-consecutive days, with one day being on the weekend.12 All records were reviewed by researchers together with the children and parents/guardians, with the help of a photo album13 and of household items commonly used to determine food servings, in order to reduce recording biases. The mean daily intake of total calories and grams of carbohydrates, proteins, lipids, monounsaturated fatty, polyunsaturated and saturated acids, fiber and sodium, related to the three days of recording, was determined with the aid of the DietPro software, release 5i.
All food items mentioned in 3 days of recording were listed, in grams, in a specific worksheet. Then the foods were grouped based on similarity of their nutritional profiles or their culinary use. Mixed preparations, such as lasagna, pizza and sandwiches were divided into their ingredients according to recipes standardized by the study authors, and their components were directed to the appropriate groups.12 The mean individual daily consumption of food groups was calculated.
Subsequently, the identification of the dietary patterns was performed using principal component analysis (PCA). Before the PCA, the Kaiser–Mayer–Olkin coefficient (KMO=0.56) was estimated, as well as the Bartlett sphericity test (p<0.001), which indicate that the data, according to the quality of their correlations, could be used in the PCA.14 The number of factors to be retained was based on the criterion of eigenvalues >1.0 and, on the variance chart, by the number of components (scree plot).15 Subsequently, the factors were submitted to varimax orthogonal rotation for the demonstration of simpler structures, with greater interpretability and statistical independence.
Factor loadings represent the correlation coefficients between the different food groups in each dietary pattern, and food groups with positive charges directly contribute to a dietary pattern, whereas groups with negative charges are inversely associated with a dietary pattern.16 Food groups with factor loadings >0.3 were considered as important contributors to the dietary pattern. Each dietary pattern was named according to the characteristics of the food groups that had higher factor loading. At the end, a score was calculated for each participant in each pattern, by adding the individual consumption of each food group weighed by its factor loading.15 Then, the individual scores were standardized (z score). Higher z scores represent greater adherence of the child to certain dietary patterns.
Descriptive statistics were used to characterize the sample according to food consumption and socioeconomic, behavioral and maternal characteristics. Data asymmetry was verified by the Shapiro–Wilk test. Differences between groups were verified using the Mann–Whitney test.
Consumption scores of each child for each pattern were categorized into tertiles for associative analysis. The bivariate ordinal logistic regression was used to assess the association between each pattern and each socioeconomic, behavioral and maternal variable assessed. These models allowed the calculation of the Odds Ratio (OR), i.e., the probability of the occurrence of an event. Predictor variables that showed to have influence with a significance level <0.2 in the bivariate models were used to compose the final multiple model, which considered statistically significant those with α<0.05.17
This study was carried out after approval by the Institutional Review Board of Universidade Federal de Viçosa, Process N. 045/2012. Participation in the study occurred after the informed consent form was signed by the children and their parents/guardians.
ResultsA total of 365 children were evaluated; however, there was a sample loss of 37 due to the presence of incomplete data that were essential to the analysis. The final sample consisted of 328 children, of which 193 were females and 135 were males. Seventeen food groups were formed based on the consumed food. Due to the low number of individuals who consumed fish (n=39), whole pasta and grains (n=32), low fat and skim milk (n=5) and nuts (n=2), those foods were redistributed into food groups with similar nutritional content. The items coffee, teas, oils and added fat were excluded, as they could be significant in many different patterns.18
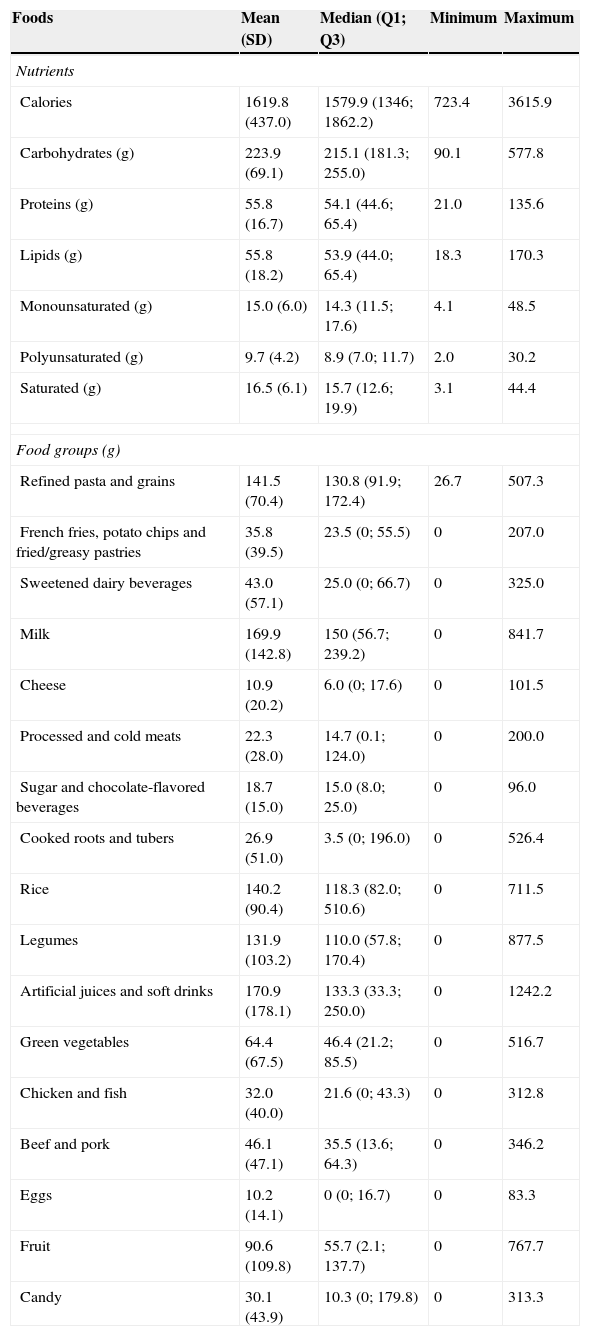
Sample characterization is shown in Table 1. A low consumption of fruits and vegetables was observed among the children. The mean consumption of these foods was less than 2.5 servings a day for both genders, based on a 65g serving.19 Artificial juices and soft drinks were consumed by the majority of children (76.5%). Only carbohydrate intake differed between genders, with higher intake among boys (p=0.007) (data not shown).
Dietary intake characteristics in the sample of children aged 8 and 9 years enrolled in public and private schools of Viçosa, Minas Gerais, 2012 and 2013.
| Foods | Mean (SD) | Median (Q1; Q3) | Minimum | Maximum |
|---|---|---|---|---|
| Nutrients | ||||
| Calories | 1619.8 (437.0) | 1579.9 (1346; 1862.2) | 723.4 | 3615.9 |
| Carbohydrates (g) | 223.9 (69.1) | 215.1 (181.3; 255.0) | 90.1 | 577.8 |
| Proteins (g) | 55.8 (16.7) | 54.1 (44.6; 65.4) | 21.0 | 135.6 |
| Lipids (g) | 55.8 (18.2) | 53.9 (44.0; 65.4) | 18.3 | 170.3 |
| Monounsaturated (g) | 15.0 (6.0) | 14.3 (11.5; 17.6) | 4.1 | 48.5 |
| Polyunsaturated (g) | 9.7 (4.2) | 8.9 (7.0; 11.7) | 2.0 | 30.2 |
| Saturated (g) | 16.5 (6.1) | 15.7 (12.6; 19.9) | 3.1 | 44.4 |
| Food groups (g) | ||||
| Refined pasta and grains | 141.5 (70.4) | 130.8 (91.9; 172.4) | 26.7 | 507.3 |
| French fries, potato chips and fried/greasy pastries | 35.8 (39.5) | 23.5 (0; 55.5) | 0 | 207.0 |
| Sweetened dairy beverages | 43.0 (57.1) | 25.0 (0; 66.7) | 0 | 325.0 |
| Milk | 169.9 (142.8) | 150 (56.7; 239.2) | 0 | 841.7 |
| Cheese | 10.9 (20.2) | 6.0 (0; 17.6) | 0 | 101.5 |
| Processed and cold meats | 22.3 (28.0) | 14.7 (0.1; 124.0) | 0 | 200.0 |
| Sugar and chocolate-flavored beverages | 18.7 (15.0) | 15.0 (8.0; 25.0) | 0 | 96.0 |
| Cooked roots and tubers | 26.9 (51.0) | 3.5 (0; 196.0) | 0 | 526.4 |
| Rice | 140.2 (90.4) | 118.3 (82.0; 510.6) | 0 | 711.5 |
| Legumes | 131.9 (103.2) | 110.0 (57.8; 170.4) | 0 | 877.5 |
| Artificial juices and soft drinks | 170.9 (178.1) | 133.3 (33.3; 250.0) | 0 | 1242.2 |
| Green vegetables | 64.4 (67.5) | 46.4 (21.2; 85.5) | 0 | 516.7 |
| Chicken and fish | 32.0 (40.0) | 21.6 (0; 43.3) | 0 | 312.8 |
| Beef and pork | 46.1 (47.1) | 35.5 (13.6; 64.3) | 0 | 346.2 |
| Eggs | 10.2 (14.1) | 0 (0; 16.7) | 0 | 83.3 |
| Fruit | 90.6 (109.8) | 55.7 (2.1; 137.7) | 0 | 767.7 |
| Candy | 30.1 (43.9) | 10.3 (0; 179.8) | 0 | 313.3 |
Q1, quartile 1; Q3, quartile 3; SD, standard deviation.
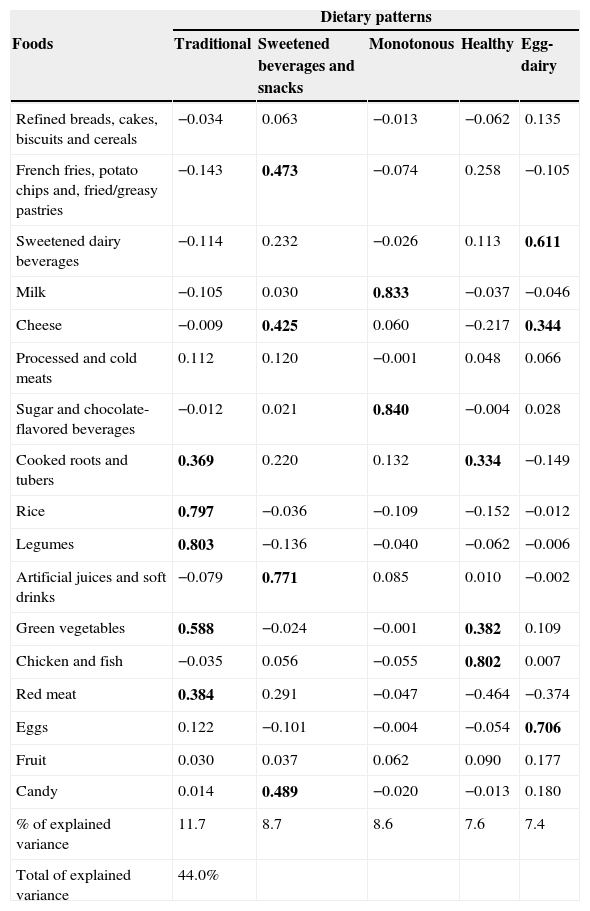
Five dietary patterns were extracted, which together explained 44.0% of the original data variance. The first pattern, entitled “Traditional,” explained 11.7% of the variance and was mainly represented by rice, beans, vegetables, cooked roots and tubers and red meat. The second pattern, called “Sweetened drinks and snacks,” incorporated 8.7% of the variance and was characterized by higher intake of artificial juices, soft drinks, fried or greasy snacks and sweets. The third pattern, called “Monotonous,” accounted for 8.6% of the data variance, and was characterized only by the consumption of whole milk and chocolate powder, foods consumed at a high frequency in the sample. The fourth pattern, called “Healthy,” explained 7.6% of the variance and was represented by the consumption of poultry, fish, vegetables, roots and tubers, and was inversely associated with the consumption of red meat. The last component, called “Egg-dairy,” accounted for 7.4% of the total variance, was characterized by the consumption of eggs, cheese and sweetened dairy beverages and was inversely associated with red meat (Table 2).
Dietary patterns and specific factor loads of food groups consumed by children, Viçosa, Minas Gerais, 2012 and 2013.
| Dietary patterns | |||||
|---|---|---|---|---|---|
| Foods | Traditional | Sweetened beverages and snacks | Monotonous | Healthy | Egg-dairy |
| Refined breads, cakes, biscuits and cereals | −0.034 | 0.063 | −0.013 | −0.062 | 0.135 |
| French fries, potato chips and, fried/greasy pastries | −0.143 | 0.473 | −0.074 | 0.258 | −0.105 |
| Sweetened dairy beverages | −0.114 | 0.232 | −0.026 | 0.113 | 0.611 |
| Milk | −0.105 | 0.030 | 0.833 | −0.037 | −0.046 |
| Cheese | −0.009 | 0.425 | 0.060 | −0.217 | 0.344 |
| Processed and cold meats | 0.112 | 0.120 | −0.001 | 0.048 | 0.066 |
| Sugar and chocolate-flavored beverages | −0.012 | 0.021 | 0.840 | −0.004 | 0.028 |
| Cooked roots and tubers | 0.369 | 0.220 | 0.132 | 0.334 | −0.149 |
| Rice | 0.797 | −0.036 | −0.109 | −0.152 | −0.012 |
| Legumes | 0.803 | −0.136 | −0.040 | −0.062 | −0.006 |
| Artificial juices and soft drinks | −0.079 | 0.771 | 0.085 | 0.010 | −0.002 |
| Green vegetables | 0.588 | −0.024 | −0.001 | 0.382 | 0.109 |
| Chicken and fish | −0.035 | 0.056 | −0.055 | 0.802 | 0.007 |
| Red meat | 0.384 | 0.291 | −0.047 | −0.464 | −0.374 |
| Eggs | 0.122 | −0.101 | −0.004 | −0.054 | 0.706 |
| Fruit | 0.030 | 0.037 | 0.062 | 0.090 | 0.177 |
| Candy | 0.014 | 0.489 | −0.020 | −0.013 | 0.180 |
| % of explained variance | 11.7 | 8.7 | 8.6 | 7.6 | 7.4 |
| Total of explained variance | 44.0% | ||||
Factor loads >0,3(in bolds) represent significant contributions of food groups for the components.
There was a high intake of artificial juices and soft drinks among the children, and these were the foods that contributed the most to the “Sweetened drinks and snacks” pattern, being consumed by 76.5% of the children at a mean daily amount of 220mL (minimum: 27.5mL; maximum: 1242.2mL). The consumption of these foods was associated with the consumption of fries, eaten by 39% of children; fried snacks, consumed by 56% of the sample; chips, eaten by 18% of children, and instant noodles, which was part of the daily consumption of approximately 10% of children. Children who consumed the highest amount of the abovementioned foods also reported eating more fatty cheeses and sweets.
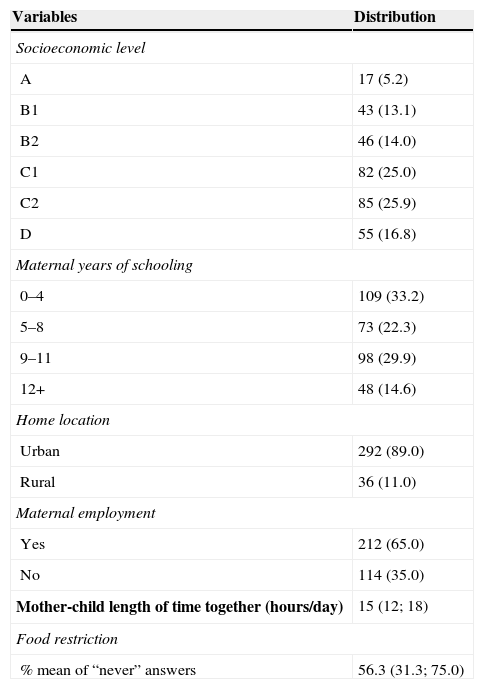
The distribution of children according to socioeconomic, behavioral and maternal variables is shown in Table 3. Regarding the socioeconomic status, most families belonged to socioeconomic class C, followed by B, D and A. As for maternal education, a low proportion of mothers had college/university education, and most had only 0–4 years of schooling. Children of mothers with 12 or more years of schooling had more food restrictions, when compared to children of mothers with lower educational level (p=0.05). A higher number of mothers with higher education worked outside the home, when compared to those with lower levels of education (p=0.001).
Distribution of children according to the socioeconomic, behavioral and maternal variables, Viçosa, Minas Gerais, 2012 and 2013.
| Variables | Distribution |
|---|---|
| Socioeconomic level | |
| A | 17 (5.2) |
| B1 | 43 (13.1) |
| B2 | 46 (14.0) |
| C1 | 82 (25.0) |
| C2 | 85 (25.9) |
| D | 55 (16.8) |
| Maternal years of schooling | |
| 0–4 | 109 (33.2) |
| 5–8 | 73 (22.3) |
| 9–11 | 98 (29.9) |
| 12+ | 48 (14.6) |
| Home location | |
| Urban | 292 (89.0) |
| Rural | 36 (11.0) |
| Maternal employment | |
| Yes | 212 (65.0) |
| No | 114 (35.0) |
| Mother-child length of time together (hours/day) | 15 (12; 18) |
| Food restriction | |
| % mean of “never” answers | 56.3 (31.3; 75.0) |
Socioeconomic level, maternal years of schooling, home location and maternal employment shown in number of individuals (%). Mother–child length of time together (hours/day) and food restriction shown as median (quartile 1; quartile 3).
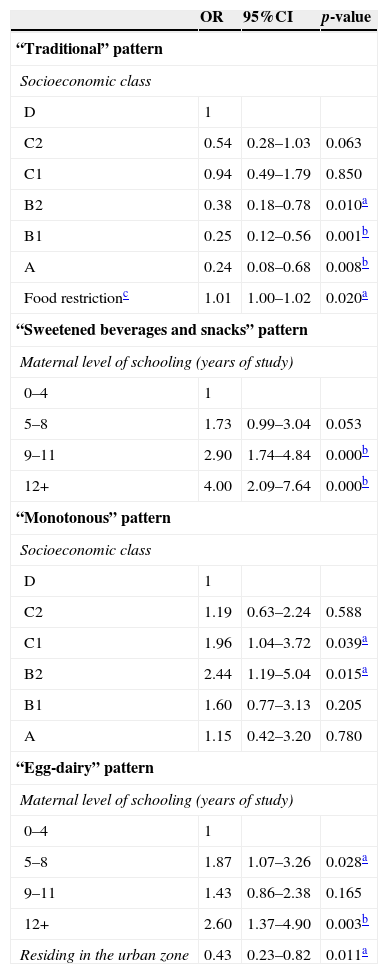
Table 4 shows the final multivariate ordinal logistic regression models between each dietary pattern (dependent variables) and socioeconomic, behavioral and maternal variables (predictor variables) that showed significance in the bivariate models. A higher socioeconomic level and greater food restrictions by parents/guardians were associated with higher adherence of the child to the “Traditional” pattern. Mothers with 9 or more years of schooling had children who consumed more “Sweetened drinks and snacks,” and when maternal education reached 12 or more years of study, the chances of having a diet rich in those items increased by 4 times, when compared to those with lower educational level. Children from intermediate economic level families were more strongly associated with the “Monotonous” pattern, compared to those of extreme socioeconomic classes. The “Egg-dairy” pattern was more consumed by children living in rural areas and children of mothers with higher levels of education.
Final models of multivariate ordinal logistic regression between tertiles of dietary patterns and socioeconomic, behavioral and maternal variables.
| OR | 95%CI | p-value | |
|---|---|---|---|
| “Traditional” pattern | |||
| Socioeconomic class | |||
| D | 1 | ||
| C2 | 0.54 | 0.28–1.03 | 0.063 |
| C1 | 0.94 | 0.49–1.79 | 0.850 |
| B2 | 0.38 | 0.18–0.78 | 0.010a |
| B1 | 0.25 | 0.12–0.56 | 0.001b |
| A | 0.24 | 0.08–0.68 | 0.008b |
| Food restrictionc | 1.01 | 1.00–1.02 | 0.020a |
| “Sweetened beverages and snacks” pattern | |||
| Maternal level of schooling (years of study) | |||
| 0–4 | 1 | ||
| 5–8 | 1.73 | 0.99–3.04 | 0.053 |
| 9–11 | 2.90 | 1.74–4.84 | 0.000b |
| 12+ | 4.00 | 2.09–7.64 | 0.000b |
| “Monotonous” pattern | |||
| Socioeconomic class | |||
| D | 1 | ||
| C2 | 1.19 | 0.63–2.24 | 0.588 |
| C1 | 1.96 | 1.04–3.72 | 0.039a |
| B2 | 2.44 | 1.19–5.04 | 0.015a |
| B1 | 1.60 | 0.77–3.13 | 0.205 |
| A | 1.15 | 0.42–3.20 | 0.780 |
| “Egg-dairy” pattern | |||
| Maternal level of schooling (years of study) | |||
| 0–4 | 1 | ||
| 5–8 | 1.87 | 1.07–3.26 | 0.028a |
| 9–11 | 1.43 | 0.86–2.38 | 0.165 |
| 12+ | 2.60 | 1.37–4.90 | 0.003b |
| Residing in the urban zone | 0.43 | 0.23–0.82 | 0.011a |
OR, odds ratio; 95% CI, confidence interval.
This study shows an overview of food intake in children aged 8 and 9 years, demonstrating the way in which items consumed in their eating patterns are grouped. Five dietary patterns explained 44% of the original data variance: “Traditional,” “Sweetened drinks and snacks,” “Monotonous,” “Healthy,” and “Egg-dairy.” There were differences regarding the child's adherence to the pattern according to their socioeconomic, behavioral and maternal characteristics. Children of higher socioeconomic classes and whose mothers had higher levels of formal education showed a dietary pattern that was more distant from that considered appropriate, with lower adherence to the “Traditional” pattern and greater adherence to “Sweetened drinks and snacks” pattern. Higher maternal educational level, as well as living in rural areas, resulted in a greater chance of adherence to the “Egg-dairy’ pattern. Children from intermediate socioeconomic classes showed greater adherence to the “Monotonous” pattern, compared to those of extreme socioeconomic classes. Food restriction practices by parents/guardians were directly associated with greater adherence to the “Traditional” pattern.
Some similarities can be observed between the studies that determine and evaluate dietary patterns. Some dietary patterns are usually extracted from the data set: one characterized by the consumption of traditional/national foods, representing the staple food of the population, similar to the “Traditional” pattern of this study; one based on processed and highly processed foods, similar to the “Sweetened drinks and snacks” pattern of this study, and a pattern representing the consumption of foods associated with a healthy lifestyle, such as white meats, whole grains, products with low-fat content and vegetables, similar to the “Healthy” pattern of this study.8,20–22
In a study of obese Brazilian adolescents, three dietary patterns were defined: (1) “Traditional,” in which predominated the consumption of rice, pasta, beans, oils, red meats, sausages and sweets; (2) “In Transition,” represented by the high intake of milk and dairy products, bread, butter and margarine, white meats, eggs, vegetables and fruits, juices and sugar; and (3) “Fast Food,” consisting mainly of cafeteria products. Together, the three patterns explained 34.8% of the original data variance.22
Research carried out in Salvador, Bahia, in 2011, with 1260 children aged 4–11 years, identified four patterns that explained 45.9% of the data variance extracted from a food frequency questionnaire. Unlike the present study, pattern 1 (similar to the “Traditional”) was associated with higher socioeconomic level, and pattern 3 (similar to “Sweetened drinks and snacks”) was more associated with lower socioeconomic status.23
Similarly to this research, a study of 667 children aged 1–6 years from Pelotas, Brazil, and a study with adolescents in Cuiabá, also in Brazil, verified greater adherence to the “Traditional” pattern among children whose mothers had lower income.24,25 The higher food consumption of the “Traditional” pattern and the lower food consumption of the “Sweetened drinks and snacks” pattern by children of lower socioeconomic status in this study may be associated with the purchasing value of these foods. Foods from the “Sweetened drinks and snacks” pattern can be considered more expensive and “superfluous” when compared to the “Traditional” pattern.
In a population-based Spanish study with 3534 individuals aged 2–24 years, the food pattern entitled “Snacky,” similar to the “Sweetened drinks and snacks” pattern of this study, was characterized by increased consumption of bakery products, savory snacks, sweets and soft drinks.8 The “Snacky” pattern was more consumed by children of mothers with lower educational level,8 and the children living in rural areas consumed less fruit when compared to those from urban areas.8 In this study, differences in food consumption between rural and urban areas were found only regarding the consumption of the “Egg-dairy” pattern, more consumed by children from rural areas. This behavior can be explained by the greater availability of eggs in the countryside due to the self-sustaining production or family farming, as well as the fact that this food is a meat substitute with reduced price and the possible decreased access to more processed foods by rural children.
In accordance with the present study, Jones et al.19 also observed low consumption of fruits and vegetables when evaluating 7285 children, with a mean intake of 201g/day, higher than that found in this study (193.9g/day). In that study,19 girls consumed more fruits than boys, and children whose mothers had higher educational level ate more fruits and vegetables when compared to children of mothers with lower educational level. The low consumption of fruits was also observed in a population-based study of individuals aged 2–24 years.8
The inclusion of women in the labor market hinders the preparation of household meals, which results in a higher consumption of processed foods by the child.25 McIntosh et al.26 observed that mothers who considered working outside the home as a priority gave less importance to the preparation of family meals. In the present study, however, the time mothers spent with their children and maternal work outside the home were not associated with any dietary pattern in the multivariate regression models.
Food restriction practices by parents/guardians were associated with greater adherence by the child to the “Traditional” pattern. In a multi-ethnic study of children aged 4–6 years, it was observed that maternal restrictive practices were associated with lower energy density self-selected by the children.27 This practice can be considered positive, as long as its application has no negative connotations regarding the consumption of certain foods by the child, and does not stimulate compensatory food intake of high calorie foods.
It is noteworthy that the cross-sectional design was a limitation of the study, making it impossible to identify causal associations between dietary patterns and the analyzed determinants. The main finding of this study was the independent association between dietary patterns and the socioeconomic, behavioral and maternal variables.
Thus, the five dietary patterns extracted from this study demonstrated the dietary style of the children. The children's dietary patterns were associated with family socioeconomic status, maternal level of education, food restriction practices by parents/guardians and home location in urban or rural area. The analysis of dietary patterns allows using the existing inter-correlation among the foods to characterize the habitual food intake, and enables the performance of associative and inferential analyses, which are often not identified in the study of individual nutrients or foods.
FundingThis study did not receive funding.
Conflicts of interestThe authors declare no conflicts of interest.
We thank Professors Andréia Ribeiro Queiroz and Milene Cristine Person for their assistance with data analysis.
