


Multiple myeloma is the most common form of plasma cell cancer. It is a disease of elderly people, with a mean age at diagnosis of 65–70, and represents 10–15% of all blood cancers. It is a heterogeneous disease associated with intrinsic factors and disease characteristics such as genetics, which dictate the clinical course of the disease. Multiple myeloma involves several abnormalities in the IgH variable region. The first oncogenic events in this cancer occur in the germinal centre, apparently during isotype switching and somatic hypermutation of B cells. While these primary mutations have been found in myeloma cells, these events alone are not enough to cause pathogenesis. However, few genes have been identified in this type of disease. The expression of cancer/testis antigens (CTAs) is limited to testis tissue and various types of cancer, in which they are considered as a tumour marker as they are associated with the prognosis and monitoring of the disease, and are involved with overall survival and event-free disease. In view of the above, the objective of this study was to analyse the expression of CTAs (MAGE-A3 and -C1, NY-ESO and SSX1) by RT-PCR in patients diagnosed with de novo multiple myeloma admitted to the Haematology Department of Hospital General de México. Our results proved that there is presence of these genes and that they may be involved in resistance, progression and survival.
El mieloma múltiple es la forma más común de las neoplasias malignas de células plasmáticas. Es una enfermedad de los adultos mayores, la media al diagnóstico es de 65 a 70 años y representa del 10 al 15% de todas las neoplasias hematológicas. Es una enfermedad heterogénea donde existe una asociación con factores y características intrínsecas de la enfermedad, tales como las genéticas, las cuales dictan el curso clínico del padecimiento. El mieloma múltiple involucra diversas anormalidades en la región variable de la IgH. Los primeros eventos oncogénicos en esta neoplasia ocurren en el centro germinal, al parecer durante el proceso de cambio de clase de isotipo y de hipermutación somática de las células B. Si bien estas mutaciones primarias han sido encontradas en células mielomatosas, estos eventos por sí solos no son suficientes para provocar la patogénesis. Sin embargo, son escasos los genes identificados en este tipo de padecimiento. La expresión de los antígenos testiculares de cáncer (ATC) se limita a tejido testicular y a varios tipos de cánceres, en donde ha sido considerada como marcador tumoral, pues están implicados en el pronóstico y seguimiento de la enfermedad, impactando en la supervivencia global y en la enfermedad libre de eventos. Por lo tanto, el objetivo de este trabajo fue analizar la expresión de los ATC (MAGEA3, C1, NY-ESO y SSX1) en pacientes diagnosticados con mieloma múltiple de novo que ingresaron al Servicio de Hematología del Hospital General de México por medio de RT-PCR. Nuestros resultados comprobaron que existe presencia de dichos genes, por lo que podrían estar participando en la resistencia, progresión y supervivencia.
Multiple myeloma is the most common form of plasma cell cancer, in which the plasma cells abnormally synthesise a single type of immunoglobulin: IgG, IgM, IgA, IgD, IgE or only Bence Jones-type light chains and, in very rare cases, expressing none of them.1,2
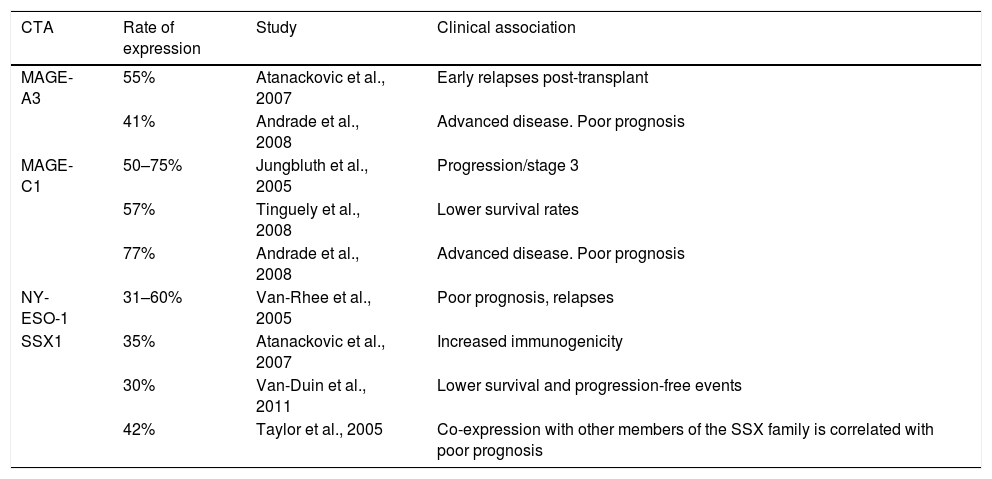
It is a disease of elderly people, with the mean age at diagnosis being 65–70. Only 10% of cases occur in people under 40, but it is far more aggressive in these patients.3,4 The incidence in Nordic countries is 5 cases per 100,000 population. In our country, according to the histopathology-based Cancer Registry, it is 0.7 per 100,000, representing 10–15% of all blood cancers.5,6 It has been reported that stromal cells from bone marrow and fibroblasts have a negative effect on MM cells, as they intervene in growth, survival, drug resistance and evasion of the immune system.7,8 The immunophenotype of these cells includes the markers CD38 and CD138, no or low expression of CD19 and CD27, and increased expression of CD28, CD33 and CD56.9 A number of different cytogenetic and molecular abnormalities have been reported in patients with multiple myeloma, such as hyperdiploid, which include trisomies of chromosomes 3, 5, 7, 15, 19, 21, 6, 9, 11 or 17, and a low prevalence of chromosome 14q32 translocations (IgH), and non-hyperdiploid, the main cytogenetic events of which involve IgH translocations and any of several oncogenes, such as fibroblast growth factor receptor 3 (FGFR3) and cyclins D1 and D336. However, few genes have been identified in this type of disease. The expression of cancer/testis antigens (CTAs) in various types of cancer is considered as a tumour marker as they are associated with the prognosis and monitoring of the disease, and are involved with overall survival and event-free disease.10–12 Among the most studied are the MAGE-A3 and -C1, NY-ESO-1 and SSX1 genes. They are only expressed by immune-privileged germ cells, and they are the most immunogenic of the CTAs.13,14 They are abnormally expressed in a variety of cancers and associated with poor prognosis in, among others, breast cancer,15,16 multiple myeloma 17–18 and leukaemia. These genes have been extensively studied and different rates of expression and correlation with a number of different factors have been found. Table 1 shows previous studies of these genes in multiple myeloma. Identifying cancer biomarkers in multiple myeloma is extremely important for reducing the costs of therapy, and for improving the sensitivity of molecular monitoring to allow early identification of at-risk groups in terms of treatment failure or poor prognosis. In view of the above, the primary objective of this study was to analyse the expression of CTAs (MAGE-A3, C1, NY-ESO and SSX1) by RT-PCR in patients diagnosed with de novo multiple myeloma admitted to the Haematology Department of Hospital General de México. Our results proved that there is presence of these genes in multiple myeloma and that they may be involved in resistance to therapy, disease progression and overall survival.
Historical comparison of CTA gene expression in multiple myeloma.
| CTA | Rate of expression | Study | Clinical association |
|---|---|---|---|
| MAGE-A3 | 55% | Atanackovic et al., 2007 | Early relapses post-transplant |
| 41% | Andrade et al., 2008 | Advanced disease. Poor prognosis | |
| MAGE-C1 | 50–75% | Jungbluth et al., 2005 | Progression/stage 3 |
| 57% | Tinguely et al., 2008 | Lower survival rates | |
| 77% | Andrade et al., 2008 | Advanced disease. Poor prognosis | |
| NY-ESO-1 | 31–60% | Van-Rhee et al., 2005 | Poor prognosis, relapses |
| SSX1 | 35% | Atanackovic et al., 2007 | Increased immunogenicity |
| 30% | Van-Duin et al., 2011 | Lower survival and progression-free events | |
| 42% | Taylor et al., 2005 | Co-expression with other members of the SSX family is correlated with poor prognosis |
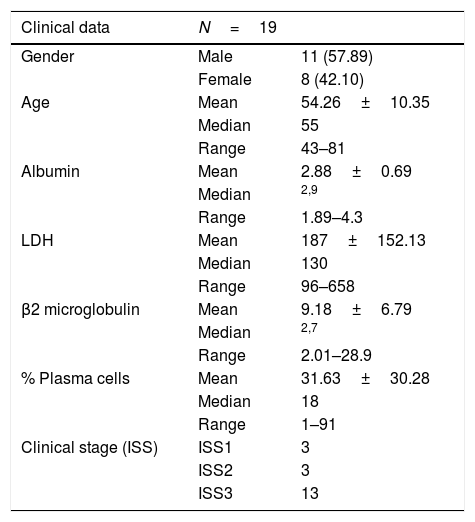
The prospective, experimental study was conducted from January to December 2015 in the Haematology Section of the Department of Molecular Biology. Bone marrow was obtained from 19 patients with multiple myeloma, 11 males (57.89%) and 8 females (42.10%); the mean age was 54 (43–81). The clinical characteristics of the patients are shown in Table 2. The study was approved by the Hospital General de México Independent Ethics Committee. Informed consent was obtained from each participant.
Clinical characteristics of the population.
| Clinical data | N=19 | |
|---|---|---|
| Gender | Male | 11 (57.89) |
| Female | 8 (42.10) | |
| Age | Mean | 54.26±10.35 |
| Median | 55 | |
| Range | 43–81 | |
| Albumin | Mean | 2.88±0.69 |
| Median | 2,9 | |
| Range | 1.89–4.3 | |
| LDH | Mean | 187±152.13 |
| Median | 130 | |
| Range | 96–658 | |
| β2 microglobulin | Mean | 9.18±6.79 |
| Median | 2,7 | |
| Range | 2.01–28.9 | |
| % Plasma cells | Mean | 31.63±30.28 |
| Median | 18 | |
| Range | 1–91 | |
| Clinical stage (ISS) | ISS1 | 3 |
| ISS2 | 3 | |
| ISS3 | 13 |
LDH: lactate dehydrogenase; ISS: international staging system.
The cell lines used were MM.1R (lymphoblast B, extramedullary multiple myeloma; positive for NY-ESO-1) and K-562 (lymphoblast, CML; positive for MAGE-A3, MAGE-C1, NY-ESO-1, SSX1). All the lines were obtained from ATCC®. The cultures were done in RPMI-1640 medium (Invitrogen, Life Technologies Carlsbad, CA) supplemented with 10% foetal bovine serum (FBS) (Invitrogen, Life Technologies Carlsbad, CA), 1mM sodium pyruvate (Hyclone Laboratories), 1% penicillin/streptomycin (Gibco, Life Technologies); in an atmosphere of 5% CO2 at 37°C.
Extraction of mononuclear cellsLeukocytes were isolated and purified by Lymphoprep (NycomedPharma AS, Oslo, Norway) and stored at −80°C until use.
Extraction of total RNATotal RNA was isolated by TRIzol® (Invitrogen Life Technologies) according to the manufacturer's instructions, described by Chomczynski and Sacchi. The concentration and purity of total RNA was determined in a UV–vis spectrophotometer (Thermo Scientific, Genesys 10S UV–vis). The integrity of the genetic material was confirmed by 1.5% agarose gel electrophoresis at 70V for 40min. The RNA was stored at −80°C until needed.
Synthesis of cDNA and RT-PCRFor the synthesis of cDNA, 2.5μg of RNA, 1μg of Oligo dT (PROMEGA®, Madison WI, USA) and 200 U M-MLV (PROMEGA, Madison WI, USA) were used.
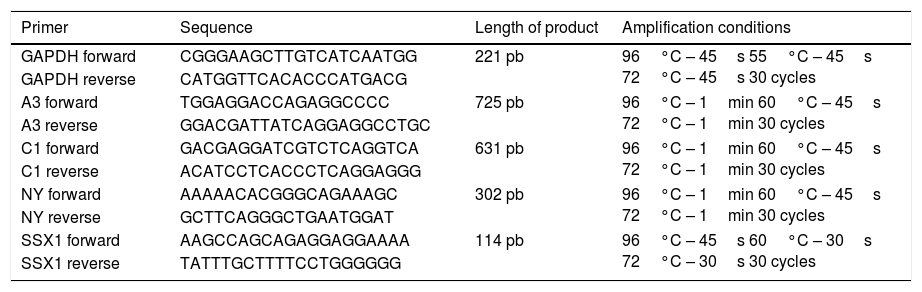
The PCR assays were carried out in a Multigene™ Optimax Thermal Cycler (Labnet). The GAPDH gene was used as positive control to validate the reactions. The genes analysed17 and their respective sequences are shown in Table 3.
Sequences and amplification conditions used.
| Primer | Sequence | Length of product | Amplification conditions |
|---|---|---|---|
| GAPDH forward | CGGGAAGCTTGTCATCAATGG | 221 pb | 96°C – 45s 55°C – 45s 72°C – 45s 30 cycles |
| GAPDH reverse | CATGGTTCACACCCATGACG | ||
| A3 forward | TGGAGGACCAGAGGCCCC | 725 pb | 96°C – 1min 60°C – 45s 72°C – 1min 30 cycles |
| A3 reverse | GGACGATTATCAGGAGGCCTGC | ||
| C1 forward | GACGAGGATCGTCTCAGGTCA | 631 pb | 96°C – 1min 60°C – 45s 72°C – 1min 30 cycles |
| C1 reverse | ACATCCTCACCCTCAGGAGGG | ||
| NY forward | AAAAACACGGGCAGAAAGC | 302 pb | 96°C – 1min 60°C – 45s 72°C – 1min 30 cycles |
| NY reverse | GCTTCAGGGCTGAATGGAT | ||
| SSX1 forward | AAGCCAGCAGAGGAGGAAAA | 114 pb | 96°C – 45s 60°C – 30s 72°C – 30s 30 cycles |
| SSX1 reverse | TATTTGCTTTTCCTGGGGGG |
The amplified products were visualised on a 2% agarose gel stained with Midori Green Advance (Nippon Genetics, Germany).
The amplified products were sequenced using the ABI Prism Dye Terminator Cycle Sequencing Kit. The alignment was corroborated by the Gene-Bank BLASTN programme, obtaining a percentage similarity of 99.9% with the CTA genes used.
Statistical analysisThe correlation between the expression of CTA genes and clinical variables was performed with the Chi-square test and Fisher's exact test, considering p≤0.05 as significant. The statistical programme used was SPSS Version 20 (Statistical Package for Social Sciences, SPSS Inc., Chicago, USA).
ResultsThe characteristics of the study population are shown in Table 1. Mean age was 54.26±10.35 (range 43–81), median 55, males 57.89% (11/19), females 42.10% (8/19) and albumin 2.88±0.69g/dl (range 1.89–4.3). Mean LDH was 187IU/l and mean β2 microglobulin 9.18mg/dl. There were 13 patients in ISS stage III, three in ISSII and three in ISSI. The Ig class was IgA in four patients, IgG in seven, IgE in one and IgM in one and Bence Jones in three; non-secretory in two patients and biclonal in one. Of the 19 patients, 11 were in Durie-Salmon stage I, two were in stage II and the remaining six were in stage III.
Expression of the MAGE-A3, MAGE-C1, NY-ESO-1 and SSX1 genes was assessed by RT-PCR in the bone marrow of 19 patients with multiple myeloma. The tests used for each gene are shown in Fig. 1. Fig. 2 shows an image representing a patient who expressed MAGE-A3, NY-ESO and SSX1. The rates of expression were 57.89% (11/19) for SSX1, 21.05% (4/19) for MAGE-A3 and 15.79% (3/19) for NY-ESO-1; the MAGE-C1 gene was found only in 5.26% (1/19) (Fig. 1).
 Lane 1, molecular weight marker; Lane 2, negative control reaction; Lane 3, β2-microglobulin endogenous control gene; Lane 4, MAGE-A3; Lane 5, MAGE-C1; Lane 6, NY-ESO; Lane 7, SSX1.")

Analysing CTA expression in patients according to ISS stage, among patients in stage I, NY-ESO-1 and SSX1 gene expression was found in 33.33% (1/3) and 66.66% (2/3) respectively. Among patients in stage II, MAGE-A3 and SSX1 gene expression was found in 33.33% (1/3) and 66.66% (2/3) respectively. Expression of all the genes was found among patients in stage III; however, not all patients co-expressed these genes and in this group, 30.76% (4/13) did not express any CTA. The gene found in the highest proportion was SSX1; in 53.84% (7/13) of patients in this group. The MAGE-A3, NY-ESO-1 and MAGE-C1 genes were found in 23.07% (3/13), 15.38% (2/13) and 7.69% (1/13) respectively (Graphs 1 and 2).


Of the patients who were Durie-Salmon stage I, 18.18% (2/11) expressed MAGE-A3, 9.09% (1/11) MAGE-C1, 18.18% (2/11) NY-ESO-1, and 72.72% (8/11) SSX1. None of the patients in stage II expressed any of the genes while, of the patients in stage III, 33.33% (2/6) expressed MAGE-A3, 16.66% (1/6) NY-ESO and 50% (3/6) SSX1. MAGE-C1 was not found in any of these patients (Graph 3).

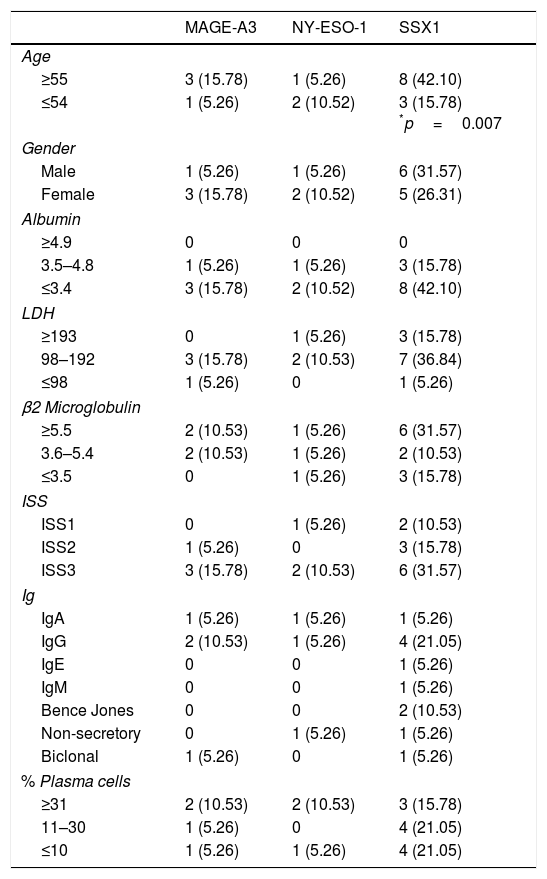
Analysis of the clinical parameters (age, gender, albumin, LDH, β2 microglobulin, ISS, type of Ig and percentage of plasma cells) showed correlation between the presence of the SSX1 gene and age in patients over 55, with p=0.007. The age cut-off point was based on the median of the population. There was no relationship between any of the other parameters and the expression of any of the CTAs (Table 4).
Rate of expression and clinical correlation of CTA genes in myeloma.
| MAGE-A3 | NY-ESO-1 | SSX1 | |
|---|---|---|---|
| Age | |||
| ≥55 | 3 (15.78) | 1 (5.26) | 8 (42.10) |
| ≤54 | 1 (5.26) | 2 (10.52) | 3 (15.78) *p=0.007 |
| Gender | |||
| Male | 1 (5.26) | 1 (5.26) | 6 (31.57) |
| Female | 3 (15.78) | 2 (10.52) | 5 (26.31) |
| Albumin | |||
| ≥4.9 | 0 | 0 | 0 |
| 3.5–4.8 | 1 (5.26) | 1 (5.26) | 3 (15.78) |
| ≤3.4 | 3 (15.78) | 2 (10.52) | 8 (42.10) |
| LDH | |||
| ≥193 | 0 | 1 (5.26) | 3 (15.78) |
| 98–192 | 3 (15.78) | 2 (10.53) | 7 (36.84) |
| ≤98 | 1 (5.26) | 0 | 1 (5.26) |
| β2 Microglobulin | |||
| ≥5.5 | 2 (10.53) | 1 (5.26) | 6 (31.57) |
| 3.6–5.4 | 2 (10.53) | 1 (5.26) | 2 (10.53) |
| ≤3.5 | 0 | 1 (5.26) | 3 (15.78) |
| ISS | |||
| ISS1 | 0 | 1 (5.26) | 2 (10.53) |
| ISS2 | 1 (5.26) | 0 | 3 (15.78) |
| ISS3 | 3 (15.78) | 2 (10.53) | 6 (31.57) |
| Ig | |||
| IgA | 1 (5.26) | 1 (5.26) | 1 (5.26) |
| IgG | 2 (10.53) | 1 (5.26) | 4 (21.05) |
| IgE | 0 | 0 | 1 (5.26) |
| IgM | 0 | 0 | 1 (5.26) |
| Bence Jones | 0 | 0 | 2 (10.53) |
| Non-secretory | 0 | 1 (5.26) | 1 (5.26) |
| Biclonal | 1 (5.26) | 0 | 1 (5.26) |
| % Plasma cells | |||
| ≥31 | 2 (10.53) | 2 (10.53) | 3 (15.78) |
| 11–30 | 1 (5.26) | 0 | 4 (21.05) |
| ≤10 | 1 (5.26) | 1 (5.26) | 4 (21.05) |
Multiple myeloma has heterogeneous clinical characteristics and there is variability in both the response to treatment and the prognosis.19 Although survival may be estimated based on clinical parameters and on cytogenetic abnormalities, debate surrounds their utility as prognostic marker for survival. It is therefore important to have new molecular markers available to bolster the diagnosis and follow-up of patients with multiple myeloma.
We evaluated the clinical relevance of the expression of cancer/testis genes at the time of diagnosis in patients with multiple myeloma who were admitted to the Haematology Department, Hospital General de México. We decided to study the expression of the MAGE-A3, C1, NY-ESO and SSX1 genes, since they belong to the group of CTAs expressed in various cancers and are associated with clinical factors of poor prognosis and lower survival rates.13–16 We found the SSX1 gene, at 57.8%, to be the gene expressed most often in our population. In 2007, Atanackovic et al.17 reported expression of this gene in 34% of patients with multiple myeloma. The difference may be due to the methods used, i.e. immunohistochemistry as opposed to RT-PCR; RT-PCR is more sensitive, which may explain the higher rate. Expression of MAGE-A3 was 21% and of NY-ESO, 15%. However, the reported rates of expression of these genes are 54% for MAGE-A3 and 45–60% for NY-ESO.19 This may be related to the different isotypes expressed by the plasma cell, or the molecular alterations. Some studies have reported that the CTA with the highest rate is MAGE-C1, at 66–77%.17 This differs considerably from the rate of 5% we found in our patients, representing the lowest rate of expression in the population studied. These differences could be due to the type of population, risk factors and immunophenotype of the cell analysed. In our analysis of correlation between expression of the CTAs and clinical parameters, the only correlation we found was between the SSX1 gene and age. In the only report of such a correlation in the literature, Curioni-Fontecedro et al.,16 found expression of MAGE-C1 to be associated with the presence of the IgA isotype in patients with multiple myeloma. There have been no other reports to date of association with any other clinical parameters such as gender, LDH, ISS or percentage of plasma cells. Age would seem to be the only factor with a statistically significant correlation. Van Duin et al.18 reported no correlation between SSX1 expression and age. Significantly, the variations may be due to classification by age groups, dividing into three groups, compared to only two proposed groups for our population, 49 and under versus 50 and over, in accordance with international guidelines for risk.
In conclusion, our results show that there is CTA expression in myeloma and that the most common CTA gene among these patients is SSX1, which was found to be associated with age. The identification of these genes in cancers is of great importance for prognosis, monitoring response to treatment and disease progression, and for management with new targeted therapies.
Ethical disclosureProtection of human and animal subjectsThe authors declare that the procedures followed were in accordance with the regulations of the relevant clinical research ethics committee and with those of the Code of Ethics of the World Medical Association (Declaration of Helsinki).
Confidentiality of dataThe authors declare that they have followed the protocols of their work centre on the publication of patient data.
Right to privacy and informed consentThe authors have obtained the written informed consent of the patients or subjects mentioned in the article. The corresponding author is in possession of this document.
Conflict of interestThe authors declare that they have no conflict of interests.
This work was supported by the Consejo Nacional de Ciencia y Tecnologia (CONACYT) [Mexican Council for Science and Technology], registered under project number 162269, and by the Research Department of Hospital General de México under registry numbers DIC/09/04/03/131, DIC/08/204/04/017, DIC/12/204/05/01.