


The aim of the study was to compare three methods for high-score measurement in children, Caton–Deschamps, Blackburne–Peel and Koshino–Sugimoto, to determine the normal value of each method in a group of normal children.
Materials and methodsA cross-sectional study on knee X-rays of normal children. Three orthopaedic surgeons measured the Caton–Deschamps, Blackburne–Peel and Koshino–Sugimoto indices. Concordance was assessed using the intraclass correlation coefficient. For interobserver variability, the measurements of each observer for each index were compared and for intraobserver variability, the coefficient between the 2 measurements was calculated by the same observer at 2 different times.
Results140 knee X-rays divided into 4 age groups were obtained. For the Blackburne–Peel index, an average median of the 3 observers was obtained of 1.07 and with P5–P95 (0.76–1.60). For the Caton–Deschamps index, an average median of the three observers of 1.22 was obtained and with P5–P95 (0.91–1.70). For the Koshino–Sugimoto index, we obtained an average median of the 3 observers of 1.16 and with P5–P95 (0.99–1.36).
DiscussionThis study shows that the Koshino–Sugimoto index had the highest reliability, reproducibility and similarity in the population studied, both intraobserver and interobserver.
The other methods evaluated also had variability indices to be taken into account, but were inferior to the Koshino–Sugimoto index.
El objetivo del estudio es comparar 3 métodos para medición de rótula alta en niños, Caton-Deschamps, Blackburne-Peel y Koshino-Sugimoto, y determinar cuál es el valor normal de cada método en un grupo de niños normales.
Materiales y métodosEs un estudio de corte transversal en radiografías de rodillas de niños normales. Tres cirujanos ortopédicos midieron los índices de Caton-Deschamps, Blackburne-Peel y Koshino-Sugimoto. Se realizó la evaluación de la concordancia mediante el coeficiente de correlación intraclase. Para la variabilidad interobservador, se compararon las mediciones de cada observador para cada índice y para la variabilidad intraobservador se calculó el coeficiente entre las 2 mediciones por un mismo observador en 2 momentos diferentes.
ResultadosSe obtuvieron 140 radiografías de rodilla divididas en 4 grupos etarios. Para el índice de Blackburne-Peel se obtuvo una mediana en promedio de los 3 observadores de 1,07 y con P5-P95 (0,76-1,60). Para el índice de Caton-Deschamps se obtuvo una mediana en promedio de los 3 observadores de 1,22 y con P5-P95 (0,91-1,70). Para el índice de Koshino-Sugimoto se obtuvo una mediana en promedio de los 3 observadores de 1,16 y con P5-P95 (0,99-1,36).
DiscusiónEste estudio muestra que el índice de Koshino-Sugimoto fue el de mayor fiabilidad, reproducibilidad y similitud en la población estudiada tanto intraobservador como interobservador.
Los otros métodos evaluados también presentan unos índices de variabilidad a tener en consideración pero inferiores al de Koshino-Sugimoto.
The patella is the largest sesamoid bone in the body, and it is located in the trochlear notch of the femur; the quadriceps tendon fibres envelop the anterior face and merge with the patellar tendon distally.1 The chief function of the patella is to increase the length of the quadriceps lever respecting the patellar tendon during knee extension, leading to an increase in strength of up to 50%.2,3 The patella acts as a guide for knee extension by centring in the trochlea and preventing luxation of the said mechanism, while it also prevents the quadriceps from coming into direct contact with the femur.2,3
Radiological and anatomical studies of the skeletal development of the knee show that ossification of the patella commences at around the age of 4–6 years old, and that it is almost complete at approximately 16 years old.4
The anterior tuberosity of the tibia commences ossification at 10 years old and terminates at an average of 15 years old, depending on sexual characteristics.4,5
The upper tibial epiphysis commences ossification within the first 3 months after birth, with an edge that is irregular at first, and it terminates ossification at from 5 to 6 years old.6
The lower femoral epiphysis commences ossification in the third quarter of life within the womb, terminating at approximately 3 years old.7–9
A high patella reduces the force applied by the extensor muscles of the knee, giving rise to abnormal concentrations of force at the insertion of the patellar tendon. This in turn leads to a mechanical disadvantage for the whole knee in a range of activities.2,3 The anomalous position is associated with several pathological conditions such as Osgood–Schlatter disease,10,11 patellar instability,12 knee extensor mechanism disorders in immature athletes,13 cerebral palsy14,15 and also reconstruction following patellofemoral instability.16
Many radiographic imaging techniques have been described to measure patellar height. They are classified in 2 groups: those that take the relationship of the patella with the femur as their reference (direct) and other which examine the relationship of the patella with the tibia (indirect).17
Although several methods used for paediatric patients are based on extrapolating methods used in adults, the great majority use bone references that are highly variable, depending on the degree of skeletal maturity.17,18
These methods include those used by Caton–Deschamps, Blackburne–Peel and Koshino–Sugimoto17–22 (Fig. 1).
 Caton–Deschamps. (B) Blackburne–Peel. (C) Koshino–Sugimoto.")
The aim of this study is to describe and compare 3 methods and to determine the normal value for each method in a normal population group. It also compares each method intra and interobserver.
Materials and methodsThis is a cross-sectional study which uses knee X-ray images of normal children taken consecutively when they consulted due to disease or injury unconnected with the knee, and which were included in the X-ray records of the hospital where the study was based from September 2012 until December 2014.
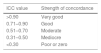
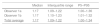
Data were recorded in an Excel 2013 (Microsoft office®) spreadsheet. The variables used included age, side, sex and degree of knee flexion. The following scales were also measured for each knee: Caton–Deschamps (normal values from 0.6 to 1.3), Blackburne–Peel (normal values from 0.8 to 1.0) and Koshino–Sugimoto (normal values from 0.99 to 1.2 for knees with a flexion of from 30° to 90°) (Fig. 2). 3 measurements were taken independently by each observer to calculate each one of the 3 scales in the X-ray images, without knowledge of either patient data or the measurements of the other observers. The observers were an orthopaedic surgeon trained in knee surgery and 2 orthopaedic surgeons trained in paediatric orthopaedia. One of the 2 latter surgeons repeated the measurements 24 weeks after the first measurement without knowledge of patient data or the results of the previous measurements. Agreement was then evaluated using the intraclass correlation coefficient. The measurements of each observer for each scale were compared to determine interobserver variability for each scale, while the coefficient between 2 measurements by the same observer at 2 different times was calculated for intraobserver variability. The coefficients were interpreted according to Table 1. Taking into account possible changes in the variability of coefficients with ossification at different ages, they were divided according to age group. The unit of analysis was each knee. The median and interquartile ranges are presented to describe the scales because they did not have a normal distribution. The range between percentiles 5 and 95 is also shown (P5–P95), as a proposal of normal values for the population according to age group.
, the Blackburne–Peel scale (normal 0.8–1.0) and the Koshino–Sugimoto scale (normal: 0.99–1.2).")
The inclusion criteria were individuals who had been subjected to knee X-rays, patients with knee X-ray images due to pathologies unconnected with the knee, in an age range from 6 to 12 years old, X-ray images of the knee taken at a distance of 115cm and knee X-ray images taken in a range of flexion from 30° to 80°. Exclusion criteria were the presence of osteosynthesis material around the knee, radiological findings of alterations in bone density, patients with a previous diagnosis of cerebral palsy, fractures of the patella, proximal end of the tibia and/or the distal end of the femur, the presence of neoplasias around the knee, the presence of hemarthrosis and patients with a history of haemophilia, septic arthritis or nephritic syndrome.
This study was undertaken according to ethical norms based on the Helsinki declaration, and it was approved by the Hospital Ethics Committee.
The authors have no conflict of interests to declare and this study had no source of financing.
ResultsOne hundred and forty knee X-rays were obtained and classified in 4 groups according to age, distributed as follows: 6–7 years old, 8–9 years old, 10–11 years old and 12 years old. 84 of these X-ray images were of males (60%) and 56 were of females (40%). The average knee flexion angle was 42.8° (SD: 11.8) (from 30° to 78°). There were 72 right knees (51.4%) and 68 left knees (48.6%).
The median, interquartile range and measurement of P5 and P95 were evaluated for each observer in the interobserver findings.
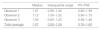
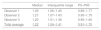
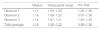
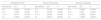
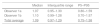
The median average for the three observers in the Blackburne–Peel scale was 1.07, with P5–P95: 0.76–1.60. The mean average for the three observers in the Caton–Deschamps scale was 1.22, with P5–P95: 0.91–1.70. The mean average for the three observers in the Koshino–Sugimoto scale was 1.16, with P5–P95: 0.99–1.36 (Tables 2–4).
Interobserver evaluation for the Blackburne–Peel method (normal values: 0.8–1.0).
| Median | Interquartile range | P5–P95 | |
|---|---|---|---|
| Observer 1 | 1.07 | 0.95–1.30 | 0.80–1.59 |
| Observer 2 | 1.12 | 1.00–1.32 | 0.90–1.75 |
| Observer 3 | 1.02 | 0.83–1.23 | 0.58–1.46 |
| Total average | 1.07 | 0.93–1.29 | 0.76–1.60 |
P5–P95: percentiles 5 and 95.
Interobserver evaluation for the Caton–Deschamps method (normal values: 0.6–1.3).
| Median | Interquartile range | P5–P95 | |
|---|---|---|---|
| Observer 1 | 1.25 | 1.06–1.45 | 0.88–1.77 |
| Observer 2 | 1.21 | 1.07–1.43 | 0.90–1.75 |
| Observer 3 | 1.20 | 1.01–1.36 | 0.95–1.60 |
| Total average | 1.22 | 1.04–1.41 | 0.91–1.70 |
P5–P95: percentiles 5 and 95.
Interobserver evaluation for the Koshino–Sugimoto method (normal values: 0.99–1.2 for knees flexed at 30–90°).
| Median | Interquartile range | P5–P95 | |
|---|---|---|---|
| Observer 1 | 1.17 | 1.09–1.23 | 1.00–1.36 |
| Observer 2 | 1.16 | 1.08–1.22 | 0.97–1.38 |
| Observer 3 | 1.14 | 1.07–1.21 | 1.00–1.35 |
| Total average | 1.16 | 1.08–1.22 | 0.99–1.36 |
P5–P95: percentiles 5 and 95.
Apart from the figures obtained, an intraclass correlation coefficient was calculated for the interobserver evaluation results (Table 5).
Interobserver intraclass correlation coefficient.
| Blackburne–Peel | Caton–Deschamps | Koshino–Sugimoto | ||||||
|---|---|---|---|---|---|---|---|---|
| Age (years) | ICC | P | Age (years) | ICC | P | Age (years) | ICC | P |
| 6–7 | 0.4472 | <0.0001 | 6–7 | 0.7276 | <0.0001 | 6–7 | 0.8525 | <0.0001 |
| 8–9 | 0.7058 | <0.0001 | 8–9 | 0.8178 | <0.0001 | 8–9 | 0.896 | <0.0001 |
| 10–11 | 0.4747 | <0.0001 | 10–11 | 0.6532 | <0.0001 | 10–11 | 0.3486 | 0.0004 |
| 12 | 0.7593 | <0.0001 | 12 | 0.8513 | <0.0001 | 12 | 0.9558 | <0.0001 |
ICC: interclass correlation coefficient.
For the intraobserver measurement the median and interquartile range were calculated, and P5 and P95 were measured after a 24-week time lapse.
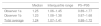
The mean average for both measurements in the Blackburne–Peel scale was 1.09, with P5–P95: 0.75–1.58. The mean average for both measurements in the Caton–Deschamps 1.24, with P5–P95: 0.88–1.72. The mean average for both measurements in the Koshino–Sugimoto scale was 1.17, with P5–P95: 1.00–1.34 (Tables 6–8).
Intraobserver evaluation for the Koshino–Sugimoto method (normal values: 0.99–1.2 for knees flexed from 30° to 90°).
| Median | Interquartile range | P5–P95 | |
|---|---|---|---|
| Observer 1a | 1.17 | 1.09–1.22 | 1.00–1.36 |
| Observer 1b | 1.17 | 1.10–1.23 | 1.01–1.32 |
| Total average | 1.17 | 1.09–1.22 | 1.00–1.34 |
P5–P95: percentiles 5 and 95.
Apart from the figures obtained, an intraclass correlation coefficient was calculated for the interobserver evaluation results (Table 9).
Intraobserver intraclass correlation coefficient.
| Blackburne–Peel | Caton–Deschamps | Koshino–Sugimoto | ||||||
|---|---|---|---|---|---|---|---|---|
| Age (years) | ICC | P | Age (years) | ICC | P | Age (years) | ICC | P |
| 6–7 | 0.8861 | <0.0001 | 6–7 | 0.856 | <0.0001 | 6–7 | 0.8847 | <0.0001 |
| 8–9 | 0.8685 | <0.0001 | 8–9 | 0.8105 | <0.0001 | 8–9 | 0.9689 | <0.0001 |
| 10–11 | 0.7487 | <0.0001 | 10–11 | 0.8361 | <0.0001 | 10–11 | 0.9748 | <0.0001 |
| 12 | 0.8403 | 0.0126 | 12 | 0.7982 | <0.0001 | 12 | 0.9866 | <0.0001 |
ICC: interclass correlation coefficient.
The centre of patella ossification appears at from 4 to 6 years old, and its ossification is completed at from 16 to 17 years old. It is hard to evaluate the position of the patella in children and adolescents, due essentially to difficulties in visualising the cartilaginous part of the patella, the tibial tubercle and the patellar tendon. This may lead to errors in the interpretation of X-ray images in this group of patients.
Measurement of patella height is a valuable tool for the diagnosis of knee complaints and planning treatment. A range of methods have been suggested to measure patella height, although none has been accepted as the gold standard.17,18
This study evaluates 3 immature skeleton measurement techniques in a normal population: Koshino–Sugimoto,19 Caton–Deschamps20 and Blackburne–Peel.22 Interobservers and intraobserver variability was evaluated together with intraclass coefficients.
The intraclass correlation coefficients were very good and good for the Koshino–Sugimoto scale, from good to moderate for the Caton–Deschamps scale and from good to mediocre for the Blackburne–Peel scale in interobserver measurements. It is striking that although there is an alteration in the findings in the 10–11 year-old age range, this is constant in all of the scales for the same age range. This may be explained by an alteration in readings during the period when the structures around the knee undergo ossification.
The intraclass correlation coefficient for the results of intraobserver evaluation was very good and good for the Koshino–Sugimoto scale, while it was good for the Caton–Deschamps and Blackburne–Peel scales.
Aparicio et al. analysed the same three scales evaluated in this study in a population of 36 patients aged from 10 to 15 years old. They show that the Caton–Deschamps scale is simple, reliable and reproducible when used in adolescents to measure patellar height. They also describe the Koshino–Sugimoto scale as easy to obtain and giving a high interobserver correlation.23 The population in our study had a more immature skeleton, at from 6 to 12 years old, and it found that the Koshino–Sugimoto was the best of all three scales.
We would like to underline that of the values published within normal limits in the original descriptions of Koshino–Sugimoto,19 Caton–Deschamps20 and Blackburne–Peel,22 those of the first authors are the most similar to the results of our study, so that we consider this scale to be completely applicable to our paediatric population.
Park et al.18 evaluated Asian paediatric patients and state that the method which most accurately determines normal and highly reproducible values is the one used by Koshino–Sugimoto.
Although the other methods evaluated also show rates of variability that should be taken into account, they are inferior to those of the Koshino–Sugimoto technique.
The determination of patellar height in paediatric patients is highly useful in conditions such as Osgood–Schlatter disease, patellar instability or knee extensor mechanism disorder in immature athletes, cerebral palsy and the reconstruction due to patellofemoral instability.10–16
One of the strengths of this study is the sample of images, which it evaluates, given that the previous comparative study that reviewed and compared images was the one by Park et al., with 108 studies. Another strength is that this study included patients with an immature skeleton aged from 6 to 12 years old, as these ages were not covered in other works.
The limitation of this work is that measurements were taken using X-ray images taken retrospectively and lacking a standard control of flexion and rotation. Although this may alter the measurements, all three measurements were taken using the same study subject.
ConclusionsThis study shows that the Koshino–Sugimoto scale is the best in terms of reliability, reproducibility and similarity in the population studied, in inter- as well as intraobserver terms. We consider the Koshino–Sugimoto method to be the best for measuring patellar height in paediatric patients aged from 6 to 12 years old, with a median of 1.16 and a range depending on percentiles (P5–P95) from 0.992 to 1.361.
Level of evidenceLevel of evidence II.
FinancingThis work was not financed.
Conflict of interestsThe authors have no conflict of interests to declare.
Please cite this article as: Vergara-Amador E, Davalos Herrera D, Guevara OA. Valores normales de 3 métodos para determinar rótula alta en niños de 6 a 12 años. Rev Esp Cir Ortop Traumatol. 2018;62:442–447.
