


To evaluate the size of the glenoid in a southern Spanish population, to compare it with previous results from other populations and determine the size of the implants that are marketed for shoulder arthroplasty.
Material and methodsBetween January 2015 and December 2017, an anthropometrical study of the human glenoid was performed using computed axial tomography scans (CT) of 154 patients over 30 years old. The glenoid dimensions were analysed 3-dimensionally using 2mm interval thicknesses, determining the average height and width of the glenoid. The upper point of the glenoid geometry was determined as the supraglenoid tubercle of the ovoid glenoid surface, where the long head of the biceps tendon is thought to originate. The lower point was then positioned at the furthest point from the upper point on the glenoid contour. Anterior and posterior points were determined such that the 3-dimensional anterior–posterior distance was maximised on the plane perpendicular to the upper–lower axis. Sex differences and correlations between sides and among the respective parameters in the glenohumeral dimensions were also evaluated.
ResultsThe glenoid had an average height of 28.78mm and width of 20.27mm. The values were significantly different between the men and the women, being greater in the men. The glenoid size is well correlated with the patient's size. Direct correlations exist between the glenoid height and width and the glenoid size and the patient's height. The available metaglenoids currently on the market are no bigger than 25–24mm.
ConclusionIn comparison, the southern Spanish population have a glenoid size similar to the Caucasian population, but smaller than that of the American population. The data shown could be useful to improve the design of shoulder prostheses for the southern Spanish population.
El objetivo de este estudio es evaluar el tamaño de la glena en una población española normal, compararla con resultados previos en otras poblaciones y relacionarlo con los tamaños de implante que se comercializan para la artroplastia invertida de hombro.
Material y métodosEstudio antropométrico de la glena humana utilizando tomografías computarizadas de 154 pacientes con edades superiores a 30 años, realizados entre enero de 2015 y diciembre de 2017. Se valoran tomografías computarizadas de hombro con cortes de 2mm de grosor y 0mm de intervalo entre cortes, en algoritmo óseo y de partes blandas, realizándose reconstrucción 3D sobre la cual se obtienen mediciones de longitud y anchura de la glena. El punto superior de la glena se determinó en la zona superior del ovoide de la glena, en el tubérculo supraglenoideo, justo por debajo del reborde circunferencial que rodea la glena. El punto inferior se determinó como el punto más alejado del punto superior en el contorno de la glena, a nivel superior del reborde circunferencial que rodea la glena. Los puntos anterior y posterior fueron determinados como los extremos del eje transversal mayor en un plano perpendicular al eje superoinferior, por dentro del reborde circunferencial que rodea la glena. Las diferencias entre sexos, edad, altura, peso y relaciones de tamaños fueron evaluados.
ResultadosLa glena tiene un eje longitudinal medio de 28,78mm y una anchura de 20,27mm. Los valores del tamaño de la glena son significativamente diferentes en hombres y mujeres, siendo mayor en hombres. El tamaño de la glena está bien correlacionado con la estatura del paciente, existiendo una asociación positiva entre la estatura y la longitud y anchura de la superficie glenoidea. Las metaglenas circulares disponibles hoy en el mercado presentan tamaños no inferiores a 24-25mm de diámetro.
ConclusiónLa población del sur de España presenta un tamaño de la superficie glenoidea inferior a la población americana y semejante a la cohorte asiática. Los datos antropométricos expresados pueden ser útiles para la elección de la metaglena más apropiada en la población del sur de España.
Inverted arthroplasty of the shoulder offers us a potential surgical benefit in situations where the cuff and/or the proximal humerus is destroyed or absent. During the past decade, in spite of the fact that it is still in the research phase, there has been a trend towards increasing the number of inverted shoulder arthroplasty (ISA) procedures. This reflects the increase in indications, the success of its results and the demographic ageing of the population.1,2
The improvement in results is due in part to the progress and major modification of the design of components, in which knowledge of native shoulder anatomy is still fundamental.3,4 Nevertheless, to date and unlike other joints, few anthropometric studies are available on which to base changes in prosthetic implants.3–11
Although some shoulder prostheses have been designed for specific populations, they may be too large for the Spanish population. Previous studies12 compare the morphology of the glenohumeral joint between North America and East Asia. Their results conclude that shoulder morphology is significantly smaller, with some exceptions, in the South East Asia group. Other studies with a similar scope state that the implants available in the market are too large for the Japanese population, especially for the female sex.13
Unfortunately the size of the glenoid in the Spanish population has not been studied. Discovering the actual size of the glenoid in the Spanish population will make it possible to improve the adaptability of the implants in our country and know whether it is necessary to design new components.
This study has the purpose of evaluating the size of the glenoid in a normal population in the south of Spain, associating it with previous results in other populations and evaluating the implant sizes commercialised for shoulder arthroplasty, to propose whether other glenoid implant sizes should be produced that would be anatomically more suitable for our population.
Material and methodsWe present a descriptive anthropometric study of the glenoid. It is based on computed tomography (CT) scans of the shoulder carried out for any clinical indication (traumatic pathological process, primary arthrosis, cuff involvement), in the population of Andalusia from January 2015 to December 2017.
The study includes 154 patients, of which 106 (68.83%) were women. The average age of our sample is 66.2 years old. The following inclusion criteria were used for patients: Spanish nationality and born of Spanish parents, born in Andalucía of Andalusian parents, aged at least 30 years old and having expressly desired to take part in the study as described by giving their written consent. Patients who were not Spanish nationals or not born of Spanish parents were excluded, as were those with a history of fracture affecting the glenoid cavity, those who carried metallic surgical material that caused image-distorting artefacts, a history of glenohumeral luxations, shoulders that had been operated on even if they were not carriers of osteosynthesis material or metallic implants, obstetric brachial paralysis sequelae or bone dysplasia.
The technique used was based on CT (General Electric HI Light Speed Multislice×16 helicoidal CT) of the right and left shoulders, with slices 2mm thick and with 0mm interval between slices, in bone and soft tissue algorithm, with 3D reconstruction (Fig. 1). A study was performed with suppression of the humeral epiphysis and diaphysis for the 3D study of the scapular glenoid surface, on which the transversal and longitudinal axes of the scapular glenoid surface were measured. All of the post-process and humeral disarticulation studies were undertaken by the same radiologist.

Measurements were taken of the length and width of the glenoid in the CT of the same glenoid at 2 moments separated in time (with an interval of from 2 to 3 weeks), so that recall distortion was minimised, obtaining the definitive figure for both measurements.
The measurements of the glenoid joint surface were made by the same radiologist and orthopaedic surgeon in each one of the patients.
The points of reference for the measurements of the length and breadth of the glenoid joint surface were (Fig. 2):
- -
The upper point of the glenoid was defined as the top part of the glenoid ovoid, in the supraglenoid tubercle, just below the circumferential edge around the glenoid, understanding this to be periphery of the glenoid joint surface.
- -
The lower point was defined as the point farthest from the upper point in the outline of the glenoid, above the circumferential edge around the glenoid.
- -
The anterior and posterior points were defined as the end of the longest transversal axis in a plane perpendicular to the superoinferior axis, within the circumferential edge around the glenoid.
 height; (B) width.")
To achieve the study objectives a statistical analysis was undertaken, consisting of:
- (1)
A descriptive analysis of each one of the study variables, using frequency distribution for qualitative variables and basic summarised measurements, such as the average, quartiles and standard deviation for quantitative variables.
- (2)
The intraclass correlation coefficient (ICC) was used to prove the concordance of both measurements by the same subject of the same CT scan at 2 different times.
- (3)
The averages comparison test was used to analyse the measurements of the glenoid length and width, to compare the men and women in the sample. The fit of a multiple lineal regression model was used to study the association between the measurements of the length and width of the glenoid and the table, as well as sex and age. To measure the power of the relationship between the quantitative variables, Pearson‘s correlation coefficients matrix was calculated for each pair of the said variables.
- (4)
The univariate reference intervals were calculated for glenoid length and width, under the supposition that both measurements were independent, and then the bivariate reference interval was calculated for both measurements, which are not really independent. The IBM SPSS (v. 20.0; IBM SPSS, Armonk, NY, USA) statistical package was used for all of the statistical tests. An alpha error of 5% was accepted, with a confidence interval of 95%, so that values of P<.05 were considered to be significant.
Tests were considered to be statistically significant at 95% level of confidence. The SPSS v. 18 statistical package was used for analysis.
ResultsThe sample consists of 154 glenoids in 154 patients, of which 106 (68.83%) were women and 48 were men (31.17%). The average age of the total sample is 66.2 years old (the average of the men is 62.5 years old, while that of the women is 67.9 years old). Table 1 shows the results according to the variables of age, height and weight.
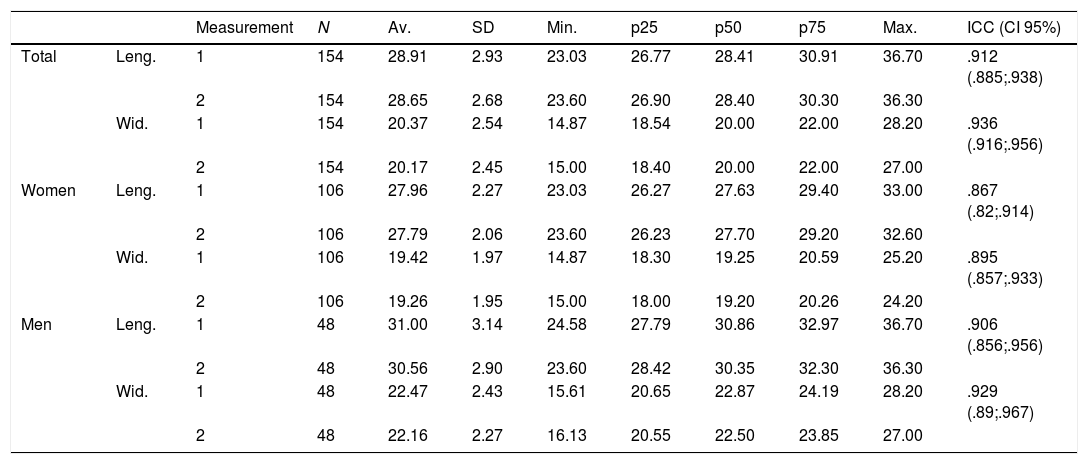
Descriptive measurement of glenoid length and width. Intraclass correlation coefficient between measurements (ICC).
| Measurement | N | Av. | SD | Min. | p25 | p50 | p75 | Max. | ICC (CI 95%) | ||
|---|---|---|---|---|---|---|---|---|---|---|---|
| Total | Leng. | 1 | 154 | 28.91 | 2.93 | 23.03 | 26.77 | 28.41 | 30.91 | 36.70 | .912 (.885;.938) |
| 2 | 154 | 28.65 | 2.68 | 23.60 | 26.90 | 28.40 | 30.30 | 36.30 | |||
| Wid. | 1 | 154 | 20.37 | 2.54 | 14.87 | 18.54 | 20.00 | 22.00 | 28.20 | .936 (.916;.956) | |
| 2 | 154 | 20.17 | 2.45 | 15.00 | 18.40 | 20.00 | 22.00 | 27.00 | |||
| Women | Leng. | 1 | 106 | 27.96 | 2.27 | 23.03 | 26.27 | 27.63 | 29.40 | 33.00 | .867 (.82;.914) |
| 2 | 106 | 27.79 | 2.06 | 23.60 | 26.23 | 27.70 | 29.20 | 32.60 | |||
| Wid. | 1 | 106 | 19.42 | 1.97 | 14.87 | 18.30 | 19.25 | 20.59 | 25.20 | .895 (.857;.933) | |
| 2 | 106 | 19.26 | 1.95 | 15.00 | 18.00 | 19.20 | 20.26 | 24.20 | |||
| Men | Leng. | 1 | 48 | 31.00 | 3.14 | 24.58 | 27.79 | 30.86 | 32.97 | 36.70 | .906 (.856;.956) |
| 2 | 48 | 30.56 | 2.90 | 23.60 | 28.42 | 30.35 | 32.30 | 36.30 | |||
| Wid. | 1 | 48 | 22.47 | 2.43 | 15.61 | 20.65 | 22.87 | 24.19 | 28.20 | .929 (.89;.967) | |
| 2 | 48 | 22.16 | 2.27 | 16.13 | 20.55 | 22.50 | 23.85 | 27.00 |
Max.: maximum value; Min.: minimum value; N: sample; p25: percentile 25; p50: median; p75: percentile 75; SD: standard deviation.
The descriptive measurements of all of the numerical variables in our database for the total sample and the samples of men and women are shown in Table 2; this also shows the measurements comparison tests between men and women.
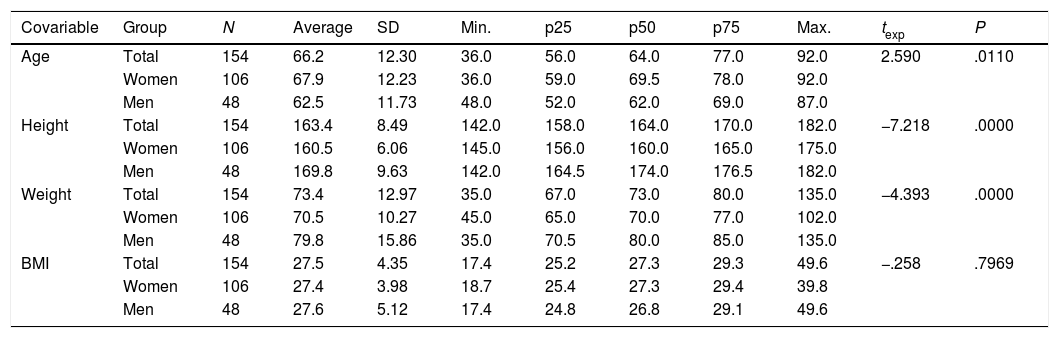
Description of age, height, weight and BMI in women and men and in the total sample.
| Covariable | Group | N | Average | SD | Min. | p25 | p50 | p75 | Max. | texp | P |
|---|---|---|---|---|---|---|---|---|---|---|---|
| Age | Total | 154 | 66.2 | 12.30 | 36.0 | 56.0 | 64.0 | 77.0 | 92.0 | 2.590 | .0110 |
| Women | 106 | 67.9 | 12.23 | 36.0 | 59.0 | 69.5 | 78.0 | 92.0 | |||
| Men | 48 | 62.5 | 11.73 | 48.0 | 52.0 | 62.0 | 69.0 | 87.0 | |||
| Height | Total | 154 | 163.4 | 8.49 | 142.0 | 158.0 | 164.0 | 170.0 | 182.0 | −7.218 | .0000 |
| Women | 106 | 160.5 | 6.06 | 145.0 | 156.0 | 160.0 | 165.0 | 175.0 | |||
| Men | 48 | 169.8 | 9.63 | 142.0 | 164.5 | 174.0 | 176.5 | 182.0 | |||
| Weight | Total | 154 | 73.4 | 12.97 | 35.0 | 67.0 | 73.0 | 80.0 | 135.0 | −4.393 | .0000 |
| Women | 106 | 70.5 | 10.27 | 45.0 | 65.0 | 70.0 | 77.0 | 102.0 | |||
| Men | 48 | 79.8 | 15.86 | 35.0 | 70.5 | 80.0 | 85.0 | 135.0 | |||
| BMI | Total | 154 | 27.5 | 4.35 | 17.4 | 25.2 | 27.3 | 29.3 | 49.6 | −.258 | .7969 |
| Women | 106 | 27.4 | 3.98 | 18.7 | 25.4 | 27.3 | 29.4 | 39.8 | |||
| Men | 48 | 27.6 | 5.12 | 17.4 | 24.8 | 26.8 | 29.1 | 49.6 |
Comparison between women and men using Student's test.
BMI: body mass index; Max: maximum value; Min: minimum value; N: sample; p25: percentile 25; p50: median; p75: percentile 75; SD: standard deviation.
The ages in our sample ranged from 36 years old to 92 years old, giving a broad age range. It may be deduced from comparing the average ages of the sexes that the average age of the women is significantly higher than the average age of the men, P=.0110. The average age of the women is higher than that of the men by 5.4 years old, and this shows that in the population from which the sample was extracted, the women are older than the men.
The average height of the women is significantly lower than that of the men (P<.001), showing that in the population from which the sample of women was extracted, they are on average shorter than the men. The same can be said of their weight, as the difference in their average weights amounts to 9.3kg.
We are able to state that the ICC are quite high for length as well as width, and the intraobserver concordance may be described as very good. More specifically and considering the cut-off points of Landis and Koch, where an ICC above 0.81 is considered to represent almost perfect concordance,14 we are able to state that the concordance between averages is very good, although it is somewhat better for width than it is for length.
In case the reliability of the measurements may be influenced by sex, the ICC have been shown (in Table 2) for women and men, who are represented in the sample to different degrees. The ICC pattern found in the overall sample for length is less than it is for width, in men as well as in women; nevertheless, the ICC in women are lower – they are not so good – as it in the men. But in all cases the ICC are higher, by a large margin, than 0.81, so that we are talking about very high levels of concordance. In any case, the measurements taken have very high values that are sufficient to show their reproducibility or reliability, so that the variability introduced in the sample in our analysis can be ignored.
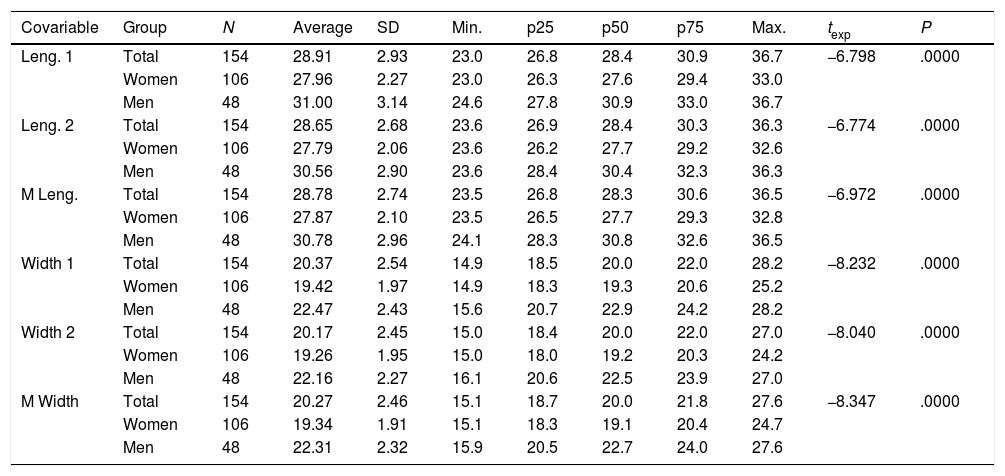
Table 3 shows the values for the variables in both measurements of glenoid length and width, together with the average of both measurements. The length averages in men and in women are significantly different. The average length in men is 30.78mm, and it is 27.87mm in women, i.e., the longitudinal axis of the glenoid is 2.97mm longer in men, with a confidence interval of 95%. For the width we are able to state that the measurement of the same in men and women is significantly different, as the average width in the men is significantly greater than the average in the women (2.97mm), with a 95% confidence interval: 2.27–3.67.
Description of length and width (2 measurements and the average measurement) in women, men and the total sample.
| Covariable | Group | N | Average | SD | Min. | p25 | p50 | p75 | Max. | texp | P |
|---|---|---|---|---|---|---|---|---|---|---|---|
| Leng. 1 | Total | 154 | 28.91 | 2.93 | 23.0 | 26.8 | 28.4 | 30.9 | 36.7 | −6.798 | .0000 |
| Women | 106 | 27.96 | 2.27 | 23.0 | 26.3 | 27.6 | 29.4 | 33.0 | |||
| Men | 48 | 31.00 | 3.14 | 24.6 | 27.8 | 30.9 | 33.0 | 36.7 | |||
| Leng. 2 | Total | 154 | 28.65 | 2.68 | 23.6 | 26.9 | 28.4 | 30.3 | 36.3 | −6.774 | .0000 |
| Women | 106 | 27.79 | 2.06 | 23.6 | 26.2 | 27.7 | 29.2 | 32.6 | |||
| Men | 48 | 30.56 | 2.90 | 23.6 | 28.4 | 30.4 | 32.3 | 36.3 | |||
| M Leng. | Total | 154 | 28.78 | 2.74 | 23.5 | 26.8 | 28.3 | 30.6 | 36.5 | −6.972 | .0000 |
| Women | 106 | 27.87 | 2.10 | 23.5 | 26.5 | 27.7 | 29.3 | 32.8 | |||
| Men | 48 | 30.78 | 2.96 | 24.1 | 28.3 | 30.8 | 32.6 | 36.5 | |||
| Width 1 | Total | 154 | 20.37 | 2.54 | 14.9 | 18.5 | 20.0 | 22.0 | 28.2 | −8.232 | .0000 |
| Women | 106 | 19.42 | 1.97 | 14.9 | 18.3 | 19.3 | 20.6 | 25.2 | |||
| Men | 48 | 22.47 | 2.43 | 15.6 | 20.7 | 22.9 | 24.2 | 28.2 | |||
| Width 2 | Total | 154 | 20.17 | 2.45 | 15.0 | 18.4 | 20.0 | 22.0 | 27.0 | −8.040 | .0000 |
| Women | 106 | 19.26 | 1.95 | 15.0 | 18.0 | 19.2 | 20.3 | 24.2 | |||
| Men | 48 | 22.16 | 2.27 | 16.1 | 20.6 | 22.5 | 23.9 | 27.0 | |||
| M Width | Total | 154 | 20.27 | 2.46 | 15.1 | 18.7 | 20.0 | 21.8 | 27.6 | −8.347 | .0000 |
| Women | 106 | 19.34 | 1.91 | 15.1 | 18.3 | 19.1 | 20.4 | 24.7 | |||
| Men | 48 | 22.31 | 2.32 | 15.9 | 20.5 | 22.7 | 24.0 | 27.6 |
Comparison between women and men using Student's test.
Max: maximum value; Min: minimum value; N: sample; p25: percentile 25; p50: median; p75: percentile 75; SD: standard deviation.
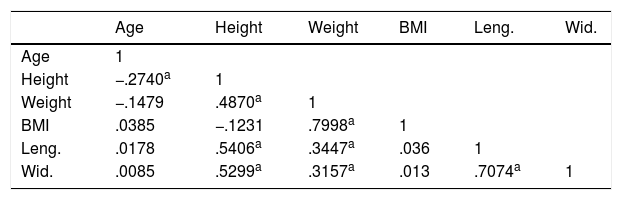
Table 4 shows the correlations that have been found to be significantly different from 0 between variables that were of interest. The significant correlations between the height and the glenoid length and width variables deserve attention, as do on the other hand the correlation between the glenoid length and width variables. Both correlations show a positive association between the height variable and the length and width variables. This correlation exists in the sample as a whole (Figs. 3 and 4).


Only 3.89%, 6 of the patients in the study had a glenoid width of 25mm or more.
The relationship between height and glenoid length exists in the sample as a whole, and it is significant in the sample of women as well as in the sample of men (Figs. 5 and 6). The graphs show the cloud of points that show the relationship between height and each one of the length and width variables.
Discussion

Although there are several morphometric studies of the glenohumeral joint in different populations, we have not found any such study of the population in the south of Spain. Our study analyses the anthropometrics of the transversal and longitudinal axes of the glenoid cavity by using 3D reconstruction of shoulder CT scans in 154 patients in the south of Spain. The average length of the longitudinal axis was found to be 28.28mm, and the average width was 20.27mm. Significant differences exist between men and women, as the glenoid is larger in men. The length and width of the glenoid in men stand at 30.78mm and 22.32mm, respectively, and at 27.87mm and 19.34mm in women. There is a positive association between the glenoid surface length and width variables, as well as between glenoid size and the height of an individual. This correlation is positive for the total sample, as well as for the samples of men and women.
Several studies have recorded the dimensions of the glenoid joint in the American population. Iannotti et al.6 analysed glenoid surface dimensions in 140 men, in 44 live subjects and 96 specimens. The measurements in cadavers were taken after removing all of the glenoid soft tissues; the study used MR imaging in the patients. The majority of the subjects in this study were Caucasian, with an average height in both groups of 181±8.9cm for the men and 165±9.1cm for the women, obtaining an average of 39±3.5mm in the superoinferior axis and 29±3.2mm in the lower half of the anteroposterior axis, and 23±2.7mm in the upper half. McPherson et al.15 used simple X-rays to measure the length and width of the glenoid in 93 anatomical subjects in South Carolina, obtaining 33.9mm±3.9mm and 28.6mm±3.8mm, respectively.
Cabezas et al.16 studied the morphological differences between 2 populations, one in North America and the other in Eastern Asia. They used 3D computed tomography scans and observed lower morphometric values in the Asian population in comparison with the North American cohort.
Previous publications have compared the morphological data of populations such as those of Thailand17 or China18 with the North American population, finding larger morphometric sizes in the North American population than was the case in the Asian populations.
Shimozono et al.13 studied glenoid dimensions in the Japanese population, with 56 shoulders in 55 patients an average age of 63.8 years old, using three dimensional reconstructions of computed tomography scans. The length and width obtained for the Japanese population were 35.8mm and 28.1mm in men, respectively, and 30.8mm and 23mm in women, finding a correlation between the height of an individual and glenoid dimensions. It is striking that the glenoid of the Japanese is larger than that of the Spanish. A possible explanation of this is height, although the average height of the patients included in the study is not specified. Another possible cause is that in our study the reference points for the measurements of glenoid length and width were defined in the internal area of the external edge that circumscribes the glenoid.
Romero et al.19 evaluated the morphometrics of 61 scapula glenoids of adult individuals in anatomical bone samples in the Anatomy Department of the Central University of Venezuela, obtaining a geometrical average for the cephalocaudal diameter of the glenoid cavity of 3.70cm, and an anteroposterior diameter of 2.71cm, although they did not connect this with either the height or the sex of the individual.
Merill8 studied the differences in the size and shape of the glenoids of men and women in 363 specimens in the Hamann-Todd osteological collection of Cleveland Natural History Museum. They found a significant difference between the specimens corresponding to men and women; as well as finding rounder glenoids in men and ones that were more oval in women, the average height of the glenoid in men was 37.01mm and 33.83mm in women, while the maximum width was 28.56mm in men and 23.67mm in women.
Matsumura et al.12 used CT scans to measure the thickness of the humeral head and its diameter as well as the longitudinal and transversal axes of the glenoid surfaces in 160 shoulders of 80 healthy volunteers, with an average age of 30.2±4.9 years old, in a Japanese population with an average height of 173±4.6cm in men and 156±5.3cm in women. The average height of the glenoid in men was 33.6±1.9cm and 29.4±1.7cm in the women; the width was 24.9cm in men and 21.3cm in women.
The results of our study differ from those published by Americans respecting glenoid size. However, we found that our results are similar to those of studies of the Japanese population, and both populations have smaller glenoid sizes than is the case in America. Contrary to what we expected, the measurements obtained in the Asian population are slightly larger than those in the population in the south of Spain. We found differences between men and women, as did the other authors, with larger dimensions in the men.
Iannotti et al.6 used magnetic resonance scanning to measure the glenoid surface. Although this techniques offers highly precise images for the study of soft tissues, only intensifies the bone cortex. We used CT scanning, as it offers the maximum definition for study of the bones. Bones are far denser than any other structure around them, except for the density of metal, and due to this the carriers of surgically implanted metal material were excluded. This ensures that there is no artefact whatsoever, and we believe this to be the best technique for studying the bone surface. Other authors such as McPherson et al.15 used simple X-rays, although these techniques are far less precise.
The variations in human height over the decades and between different regions in the world have been studied.20 We are aware of the convergence in height in Spain after the second half of the twentieth century, and in our country the average height of adults in 2003 was 165.5cm. The average height of men stands at 172cm and in women it is 160.1cm. The difference in height distributions between men and women is notable; while more than half (56.57%) of women are no taller than 160cm, 90% of men are taller; likewise, while more than half of men are taller than 170cm, the corresponding group of women amounts to only 6.5% of the female population.
The average height of the Andalusians (165.5cm) is practically the same as the Spanish average. It is 1cm taller than the shortest inhabitants, those who live in Castile-León (164.4cm) and 2cm shorter than the citizens of the Canary Islands (167.4cm), who are the tallest Spaniards. Height data according to sex reveal that the fact that the Andalusians are shorter than the national average is due to the women, who are, together with those in Extremadura and Castile-la Mancha, under the height of 160cm. This is not the case for Andalusian men, whose average height (172.2cm) is even above the national average (171.9cm).21
The circular metaglenoid inverted prostheses available now in the Spanish market are at least 24–25mm in diameter. For example, the circular Tornier metaglenoid prosthesis has a diameter of 25mm, while the one by Medcomtech is 24mm in diameter and the one by Depuy is 27mm in diameter. Cylindrical metaglenoid prostheses are also available, such as the one by MBA with a width of 22.8mm, although it is 27.3mm long. Ovoid metaglenoid prostheses can also be found, such as the one by Exactech with a width of 25mm, although it has a longer vertical axis of 33mm, which hinders the technique of implanting it in our patients. The lack of fit between glenoid measurements of the population in the south of Spain and the available implants is evident. This may have clinical implications in the loosening of the glenoid component following shoulder arthroplasty, which is one of the most common causes of revision.
We found relatively uniform values within both groups, of men and women. Only 6 of the 154 patients included in the study had a glenoid surface width of 25mm or more (3.89%). The remaining 96.11% would need a smaller prosthesis than the ones available now in the market, thereby preventing prosthesis instability as there is a broad margin without supporting bone in its transversal axis.
Our study suggests that prostheses designed in America are too large for the population in the south of Spain. We believe that our results will be useful to determine the size of prostheses and thereby improve their design, optimising the results of arthroplasty in clinical practice.
Our study has certain limitations. It is possible that there is a bias in selection. Our patients may not be representative of the Spanish population in general. The sample was selected in a population in the south of Spain, so that we are unable to rule out the existence of anthropometric differences in comparison with other populations in the country.
The sample size may be a limitation of the study. Our sample is composed of 154 patients.
Another possible limitation may be the technique used. CT scans were taken of the shoulder in 2mm thick slices with an interval of 0mm between slices, in bone and soft tissue algorithm, with 3D reconstruction. Thinner slices may show more exact results. In spite of this, we believe that our slices are high precision for the measurements used.
ConclusionThe population in the south of Spain has a smaller glenoid surface size than is the case in the American and similar populations, although it is less than the Asian cohort. The glenoid in our population has an average longitudinal axis of 28.78mm and a width of 20.27mm. Only 3.89% of the population in the south of Spain would be covered by the prostheses currently available in the market. We assume that the majority of patients in our region who are going to be subjected to inverted shoulder arthroplasty will be given an oversized metaglenoid. Although the clinical importance of this has yet to be proven, this should be reason enough to demand the manufacture of smaller prosthesis components.
Ethical aspectsNational and international guidelines for biomedical research in human beings were followed during this study (the ethical code and Helsinki declaration).
The legal regulations were followed regarding patient data confidentiality, the Spanish Organic Law on personal data protection (Organic Law 15/1999 of 13 December) according to the body controlling compliance with the regulations of the Spanish Data Protection Agency. Patients signed the informed consent document for the study that was carried out.
Level of evidenceLevel of evidence III.
Conflict of interestsThe authors have no conflict of interests to declare.
Please cite this article as: Rosales-Rosales L, Rosales-Varo AP, García-Espona MA, Roda-Murillo O, Montesinos I, Hernandez-Cortés P. Estudio antropométrico de la glena humana en una población española normal. Rev Esp Cir Ortop Traumatol. 2019;63:327–335.
