


Articular cartilage (AC) is always affected in any joint with osteoarthritis. Ultrasound can be a useful tool in monitoring changes in the AC. The purpose of the present study is to ultrasound measure the thickness of the AC in the distal femur in young students and determine its relationship with body mass index (BMI), muscle mass, body fat and sports practice.
Materials and methodsAn observational cross-sectional study was conducted with healthy volunteers, between 15 and 25 years old. Anthropometric data were collected and the thickness of the femoral cartilage of the knee was measured at 5 points. In addition, the percentage of muscle and body fat was measured in a subgroup.
Results100 subjects were included in the study. The average age was 20 years (± 2.5). The average BMI was 23kg/m2 (± 3.1). AC was thicker in men and sportsmen, versus women and sedentary people, with a statistically significant difference. When comparing BMI with AC thickness no significant relationship was found; however, only 2 participants had BMI > 30.
ConclusionsCartilage thickness has a direct relationship with the percentage of muscle, and inversely with the percentage of fat. BMI is not a good parameter when evaluating the dynamic behaviour of cartilage in non-obese youths.
El cartílago articular (CA) siempre está afectado en cualquier articulación con artrosis (A). La ecografía puede ser una herramienta útil en la monitorización de los cambios en el CA. El propósito del presente estudio es medir ecográficamente el grosor del CA en el fémur distal en jóvenes estudiantes y determinar su relación con el índice de masa corporal (IMC), masa muscular, grasa corporal y la práctica deportiva.
Materiales y métodosSe realizó un estudio transversal observacional con voluntarios sanos, entre 15 y 25 años. Se recogieron datos antropométricos y se midió el grosor del cartílago femoral de la rodilla en cinco puntos. Además, se midió en un subgrupo el porcentaje de músculo y de grasa corporal.
ResultadosEn el estudio se incluyeron 100 sujetos. La edad promedio fue de 20 años (± 2,5). El IMC promedio fue 23kg/m2 (± 3,1). El CA tuvo un mayor grosor en los hombres y en los deportistas vs. las mujeres y los sedentarios, con diferencia estadísticamente significativa. Al comparar el IMC con el grosor del CA no se encontró ninguna relación significativa; sin embargo, sólo dos participantes tenían IMC > 30.
ConclusionesEl grosor del cartílago tiene una relación directamente proporcional con el porcentaje de músculo, e inversamente proporcional con el porcentaje de grasa. El IMC no es un buen parámetro al evaluar el comportamiento dinámico del cartílago en jóvenes no obesos.
Articular cartilage (AC) has limited potential to heal and is always affected in any joint with osteoarthritis (A).1 There are different pathophysiological theories that seek to explain joint damage in A. The most widely accepted theory is that it is generated by the loss of balance between the anabolic and catabolic processes of the chondrocyte, causing disturbances between the synthesis and degradation of the extracellular matrix (ECM) and the end result is accelerated destruction of the ECM and loss of AC integrity.2 However, a recent hypothesis suggests that the origin of the disease is a consequence of a systemic disorder affecting stromal cell differentiation and lipid metabolism. This theory is based on different observations: The close relationship of A to obesity, the common origin of the cells that make up all the tissues that form the cavity and the possible factor of neuroendocrine mediators (e.g. leptin) in the regulation of bone mass.3
Obesity is a well-known risk factor for A.4 Body mass index (BMI) is associated with the risk of developing knee A, however the mechanism by which obesity increases the risk of the disease is unclear. It is not known whether it is weight itself or specific components of body composition such as mass muscle and fat distribution that increase this risk.4,5 Other risk factors are sex, age, genetic predisposition, occupational conditions, a history of trauma and high-impact sports.6–8
A is the result of damage to cartilage homeostasis associated with certain risk factors, but it is not clear whether there are adaptation mechanisms of cartilage to these factors, and if so, ultrasound could potentially be a useful tool in their monitoring. Therefore, the aim of this study is to determine whether BMI, sports practice, and specific body composition variables (muscle mass and body fat) are related to ultrasound-measured knee cartilage thickness in healthy university students at a single point in time.
Materials and methodsParticipantsThis is an observational cross-sectional study that was conducted in 2019. We recruited 100 volunteers (university students) of both sexes, between 15 and 25 years old, with no history of systemic or joint diseases affecting cartilage such as arthritis, A, joint infection, fractures or knee surgery. We excluded those with a previous history of joint injections or drainage of joint collections or effusions. In all the participants, height was measured with a measuring rod attached to the wall and with the subject standing with their back to the wall and barefoot. Weight was measured with a digital scale to two decimal places, with the subject barefoot. The BMI was also calculated, and a survey was carried out on the practice of sports. A DSM-BIA Multifrequency Inbody S10 body composition analyser was used to measure the percentage of muscle and body fat in 82 participants.
The ethics committee of our institution approved the study through letter number 263-2019 and all participants signed the informed consent form.
Ultrasound measurementThe ultrasound measurement was performed by the same researcher with experience in musculoskeletal ultrasound using Hitachi Aloka F37 equipment with a linear probe with a frequency range of 5–13.3 MHZ at five different points, similar to measurements made in other studies.9,10 The participant was seated with the dominant limb on a flat surface. The knee was explored in maximum hyperflexion, attempting to bring the heel close to the gluteal region (Fig. 1). The probe was placed transversely to the long axis of the knee and proximal to the kneecap in order to visualise the trochlear articular cartilage. With the intercondylar cortex in maximum sharpness, the cartilage in the anechoic space between the condyle and the plateau was measured in three different positions: in the centre of the intercondylar valley, in the deepest portion of the femoral trochlea where the medial and lateral condyle curves meet (measurement A, Fig. 1a), medial (measurement B) and lateral (measurement C) margins, each at a distance of 1.30cm from the former, attempting to take the measurement at the point where the highest tracing perpendicular to the cortical condyle was obtained (Fig. 2). Then, the examined participant in the same position, placing the probe longitudinally to the long axis of the knee over the condyle and with the maximum achievable cortical sharpness, the point with the highest cartilage height on the parapatellar ridge at the height of the upper-medial quadrant of the patella was measured (measurement D, Fig. 1b); and finally the highest point of cartilage in the parapatellar ridge at the height of the upper-outer quadrant of the patella was measured (measurement E, Fig. 1c).

Position of leg and transducer for ultrasound scan.a: Probe transversal to the long axis of the knee, measurement of points A, B and C. b: Probe longitudinal to the long axis of the knee on the medial condyle, point D. c: Probe longitudinal to the long axis of the knee on the lateral condyle, point E.
. b: Measurement of femoral cartilage at point D. c: Measurement of femoral cartilage at point E.")
A descriptive analysis was carried out initially. Mean and standard deviation were used for the characterisation variables. Cartilage thickness variables were analysed with medians and interquartile ranges due to their asymmetric distribution. The non-parametric Kruskal–Wallis test was used to compare the medians of cartilage thickness according to BMI, physical activity and sex. And finally, the Spearman correlation index was calculated to determine the correlation between the variables of interest of the cartilage and fat and muscle percentage. A p value <0.05 was considered statistically significant.
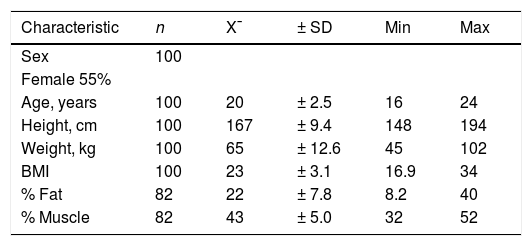
ResultsOf the 100 participants included in the study, 55% were women. The average age was 20 years, (SD: ± 2.5). The average BMI was 23 (SD: ± 3.2). Average fat (n = 82) and muscle (n = 82) percentages were 22% and 43%, respectively (Table 1).
The percentage of young people who played sports was 58% (58/100), with a mean frequency of six hours per week (SD = 3.8). The most frequent sports were gymnastics with 42%, followed by football with 17%. Among the 58 young people with a sport habit, 29% practiced high-impact sports.
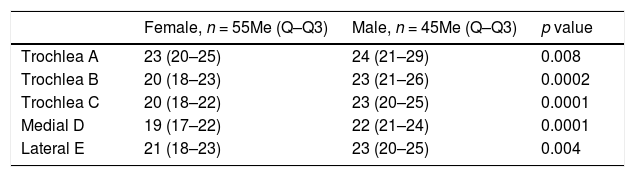
When evaluating cartilage thickness taking sex into account, it was found that at all the measurement points the thickness was greater in males; with a statistically significant difference (Table 2).
Comparison between cartilage measurement and sex.
| Female, n = 55Me (Q–Q3) | Male, n = 45Me (Q–Q3) | p value | |
|---|---|---|---|
| Trochlea A | 23 (20–25) | 24 (21–29) | 0.008 |
| Trochlea B | 20 (18–23) | 23 (21–26) | 0.0002 |
| Trochlea C | 20 (18–22) | 23 (20–25) | 0.0001 |
| Medial D | 19 (17–22) | 22 (21–24) | 0.0001 |
| Lateral E | 21 (18–23) | 23 (20–25) | 0.004 |
The measurement values are expressed in tenths of millimetres.
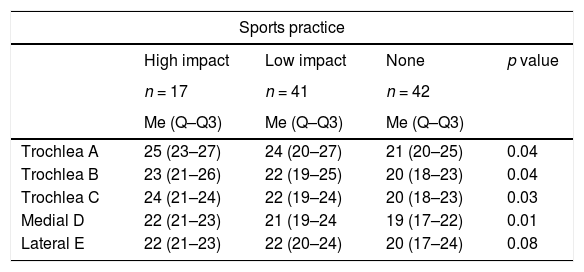
Similarly, when comparing cartilage thickness with the presence or absence of sports practice, it was found that the thickness was greater in those who played sports, and the greatest difference was observed at point A, where the cartilage thickness in the sedentary people was 0.3mm less than in the low-impact athletes and 0.4mm less than in the high-impact athletes, with a p value <0.05 (Table 3).
Comparison between cartilage measurement and sports practice.
| Sports practice | ||||
|---|---|---|---|---|
| High impact | Low impact | None | p value | |
| n = 17 | n = 41 | n = 42 | ||
| Me (Q–Q3) | Me (Q–Q3) | Me (Q–Q3) | ||
| Trochlea A | 25 (23–27) | 24 (20–27) | 21 (20–25) | 0.04 |
| Trochlea B | 23 (21–26) | 22 (19–25) | 20 (18–23) | 0.04 |
| Trochlea C | 24 (21–24) | 22 (19–24) | 20 (18–23) | 0.03 |
| Medial D | 22 (21–23) | 21 (19–24 | 19 (17–22) | 0.01 |
| Lateral E | 22 (21–23) | 22 (20–24) | 20 (17–24) | 0.08 |
The measurement values are expressed in tenths of millimetres.
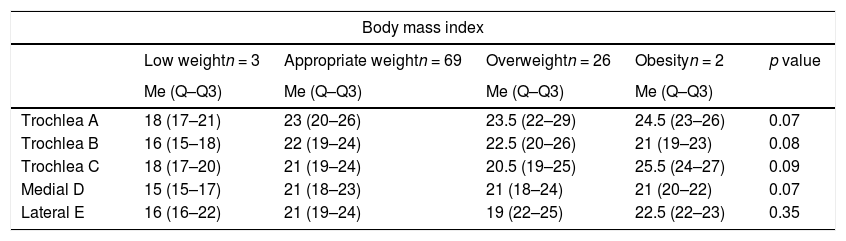
When comparing the measurements with the BMI classification, we found only three patients with low weight and two with obesity, which means the sample does not allow conclusions to be drawn, and when comparing the group with normal weight and overweight, we found no variation in cartilage thickness (Table 4).
Comparison between cartilage measurement and BMI.
| Body mass index | |||||
|---|---|---|---|---|---|
| Low weightn = 3 | Appropriate weightn = 69 | Overweightn = 26 | Obesityn = 2 | p value | |
| Me (Q–Q3) | Me (Q–Q3) | Me (Q–Q3) | Me (Q–Q3) | ||
| Trochlea A | 18 (17–21) | 23 (20–26) | 23.5 (22–29) | 24.5 (23–26) | 0.07 |
| Trochlea B | 16 (15–18) | 22 (19–24) | 22.5 (20–26) | 21 (19–23) | 0.08 |
| Trochlea C | 18 (17–20) | 21 (19–24) | 20.5 (19–25) | 25.5 (24–27) | 0.09 |
| Medial D | 15 (15–17) | 21 (18–23) | 21 (18–24) | 21 (20–22) | 0.07 |
| Lateral E | 16 (16–22) | 21 (19–24) | 19 (22–25) | 22.5 (22–23) | 0.35 |
The measurement values are expressed in tenths of millimetres.
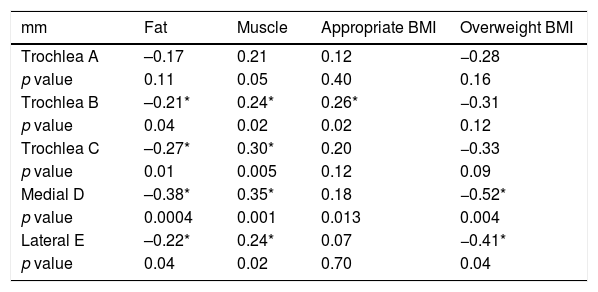
When we evaluated the relationship between body fat percentage and cartilage thickness, we found it to be inversely proportional with statistically significant values in all points except point A. This shows that as fat increases, cartilage thickness decreases. In contrast, the relationship between muscle percentage and cartilage thickness was directly proportional, showing that as muscle increases, so does cartilage thickness, with statistically significant differences in all measurements except at point A (Table 5).
Relationship between percentage of muscle, fat and appropriate and overweight BMI and cartilage thickness.
| mm | Fat | Muscle | Appropriate BMI | Overweight BMI |
|---|---|---|---|---|
| Trochlea A | –0.17 | 0.21 | 0.12 | −0.28 |
| p value | 0.11 | 0.05 | 0.40 | 0.16 |
| Trochlea B | –0.21* | 0.24* | 0.26* | −0.31 |
| p value | 0.04 | 0.02 | 0.02 | 0.12 |
| Trochlea C | –0.27* | 0.30* | 0.20 | −0.33 |
| p value | 0.01 | 0.005 | 0.12 | 0.09 |
| Medial D | –0.38* | 0.35* | 0.18 | −0.52* |
| p value | 0.0004 | 0.001 | 0.013 | 0.004 |
| Lateral E | –0.22* | 0.24* | 0.07 | −0.41* |
| p value | 0.04 | 0.02 | 0.70 | 0.04 |
The values shown with an asterisk are equivalent to a p value < 0.05.
The measurement values are expressed in tenths of millimetres.
This study confirms the directly proportional relationship between femoral cartilage thickness and body muscle percentage. In fact, at the points obtained for ultrasound assessment, with the exception of point A, it was observed that as muscle percentage increases in individuals, cartilage thickness also increases with statistically significant validity. These findings are consistent with data obtained by Cicuttini that suggest that increases in muscle mass will be a protective factor for joint wear.5
Equally importantly, we found an inverse relationship between body fat percentage and thickness of femoral AC in the measurements obtained. Although there is much controversy on this issue, as some studies have determined that there is no relationship between body fat distribution and decreased AC,11–13 other studies relate the percentage of fat with volume in articular cartilage, with a statistically significant value.4 We found that higher body fat percentages are related to lower values of AC thickness, at the different points except for measurement A which represents the deepest portion of the femoral trochlea at the junction site between the medial and lateral condyle curves.
On the other hand, an apparent progressive increase in cartilage thickness was found as BMI increased. Thus, if we take the result obtained in measurement A, the thickness increases from 18 to 23, 23.5 and 24.5 (p = .07). This appears confusing at first glance, since the literature indicates that cartilage damage in relation to obesity is associated with high BMI values.14 However, it should be noted that when evaluating the two extreme BMI groups, both have very small sample sizes, there are three low weight participants and only two obese participants, and therefore the sample size would explain why our results are the opposite to what is found in the literature. In order to establish a relationship between BMI and AC thickness, a study with greater heterogeneity and sample size is required. Similarly, it is important to note that body composition in individuals is difficult to predict with BMI alone15 because it is imprecise, non-linear and age-biased, especially in women.16–18 This leads to the belief that it is a mistake to use BMI to estimate body fat19 and it should be used with caution as an indicator of obesity, impedance measurement being better.17,20,21
In terms of sex, men were found to have greater AC thickness than women at all points assessed. One possible explanation is that men have a higher percentage of muscle mass than women, as reported by Cicuttini et al.5 Likewise, this study showed a direct proportional relationship between muscle percentage and AC thickness, therefore these findings explain that men on average have thicker AC than women, as in our study.
Similarly, young people who played sports had greater AC thickness at all points measured when compared to the sedentary population; and furthermore, the thickness was observed to be greater in participants who played high-impact sports than in those who played low-impact sports. It should be noted that all participants played sports recreationally and not professionally/competitively. This finding is consistent with a meta-analysis that reported that participants who engaged in recreational athletics had a lower prevalence of A than sedentary participants.22 Although our study does not evaluate the presence of knee A, it is clear that patients with lower AC thickness will develop A more frequently than patients with greater AC thickness.
Among the limitations of the study, we highlight the limited heterogeneity of the sample, for example, that the number of obese participants according to the classification using BMI was very low (n = 2), which is why we could not find a relationship between this variable and cartilage thickness. This limitation is conditioned by the inclusion criteria of the study, since its being young university students aged between 15 and 25 made it less likely to find obese participants. Furthermore, the sampling carried out was not probabilistic, which increased selection bias, and this in turn decreased the validity of the study. Finally, it is important to emphasise that the cross-sectional design of the study allows us to refer to thickness measured only once, without being able to reach conclusions about risk factors or protective factors of AC.
ConclusionsThe thickness of the femoral AC of the knee has a direct relationship with the percentage of muscle, and inversely proportional to the percentage of body fat. In addition, femoral AC is thicker in men than in women, and in young people who practice sports compared to those who are sedentary. Cartilage thickness in non-obese youths shows no variation in relation to BMI, but other studies in obese populations are required to better evaluate this relationship.
Level of evidenceLevel of evidence IV.
FundingThis research study received no specific support from public sector agencies, the commercial sector or non-profit organisations.
Conflict of interestsThe authors have no conflict of interests to declare.
Please cite this article as: Herrera H GA, Llinás PJ, Flórez L, Blanco Montes C, Vernaza Obando D, Díaz Solorzano A, et al. Medición ecográfica del grosor del cartílago femoral en rodilla de jóvenes universitarios sanos. Rev Esp Cir Ortop Traumatol. 2020;64:244–250.
