


The loss of bone mass, as a consequence of bone remodelling, in the proximal third of the femur, is a factor that contributes to the failure of hip prostheses in the medium to long term. This periprosthetic remodelling occurs mainly during the first 12 months after the operation.
The aim is to evaluate the behaviour at one year of a new anatomical stem, the ANATO® stem (2015-Stryker®), which is a redesign of its predecessor (ABG-II®—Stryker stem) by means of bone densitometry.
MethodProspective, controlled study in which the changes in bone mineral density (BMD) observed around the 7 areas of Gruen in a group of 61 patients affected by primary coxarthrosis, in whom an ANATO® stem was implanted, are analysed densitometrically. The healthy hip was taken as the control group. The existence of differences in the remodelling pattern according to sex, age and body mass index (BMI) was compared. The follow-up was during the first year after the intervention.
ResultsAfter one year of follow-up, decreases of bone mineral density in zone 7 of −5.9% were observed, being this decrease statistically significant. No differences were found in the remodeling pattern according to age, sex and body mass index.
ConclusionThe ANATO® stem allows an efficient transmission of loads from the stem to the proximal femur. Only in zone 7 significant bone atrophy is observed. Differences in age, BMI and sex do not seem to influence the bone remodelling around this new stem.
La pérdida de masa ósea, como consecuencia del remodelado óseo, en el tercio proximal del fémur, es un factor que contribuye al fracaso de las prótesis de cadera a medio-largo plazo. Este remodelado periprotésico se desarrolla sobre todo durante los 12 primeros meses tras la intervención.
Se pretende evaluar el comportamiento a un año de un nuevo vástago anatómico, el vástago ANATO® (2015-Stryker®), el cuál es un rediseño de su predecesor (vástagos ABG-II®−-Stryker) mediante densitometría ósea.
Material y métodoEstudio prospectivo, controlado, en el que se analizan densitometricamente, los cambios en la densidad mineral ósea (DMO), observados en torno a las 7 áreas de Gruen, en un grupo de 61 pacientes, afectos de coxartrosis primaria, en quienes se implantó un vástago ANATO®. La cadera sana fue tomada como grupo control. Se comparó la existencia de diferencias en el patrón de remodelado según sexo, edad e índice de masa corporal (IMC). El seguimiento fue durante el primer año tras la intervención.
ResultadosAl año de seguimiento se aprecian descensos de la densidad mineral ósea en la zona 7, de −5,9%, siendo este descenso estadísticamente significativo. No se encontraron diferencias en el patrón de remodelado según edad, sexo e índice de masa corporal.
ConclusiónEl vástago ANATO®, permite una transmisión eficiente de cargas desde el vástago al fémur próximal. Únicamente en la zona 7 se aprecia atrofia ósea significativa. Las diferencias de edad, IMC y sexo parecen no influir en la remodelación ósea entorno a este nuevo vástago.
The loss of bone mass in the proximal third of the femur is a factor that contributes to the failure of hip prostheses over the medium to long term. It is associated with the loosening, sinking or breakage of the prosthesis or femoral fracture.1
The initial bone mass of the patient is considered to be the most important factor, and it can be used to predict remodelling changes.2 Additionally, other factors that depend on the patient, such as age, weight, activity or sex may influence remodelling changes.
Bone resorption occurs in cemented prostheses as well as those that are not cemented. This fact is attributed to stress-shielding, the existence of micromovement and osteolytic lesions due to biological reaction caused by polyethylene wear particles.3,4
It is now accepted that periprosthetic bone remodelling is a multifactorial process5 that depends on its design, size, the material of which it is made, its morphology and the extension of the porous coating of the stem.6 This periprosthetic remodelling takes place above all during the first 12 months after the intervention.2
Different methods have been used to determine bone mineral density. Dual energy X-ray absorptiometry is superior to other absorptiometry methods in terms of cost, scanning time, radiation dosage and precision.7 It has also been concluded that the precision of this technique is not influenced by the design and type of implant.5 This method is therefore well accepted for monitoring adaptive periprosthetic bone remodelling.8
Several studies have been published during the past 15 years which evaluate the behaviour of uncemented anatomical stems over the short, medium and long term, showing good clinical and radiological results at one and ten years after implantation.9–12
A prospective study was therefore designed to evaluate the behaviour of a new anatomical stem after one year. The stem in question is the ANATO® (2015-Stryker®, U.S.A) (Fig. 1), which is a redesigned version of its predecessor (the ABG-II® stem). Bone densitometry was used to determine periprosthetic bone mineral density at different moments of the follow-up during the first year after surgery, as a result of the biomechanical changes in the hip which arise after the implantation of this anatomical stem.
Material and methods and its predecessor, the ABG-II stem (right). The difference in the porous hydroxyapatite coating at proximal level is visible.")
A prospective study was designed for this work, using the healthy contralateral hip as the control, and patients were included in it from June 2017 to January 2018. The aim is to detect and quantify periprosthetic bone remodelling in patients who have received an ANATO® total uncemented hip prosthesis one year after the surgical operation.
This study was approved by the hospital Ethics Committee, and each patient was notified and accepted taking part prior to inclusion using an informed consent document.
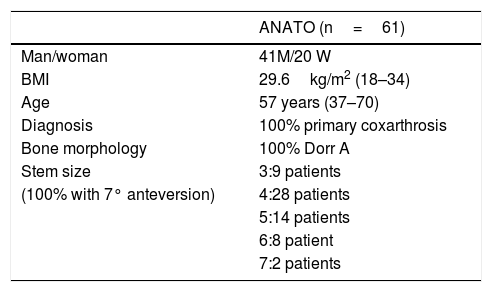
Study populationThe sample included 61 patients (41 men and 20 women) with primary unilateral coxarthrosis, without radiological signs of osteoporosis and with Dorr. type A femoral morphology. Their average body mass index was 29.6kg/m2 (18–34kg/m2). The median age was 57 years (37–70 years). All of the patients completed follow-up to one year (Table 1).
Demographic characteristics of the patients included in the study.
| ANATO (n=61) | |
|---|---|
| Man/woman | 41M/20 W |
| BMI | 29.6kg/m2 (18–34) |
| Age | 57 years (37–70) |
| Diagnosis | 100% primary coxarthrosis |
| Bone morphology | 100% Dorr A |
| Stem size | 3:9 patients |
| (100% with 7° anteversion) | 4:28 patients |
| 5:14 patients | |
| 6:8 patient | |
| 7:2 patients |
This implant is an uncemented anatomical stem with a pressure-fitted metaphyseal anchorage made of Ti-6Al-4V alloy, with a circumferential hydroxyapatite coating (Plasma-Spray, 200 microns) on the proximal third of the stem (Fig. 1).
Its predecessor, the ABG-II® stem, is a pressure-fitted uncemented anatomical stem made of titanium-molybdenum-zirconium-iron (TMZF) alloy. Its hydroxyapatite coating (Plasma-Spray, 70 microns) is restricted to the metaphyseal part (Fig. 1). This implant was not studied.
All of the patients were implanted with an uncemented cup (TRIDENT®-Stryker®, U.S.A.) and a ceramic-polyethylene ball and line, which were not studied.
Surgical techniqueAll of the patients were operated using the same approach route (Kocher Langenbeck posterolateral) by the same group of surgeons.
Preparation of the femur, which commenced with the osteotomy, continued with shaping the proximal metaphysis with a hollow chisel. The diaphysis was then gradually drilled to attain a hole 1mm wider than the diameter of the planned implant tail. Preparation of the metaphysis was completed with gradual drilling up to the size calculated in preoperative planning, and this was confirmed when an optimum metaphyseal fit was observed, with suitable rotatory stability.
During the immediate postoperative period, the patients maintained partial support using two walking sticks for six weeks, after which the homolateral stick was withdrawn and complete loading was permitted. After two or three months the contralateral walking stick was withdrawn and free movement was permitted.
Densitometry studyThe bone mineral density of the patients was determined before surgery, immediately after surgery and at three, six and 12 months after the intervention, using the DEXA method (LUNAR DPX enCORE, General Electric Healthcare®, Madison). The several regions of interest into which Gruen and Johnston13 (each consisting of 30 by 30 pixel squares) divide the proximal femur were analysed separately (Fig. 2). Metal-excluding software was used, including in the densitometer for analysis by the manufacturer. The influence of other variables on bone remodelling in the immediate postoperative period was also analysed, as well as at six months and one year, including age, sex and body mass index (BMI). For this the cut-off point was set at the median age and the average BMI of the sample, to divide it into two groups. The bone density data obtained were expressed as mg calcium/cm2, with data on the bone mineral density of each zone around the implant.
Statistical analysis
Version 20.0. of the SPSS® program was used for statistical analysis. The χ2 test was used to compare percentages, and the Student t-test was used for average with homogeneous parameters, while the Kruskall-Wallis test was used for averages with non-homogeneous parameters. The level of statistical significance was set at P equal to or less than 0.05.
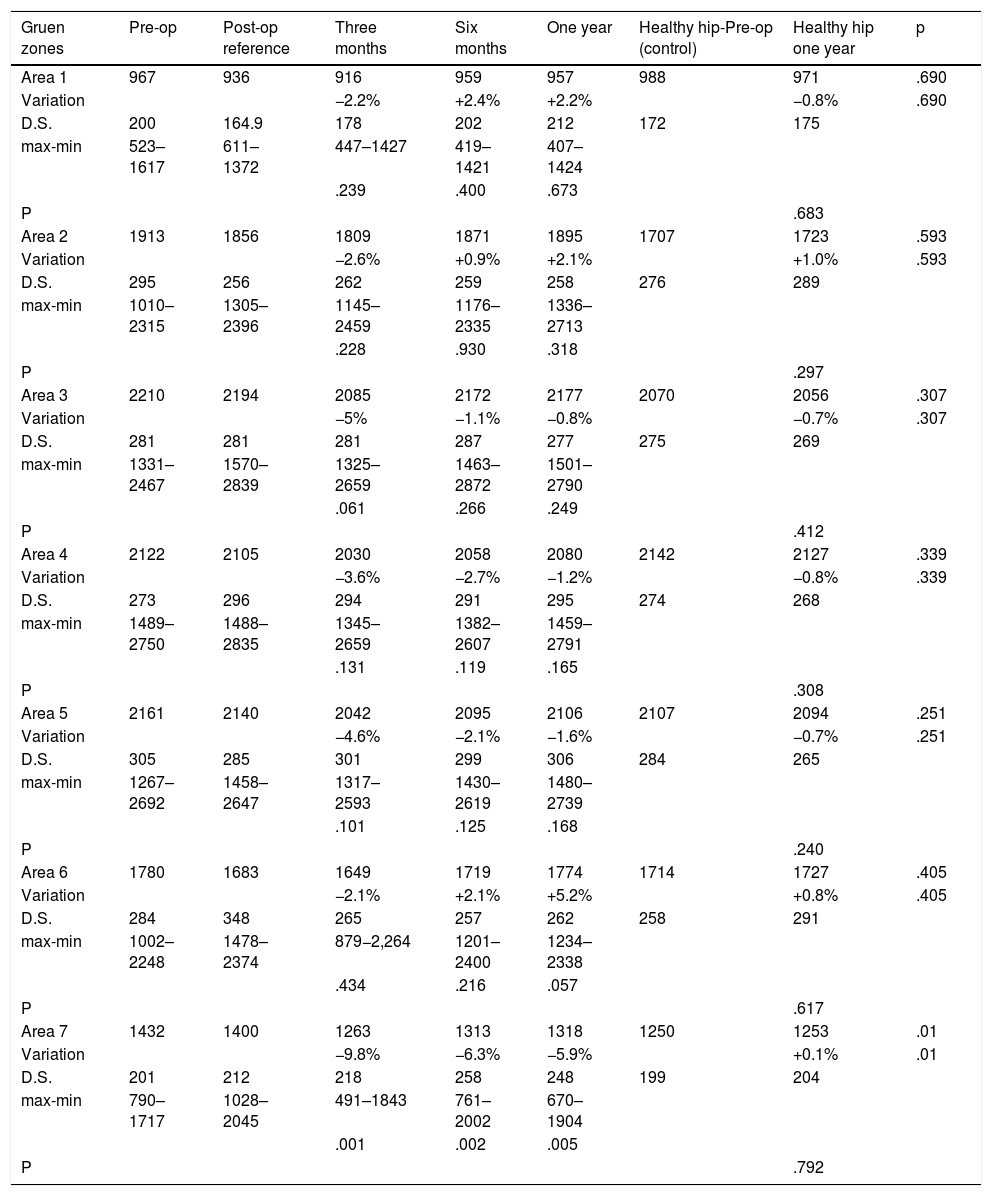
ResultsBone mass evolution in our sample over the first three, six and 12 months after the intervention is shown in Table 2. The postoperative values are taken as the reference to follow-up bone mineral density in the operated hip.
Changes in bone density in the operated and healthy hip for the ANATO stem during the first year of follow-up. Bone mineral density is expressed in mg calcium/cm2. The percentage of variation is calculated respecting the postoperative examination, which is considered to be the reference value.
| Gruen zones | Pre-op | Post-op reference | Three months | Six months | One year | Healthy hip-Pre-op (control) | Healthy hip one year | p |
|---|---|---|---|---|---|---|---|---|
| Area 1 | 967 | 936 | 916 | 959 | 957 | 988 | 971 | .690 |
| Variation | −2.2% | +2.4% | +2.2% | −0.8% | .690 | |||
| D.S. | 200 | 164.9 | 178 | 202 | 212 | 172 | 175 | |
| max-min | 523–1617 | 611–1372 | 447–1427 | 419–1421 | 407–1424 | |||
| .239 | .400 | .673 | ||||||
| P | .683 | |||||||
| Area 2 | 1913 | 1856 | 1809 | 1871 | 1895 | 1707 | 1723 | .593 |
| Variation | −2.6% | +0.9% | +2.1% | +1.0% | .593 | |||
| D.S. | 295 | 256 | 262 | 259 | 258 | 276 | 289 | |
| max-min | 1010–2315 | 1305–2396 | 1145–2459 | 1176–2335 | 1336–2713 | |||
| .228 | .930 | .318 | ||||||
| P | .297 | |||||||
| Area 3 | 2210 | 2194 | 2085 | 2172 | 2177 | 2070 | 2056 | .307 |
| Variation | −5% | −1.1% | −0.8% | −0.7% | .307 | |||
| D.S. | 281 | 281 | 281 | 287 | 277 | 275 | 269 | |
| max-min | 1331–2467 | 1570–2839 | 1325–2659 | 1463–2872 | 1501–2790 | |||
| .061 | .266 | .249 | ||||||
| P | .412 | |||||||
| Area 4 | 2122 | 2105 | 2030 | 2058 | 2080 | 2142 | 2127 | .339 |
| Variation | −3.6% | −2.7% | −1.2% | −0.8% | .339 | |||
| D.S. | 273 | 296 | 294 | 291 | 295 | 274 | 268 | |
| max-min | 1489–2750 | 1488–2835 | 1345–2659 | 1382–2607 | 1459–2791 | |||
| .131 | .119 | .165 | ||||||
| P | .308 | |||||||
| Area 5 | 2161 | 2140 | 2042 | 2095 | 2106 | 2107 | 2094 | .251 |
| Variation | −4.6% | −2.1% | −1.6% | −0.7% | .251 | |||
| D.S. | 305 | 285 | 301 | 299 | 306 | 284 | 265 | |
| max-min | 1267–2692 | 1458–2647 | 1317–2593 | 1430–2619 | 1480–2739 | |||
| .101 | .125 | .168 | ||||||
| P | .240 | |||||||
| Area 6 | 1780 | 1683 | 1649 | 1719 | 1774 | 1714 | 1727 | .405 |
| Variation | −2.1% | +2.1% | +5.2% | +0.8% | .405 | |||
| D.S. | 284 | 348 | 265 | 257 | 262 | 258 | 291 | |
| max-min | 1002–2248 | 1478–2374 | 879−2,264 | 1201–2400 | 1234–2338 | |||
| .434 | .216 | .057 | ||||||
| P | .617 | |||||||
| Area 7 | 1432 | 1400 | 1263 | 1313 | 1318 | 1250 | 1253 | .01 |
| Variation | −9.8% | −6.3% | −5.9% | +0.1% | .01 | |||
| D.S. | 201 | 212 | 218 | 258 | 248 | 199 | 204 | |
| max-min | 790–1717 | 1028–2045 | 491–1843 | 761–2002 | 670–1904 | |||
| .001 | .002 | .005 | ||||||
| P | .792 |
Three months after the intervention a generalised loss of bone was detected in all of the zones studied, amount to from −9.8% to −2.1%, and this was statistically significant in area seven.
Six months after the intervention a recovery in bone mineral density was detected in all of the zones studied.
One year after the intervention statistically significant losses of −5.9% persisted in zone seven, although to a lesser degree than had been the case in the measurements taken at three and six months.
In zones one, two and six bone mass was found to have recovered to an extent that varied from +2.1% to +5.2%. Small losses of from −1.2% to −0. 3% were detected in zones three, four and five. No statistically significant differences were found in any of these zones under study.
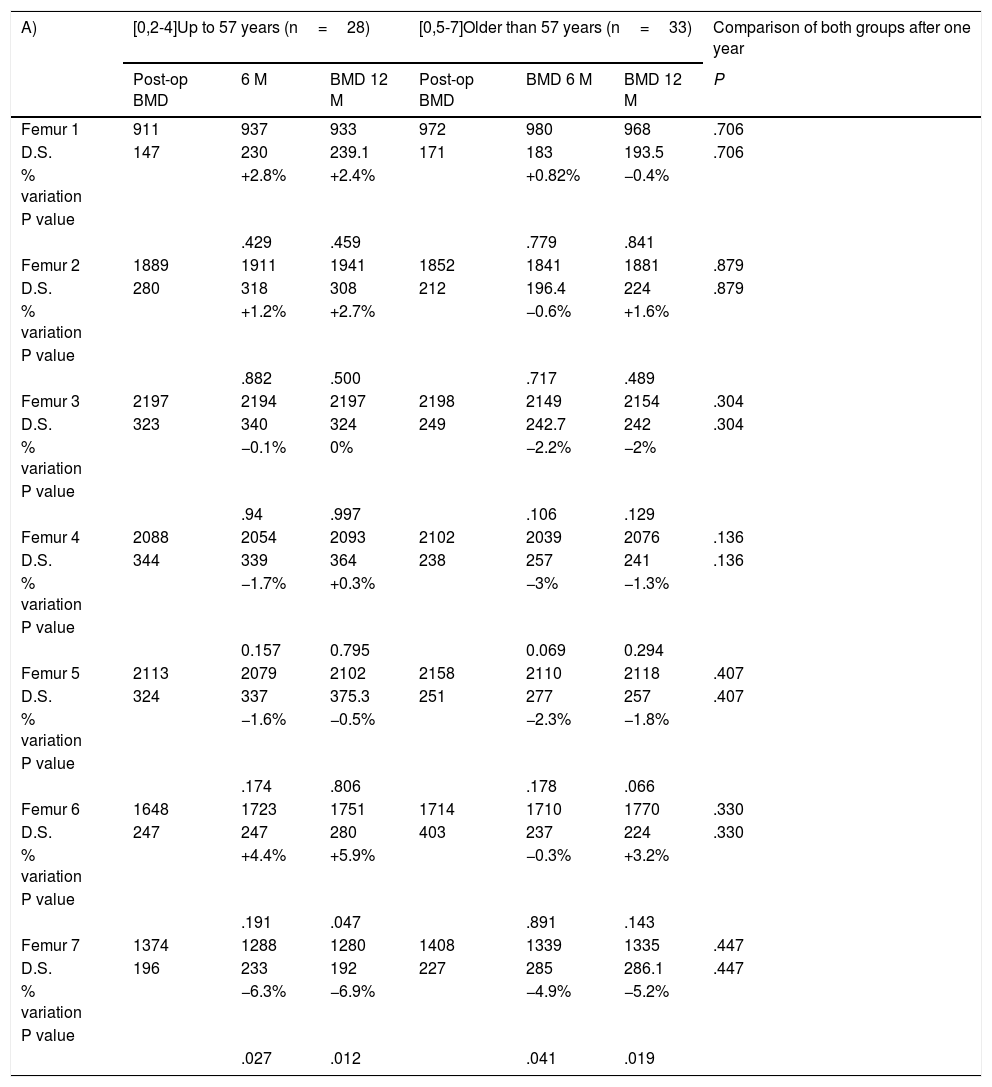
When differences between age groups in bone mineral density (BMD) were compared (Table 3A) at the end of the follow-up, the cut-off point was set as the median age of the sample (57 years). A variation of from −6.9% to +5.9% BMD in the group aged 57 years or less, and from −5.2% to +3.2% in the group older than 57 years, without detected any statistically significant differences between both groups in any of the zones studied.
(A) Comparison between the bone remodelling induced by each stem according to patient age. (B) The same comparison according to BMI. (C) Comparison according to sex. Bone mineral density is expressed in mg calcium/cm2. The percentage of variation is calculated respecting the postoperative examination, which is considered the reference value.
| A) | [0,2-4]Up to 57 years (n=28) | [0,5-7]Older than 57 years (n=33) | Comparison of both groups after one year | ||||
|---|---|---|---|---|---|---|---|
| Post-op BMD | 6 M | BMD 12 M | Post-op BMD | BMD 6 M | BMD 12 M | P | |
| Femur 1 | 911 | 937 | 933 | 972 | 980 | 968 | .706 |
| D.S. | 147 | 230 | 239.1 | 171 | 183 | 193.5 | .706 |
| % variation | +2.8% | +2.4% | +0.82% | −0.4% | |||
| P value | |||||||
| .429 | .459 | .779 | .841 | ||||
| Femur 2 | 1889 | 1911 | 1941 | 1852 | 1841 | 1881 | .879 |
| D.S. | 280 | 318 | 308 | 212 | 196.4 | 224 | .879 |
| % variation | +1.2% | +2.7% | −0.6% | +1.6% | |||
| P value | |||||||
| .882 | .500 | .717 | .489 | ||||
| Femur 3 | 2197 | 2194 | 2197 | 2198 | 2149 | 2154 | .304 |
| D.S. | 323 | 340 | 324 | 249 | 242.7 | 242 | .304 |
| % variation | −0.1% | 0% | −2.2% | −2% | |||
| P value | |||||||
| .94 | .997 | .106 | .129 | ||||
| Femur 4 | 2088 | 2054 | 2093 | 2102 | 2039 | 2076 | .136 |
| D.S. | 344 | 339 | 364 | 238 | 257 | 241 | .136 |
| % variation | −1.7% | +0.3% | −3% | −1.3% | |||
| P value | |||||||
| 0.157 | 0.795 | 0.069 | 0.294 | ||||
| Femur 5 | 2113 | 2079 | 2102 | 2158 | 2110 | 2118 | .407 |
| D.S. | 324 | 337 | 375.3 | 251 | 277 | 257 | .407 |
| % variation | −1.6% | −0.5% | −2.3% | −1.8% | |||
| P value | |||||||
| .174 | .806 | .178 | .066 | ||||
| Femur 6 | 1648 | 1723 | 1751 | 1714 | 1710 | 1770 | .330 |
| D.S. | 247 | 247 | 280 | 403 | 237 | 224 | .330 |
| % variation | +4.4% | +5.9% | −0.3% | +3.2% | |||
| P value | |||||||
| .191 | .047 | .891 | .143 | ||||
| Femur 7 | 1374 | 1288 | 1280 | 1408 | 1339 | 1335 | .447 |
| D.S. | 196 | 233 | 192 | 227 | 285 | 286.1 | .447 |
| % variation | −6.3% | −6.9% | −4.9% | −5.2% | |||
| P value | |||||||
| .027 | .012 | .041 | .019 | ||||
| B) | [0,2-4]BMI<30 (n=37) | [0,5-8]BMI>30 (n=24) | |||||
|---|---|---|---|---|---|---|---|
| Post-op BMD | BMD 6 M | BMD 12 M | Post-op BMD | BMD 6 M | BMD 12 M | P | |
| Femur 1 | 951 | 953 | 945 | 906 | 930 | 937 | .252 |
| D.S. | 157 | 221 | 235 | 155 | 190 | 176 | .252 |
| % variation | −0.2% | −0.7% | +2.6% | +3.4% | |||
| P value | |||||||
| .959 | .847 | .279 | .105 | ||||
| Femur 2 | 1874 | 1843 | 1868 | 1810 | 1833 | 1852 | .314 |
| D.S. | 216 | 250 | 226 | 261 | 269 | 270 | .314 |
| % variation | −1.7% | −0.4% | +1.3% | +2.3% | |||
| P value | |||||||
| .462 | .788 | .344 | .252 | ||||
| Femur 3 | 2189 | 2108 | 2160 | 2127 | 2205 | 2226 | .061 |
| D.S. | 264 | 282 | 252 | 282 | 292 | 282 | .061 |
| % variation | −3.8% | −1.4% | +3.6% | +4.5% | |||
| P value | |||||||
| 0.133 | 0.213 | 0.112 | 0.06 | ||||
| Femur 4 | 2087 | 2026 | 2058 | 2057 | 2055 | 2086 | .631 |
| D.S. | 266 | 286 | 282 | 311 | 314 | 320 | .631 |
| % variation | −3% | −1.4% | −0.1% | +1.4% | |||
| P value | |||||||
| 0.107 | 0.162 | 0.949 | 0.789 | ||||
| Femur 5 | 2128 | 2082 | 2090 | 2126 | 2095 | 2150 | .215 |
| D.S. | 284 | 329 | 318 | 315 | 296 | 329 | .215 |
| % variation | −2.2% | −1.8% | −1.5% | +1.2% | |||
| P value | |||||||
| .022 | .295 | .387 | .253 | ||||
| Femur 6 | 1651 | 1692 | 1731 | 1667 | 1715 | 1768 | .991 |
| D.S. | 391 | 274 | 255 | 222 | 195 | 267 | .991 |
| % variation | +1.9% | +4.7% | +2.8% | +5.8% | |||
| P value | |||||||
| .466 | .085 | .174 | .030 | ||||
| Femur 7 | 1384 | 1266 | 1279 | 1383 | 1382 | 1359 | .064 |
| D.S. | 215 | 262 | 236 | 182 | 241 | 265 | .064 |
| % variation | −8.6% | −7.6% | −0.1% | −1.8% | |||
| P value | |||||||
| .01 | .01 | .989 | .582 | ||||
| C) | [0,2-4]Men (n=41) | [0,5-8]Women (n=20) | |||||
|---|---|---|---|---|---|---|---|
| Post-op BMD | BMD 6 M | BMD 12 M | Post-op BMD | BMD 6 M | BMD 12 M | P | |
| Femur 1 | 964 | 989 | 993 | 831 | 838 | 845 | .875 |
| D.S. | 160.4 | 198 | 210 | 122 | 220 | 206 | .875 |
| % variation | +2.6% | +3% | +0.8% | +1.7% | |||
| P value | |||||||
| .281 | .249 | .428 | .762 | ||||
| Femur 2 | 1898 | 1916 | 1947 | 1722 | 1758 | 1770 | .641 |
| D.S. | 244 | 261 | 267 | 171 | 206 | 197 | .641 |
| % variation | +1% | +2.6% | +2.1% | +2.7% | |||
| P value | |||||||
| .710 | .466 | .576 | .457 | ||||
| Femur 3 | 2234 | 2220 | 2228 | 2016 | 1957 | 1941, | .353 |
| D.S. | 281 | 273 | 262 | 193 | 278 | 256 | .353 |
| % variation | −0.7% | −0.3% | −2.9% | −3.8% | |||
| P value | |||||||
| .446 | .510 | .304 | .141 | ||||
| Femur 4 | 2142 | 2098 | 2116 | 1912 | 1859 | 1878 | 0.789 |
| D.S. | 294 | 283 | 295 | 270 | 277 | 262.4 | 0.789 |
| % variation | −2.1% | −0.8% | −2.8% | −1.8% | |||
| P value | |||||||
| .146 | .191 | .247 | .662 | ||||
| Femur 5 | 2175 | 2136 | 2150 | 1966 | 1903 | 1927 | .275 |
| D.S. | 280 | 292 | 307 | 266 | 284 | 324.85 | .275 |
| % variation | −1.8% | −1.2% | −2.8% | −2% | |||
| P value | |||||||
| 0.272 | 0.301 | 0.187 | 0.236 | ||||
| Femur 6 | 1704 | 1744 | 1794 | 1597 | 1647 | 1674 | .786 |
| D.S. | 359 | 264 | 263.2 | 135 | 157 | 222 | .786 |
| % variation | +2.3% | +5.3% | +1.3% | +4.6% | |||
| P value | |||||||
| .316 | .109 | .463 | .176 | ||||
| Femur 7 | 1406 | 1320 | 1330 | 1338 | 1247 | 1253 | .174 |
| D.S. | 217 | 271 | 266 | 160 | 231 | 197 | .174 |
| % variation | −6.1% | −5.5% | −6.9% | −6.4% | |||
| P value | |||||||
| 0.001 | 0.03 | 0.01 | 0.01 | ||||
To evaluate BMD differences at the end of the follow-up according to BMI (Table 3B) we subdivide the sample into two groups (Group 1: BMI<30, and Group 2: BMI>30). 30 was chosen as the cut-off point as it is the study population median it divided the sample into two homogeneous groups. We saw that in the BMI<30 group BMD varied from −7.6% to +4.7%, while in the BMI>30 group it varied from -1.8% to +5.8%. This difference between the two subgroups was not found to be statistically significant in any of the areas studied.
To complete this research changes in bone mass around the implants were studied in men and women (Table 3C). For the men the variation in bone mass throughout the follow-up showed variations from −5.5% to +5.3%, while in the women these ranged from −6.4% to +4.6%, without detecting any statistically significant differences between the sexes.
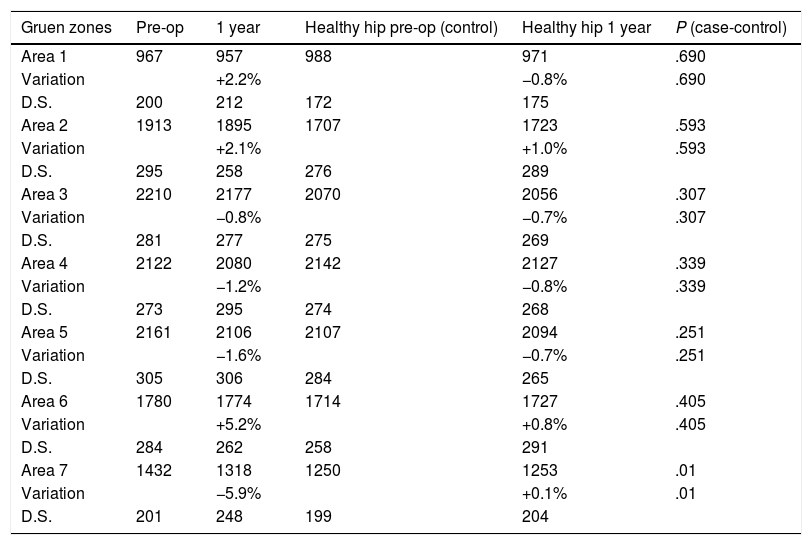
Respecting the evolution of bone mass in the healthy hip (Table 4) that was used as the control, a variation in bone mass was observed of from −0.8% to +1.0%. Statistically significant differences were detected (P=.01) in zone seven when comparing the variation in BMD between the healthy hip and the femur with the prosthesis at one year after the intervention.
Comparison between bone remodelling in the hip with the prosthesis (case) and the healthy hip (control). Bone mineral density is expressed in mg calcium/cm2.
| Gruen zones | Pre-op | 1 year | Healthy hip pre-op (control) | Healthy hip 1 year | P (case-control) |
|---|---|---|---|---|---|
| Area 1 | 967 | 957 | 988 | 971 | .690 |
| Variation | +2.2% | −0.8% | .690 | ||
| D.S. | 200 | 212 | 172 | 175 | |
| Area 2 | 1913 | 1895 | 1707 | 1723 | .593 |
| Variation | +2.1% | +1.0% | .593 | ||
| D.S. | 295 | 258 | 276 | 289 | |
| Area 3 | 2210 | 2177 | 2070 | 2056 | .307 |
| Variation | −0.8% | −0.7% | .307 | ||
| D.S. | 281 | 277 | 275 | 269 | |
| Area 4 | 2122 | 2080 | 2142 | 2127 | .339 |
| Variation | −1.2% | −0.8% | .339 | ||
| D.S. | 273 | 295 | 274 | 268 | |
| Area 5 | 2161 | 2106 | 2107 | 2094 | .251 |
| Variation | −1.6% | −0.7% | .251 | ||
| D.S. | 305 | 306 | 284 | 265 | |
| Area 6 | 1780 | 1774 | 1714 | 1727 | .405 |
| Variation | +5.2% | +0.8% | .405 | ||
| D.S. | 284 | 262 | 258 | 291 | |
| Area 7 | 1432 | 1318 | 1250 | 1253 | .01 |
| Variation | −5.9% | +0.1% | .01 | ||
| D.S. | 201 | 248 | 199 | 204 |
Bone loss in the proximal femur as the result of stress-shielding has been described in practically all cases of femoral implant.3,4,14
Uncemented anatomical stems have been shown over decades to be reliable implants.6,9–12,15 Several studies with long-term follow-up have revealed excellent and consistent results for some models, including the ABG-II stem,9–11 the predecessor of the ANATO® stem.
At first this bone loss is also influenced by other factors, including the surgical aggression, immediate postoperative rest and partial weight loading.10,16 In fact the surgical drilling and preparation of the proximal femur cause an immediate reduction in the bone stock17 that is calculated to amount to from 2 to 10%. In our sample we were able to observe that bone mineral density generally fell in the first determination after three months, due probably to the above-mentioned factors.
The determination at six months found a gradual recovery in all of the areas, probably associated with an increase in habitual physical activity that stimulated bone remodelling. Moreover, this recovery in BMD reflects the biomechanical response of the bone, according to Wolff’s law, as a result of the osteointegration of the implant, achieving secondary stability. The greatest recovery was found in areas two and six in comparison with the postoperative determination of BMD, and the greatest losses were found in area seven as a result of the redistribution of loads following the implantation of the stem. Thus the metaphyseal areas receive loads that favour the conservation and increase of BMD, while in the proximal zones the loads transmitted at this level are not enough to favour bone conservation, leading to atrophy due to disuse.
After one year of follow-up the bone mass levels in area seven suggest that it remains partially unused and that it does not receive sufficient loading stimulation that would favour bone recovery. Areas two and six, where more loads are transmitted, show positive remodelling and an increase in bone mass in accordance with Wolff’s law. Slight losses were detected in zones three and five.
When the results obtained with the ANATO® stem in our study are compared with those published in recent years for its predecessor (ABG-ii®),9–11 we find that the ANATO® stem is biomechanically more efficient in preserving the proximal femoral bone.
We believe that the main reason for this better preservation of the bone may lie in the characteristics of the biological coating of the ANATO® stem at the metaphyseal level, as the proximal coating with 200 microns of hydroxyapatite behaves like a mechanical factor in itself. At this level the increased thickness of the porous coating increases the intraoperative stability of the implant and favours a better and more extensive contact with the bone, minimising proximal atrophy and promoting bone conservation, together with a certain positive remodelling in the metaphyseal areas. This factor had been suggested beforehand in other studies.18 Nevertheless, we have to point out that it would be necessary to perform a randomised prospective comparative study of both stems to be able to prove this better behaviour.
On the other hand, there is disagreement about the role played by age, body mass index and sex in periprosthetic bone remodelling around the seven Gruen areas.
Authors such as Korovessis et al.19 and Sköldenberg et al.20 found no correlation between age and periprosthetic changes in BMD. Other authors consider that age may affect femoral bone remodelling, above all in the area of the greater trochanter and in area four.21
It has also been said that Gruen zones two and six may be affected by the sex of patients22 and that the body mass index may influence BMD in area three.21
When the influence of age on BMD variation was evaluated in our study the results show that remodelling is more uniform in young patients, who in principle have better bone quality and more rigid femurs. Although there are variations in BMD which in some zones are less than those in older patients, the difference is not statistically significant. Moreover, as these patients are physically active to a greater extent, they show remodelling changes earlier than do older patients, who have a tendency towards a more sedentary lifestyle.
Comparative statistical analysis found no differences between both age groups, and this was probably due to the relatively low average age of the population studied.
When we examine the effect of BMI on bone remodelling, the thinner patients are found to display a slight tendency to lose bone homogeneously in the areas studied, except for area six. These losses observed immediately after the operation are probably due to the surgical aggression, and gradual recovery of BMD occurs during follow-up as a result of the adaptive remodelling around the prosthesis.
In the group of more obese patients after one year of follow-up BMD was reinforced in load zones two and six, as well as in zones three and five. Additionally, in zone seven a small loss was observed. The reinforcing of BMD in these areas is basically due to the greater loads transmitted by patients with a higher BMI. Maloney et al.23 stated in their study that heavier patients tended to conserve more bone in distal areas than did those who weighed less. This increased load transmission in the proximal femur may also be explained by the reduced loss of function observed in area seven in the group of obese patients, in comparison with the group of thin patients.
Regarding sex, as a whole remodelling changes in the men, with large dense femurs and a higher initial BMD, were more gradual. On the other hand, in the women, with apparently smaller and less dense femurs, greater reactive changes at proximal and distal levels in comparison with the men were observed. Area seven was left without function in the men as well as in the women. However, no statistically significant differences were found between both groups, so that it can be concluded that sex does not affect the bone remodelling of the femur after the implantation of an ANATO® hip prosthesis. Our results agree with those found in other studies21,24 in which sex was not considered to be a predictive factor for the pattern of remodelling.
Finally, statistically significant variations were found in zone seven in BMD in comparison with the healthy hip at one year after the intervention. This zone suffers two aggressions during the surgical act. On the one hand, during exposure of the neck and calcar femorale to identify the osteotomy point a lesion in the blood supply around the bone occurs. On the other hand, the work of the drills and rasps to prepare the bed for the prosthetic stem damages the endosteal circulation. In this way zone seven is initially devascularised, and afterwards it partially loses functionality, explaining the bone losses observed at this level.
Several studies show the importance of taking into account the data corresponding to the healthy contralateral hip, to describe the bone mass density used as the control and how it varies over one year, depending on all of the clinical variables covered, except for the intervention.2,9–11,25
This study has certain limitations:
- •
The follow-up period in our study is relatively short, and changes attributable to late remodelling over the long term could be expected. Nevertheless, the majority of similar studies conclude that most bone remodelling occurs in the first year after implantation.
- •
The sample also includes a higher number of men than women, so that the results may be influenced by this proportion. It could be thought that as men have larger femurs larger and therefore more rigid prostheses are used for them, influencing the results obtained.
- •
Finally, the population studied is relatively young, so that in older patients the remodelling pattern may be different.
To conclude, the ANATO® stem permits the efficient transmission of loads from the stem into the proximal femur. Significant bone atrophy was only detected in zone seven, and this was initially attributable to the denervation and devascularisation suffered by the zone during the surgical technique.9–11 Differences in age, BMI and sex do not seem to influence the bone remodelling around this new stem.
Level of evidenceLevel of evidence II.
FinancingThis study received no specific support from public, commercial or not-for-profit bodies.
Conflict of interestsThe authors have no conflict of interests to declare, and they received no financing to perform this study.
Please cite this article as: López-Subías J, Panisello JJ., Mateo-Agudo J, Lillo-Adán M, Bejarano C, Rodríguez-Chacón L, Sorolla JF, Martín-Hernández C. >Estudio prospectivo del remodelado óseo femoral alrededor de un vástago anatómico de cadera: un año de seguimiento densitométrico. Rev Esp Cir Ortop Traumatol. 2021;65:31–40.
