


Hospitalized COVID-19 patients are prone to develop persistent symptoms and to show reduced quality of life following hospital admission.
MethodsProspective cohort study of COVID-19 patients admitted to a hospital from March 1 to April 30, 2020. The primary outcome was to compare health related quality of life and persistent symptoms six months after hospital admission, of COVID-19 patients who required ICU admission with those who did not.
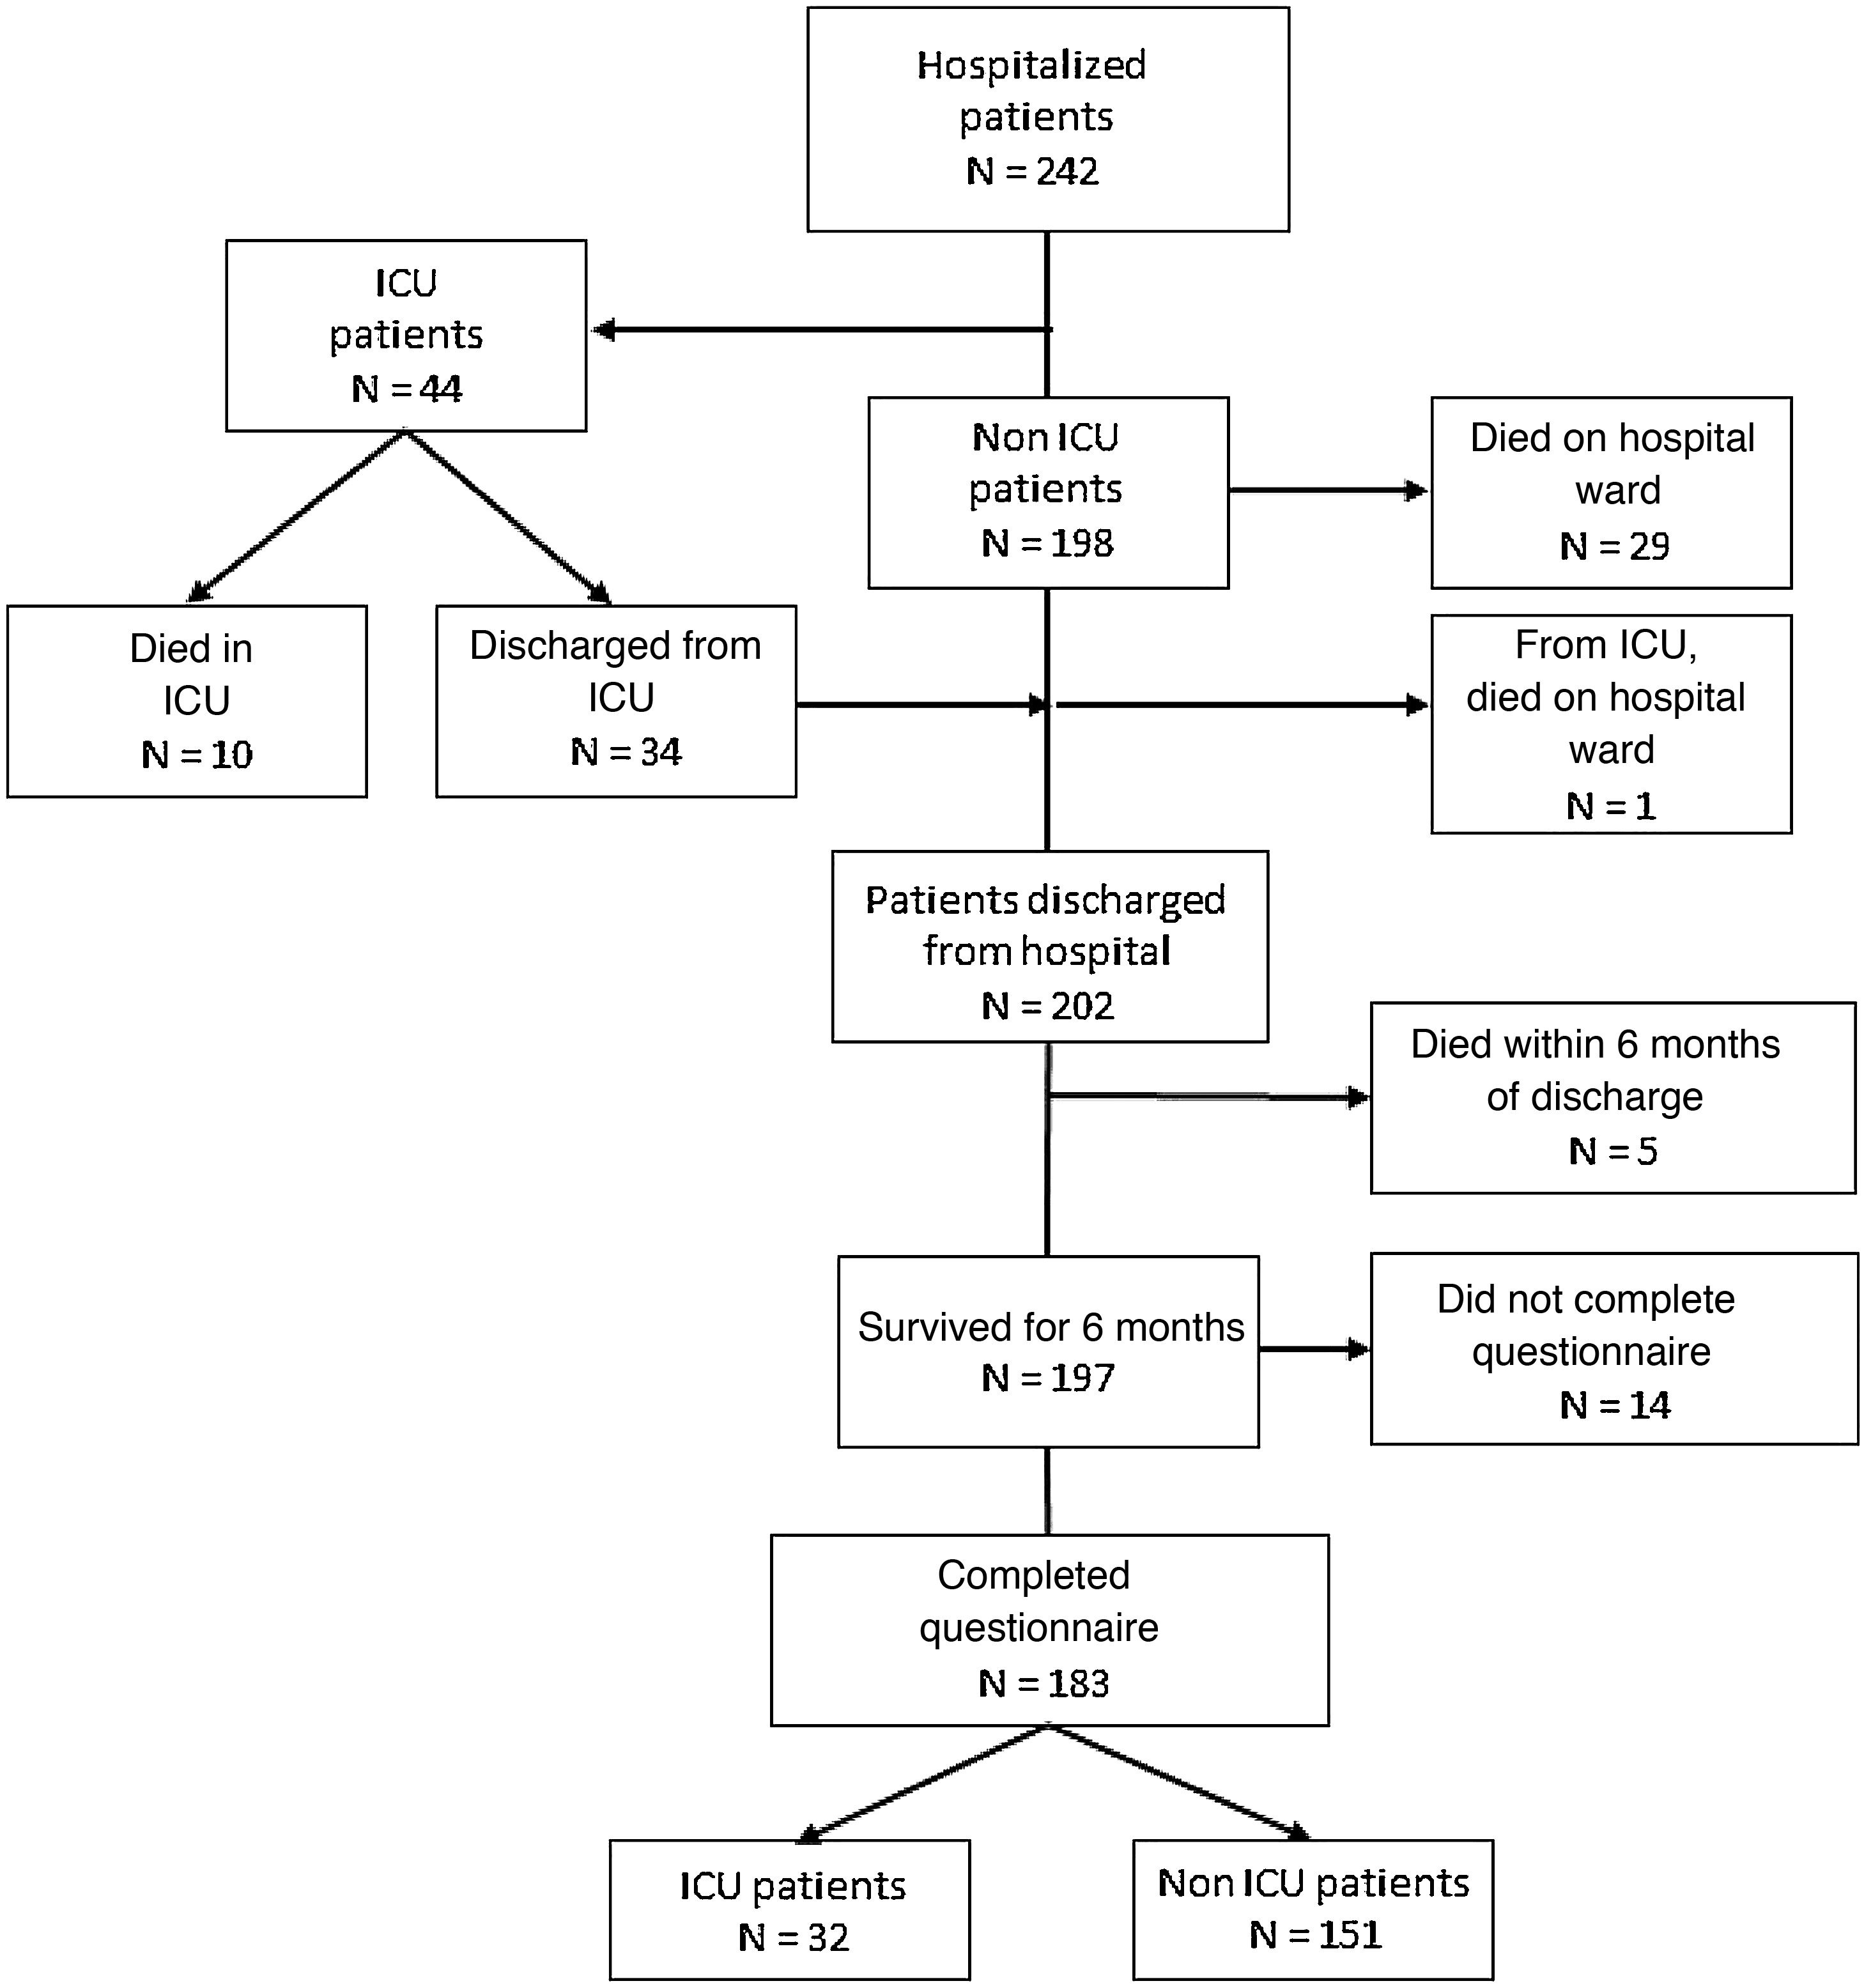
ResultsAmong the 242 patients hospitalized during the defined period of time, 44 (18.2%) needed ICU admission. Forty (16.5%) patients died during hospital admission. Two hundred and two (83.5%) patients were discharged alive from the hospital. At six months, 183 (75.6%) patients completed the questionnaires (32 ICU patients and 151 non ICU patients). Ninety-six (52.4%) reported decreased quality of life and 143 (78.1%) described persistent symptoms. More ICU patients showed worsening of their quality of life (71.9% vs 43.7%, P=0.004). There were no differences in the proportion of patients with persistent symptoms between ICU and non ICU patients (87.5% vs 76.2%, P=0.159). ICU patients showed more frequently dyspnea on exertion (78.1% vs 47.7%, P=0.02), dyspnea on light exertion (37.5% vs 4.6%, P<0.001), and asthenia (56.3 vs 29.1, P=0.003).
ConclusionsSurvivors of COVID-19 needing hospitalization had persistent symptoms and a decline in the quality of life. ICU patients referred a large decrease of their quality of life compared with non ICU patients.
Existe una tendencia en los pacientes hospitalizados por COVID-19 a desarrollar síntomas persistentes y a presentar una disminución en su calidad de vida tras el ingreso hospitalario.
MétodosEstudio de cohorte prospectivo de pacientes COVID-19 con ingreso hospitalario entre el 1 de marzo al 30 de abril de 2020. El objetivo primario fue comparar la calidad de vida relacionada con la salud y la presencia de síntomas persistentes seis meses después del ingreso, comparando los pacientes que requirieron ingreso en UCI con los que no lo precisaron.
ResultadosDe los 242 pacientes hospitalizados durante el período de estudio, 44 (18,2%) necesitaron ingreso en UCI. 40 (16,5%) pacientes fallecieron durante el ingreso hospitalario. 202 (83,5%) pacientes fueron dados de alta del hospital. A los seis meses, 183 (75,6%) pacientes completaron los cuestionarios (32 pacientes UCI y 151 pacientes no UCI). 96 (52,4%) refirieron disminución de la calidad de vida y 143 (78,1%) describieron síntomas persistentes. Un número mayor de pacientes de UCI mostraron un empeoramiento de su calidad de vida (71,9% vs 43,7%, P=0,004). No hubo diferencias en la proporción de pacientes con síntomas persistentes entre los pacientes con UCI y sin UCI (87,5% vs 76,2%, P=0,159). Los pacientes de UCI mostraron con mayor frecuencia disnea de esfuerzo (78,1% vs 47,7%, P=0,02), disnea de pequeños esfuerzos (37,5% vs 4,6%, P<0,001) y astenia (56,3 vs 29,1, P=0,003).
ConclusionesLos supervivientes de COVID-19 que necesitaron hospitalización presentaron síntomas persistentes y un deterioro de su calidad de vida. Los pacientes de UCI refirieron una mayor disminución de su calidad de vida en comparación con los pacientes que no precisaron UCI.
Coronavirus disease 2019 (COVID-19), the infection caused by Severe Acute Respiratory Syndrome Coronavirus 2 (SARS-CoV-2), is a newly recognized disease that has spread rapidly around the world1–4. The clinical spectrum of COVID-19 ranges from mild to critically ill cases. Although most patients present fever, cough, myalgia, or fatigue with favourable evolution, some patients develop dyspnoea and hypoxemia requiring hospitalization and/or intensive care unit (ICU) admission. The mode of transmission, general epidemiological findings, clinical presentation, treatments, and short-term outcomes, including mortality, have been described elsewhere. However, long-term outcomes in hospitalized patients have rarely been reported. These patients are prone to persistent symptoms and a reduced health-related quality of life (HRQoL) that impact their ability to care for themselves and to perform usual activities in the months following hospital discharge, especially those who have been admitted to the ICU. HRQoL is a major component of outcomes after hospital discharge, especially after intensive care admission, and should be systematically assessed. The aim of this study was to compare HRQoL and persistent symptoms 6 months after hospital admission among COVID-19 patients who required ICU admission and those who did not.
MethodsThis prospective cohort observational study was performed at the University Hospital of Santiago de Compostela, in Northwest Spain. The Galicia (Spain) ethics committee (CEImG) approved this study under number 2020-188. Informed consent was obtained from all participants by telephone. All adult patients admitted between 1 March and 30 April 2020 with SARS-CoV-2 infection confirmed by polymerase chain reaction (PCR) performed on a nasopharyngeal sample were included. Clinical outcomes were monitored until 1 November 2020, the date of last follow-up.
Age, gender, medical history, home treatment, labs on admission, hospital treatment, need for intensive care unit (ICU) admission, ICU treatment, in-hospital outcome, and outcome at 6 months after hospital admission were collected.
Data from all patients who survived were included in order to evaluate health-related quality of life (HRQoL), functional status, and persistent symptoms using a structured interview conducted by trained study investigators 6 months after hospital admission. HRQOL was assessed using the EuroQol Group Association 5-domain, 3-level questionnaire (EQ-5D-3L), which consists of 2 sections: the descriptive system and the visual analogue scale. The descriptive system measures 5 domains of health, including mobility, self-care, usual activities, pain/discomfort, and anxiety/depression, and assesses each domain across 3 levels: no problems, some problems, or extreme problems. The individual domains were converted to a utility score (EQ-5D index) ranging from -0.59 to 1.00, with 1.00 indicating full health and 0 indicating a state as bad as being dead. The visual analogue scale (EQ-VAS) ranges from 0=worst imaginable health state and 100=best imaginable health state5–7. Participants were also asked to describe persistent symptoms potentially correlated with COVID-19 (dyspnoea on exertion, dyspnoea on mild exertion, asthenia, apathy, myalgia, arthralgia, chest pain, anosmia, cough, sleep disorder, hair loss, memory loss, visual disturbances), and to evaluate their quality of life 1–3 months before COVID-19.
The primary outcome was to compare HRQoL and persistent symptoms 6 months after hospital admission in COVID-19 patients who required ICU admission with those who did not.
The secondary outcome was to determine factors associated with poor HRQOL in COVID-19 patients 6 months after hospital admission.
Statistical analysesAll analyses were performed using R (version 4.0.2; R Foundation for Statistical Computing) and IBM SPSS (version 26; SPSS, Inc., Chicago, IL, USA). Quantitative variables are expressed as median, interquartile range (IQR) or mean, standard deviation (SD) and categorical variables as number (%). The means for continuous variables were compared using unpaired or paired t-tests when the data were normally distributed; otherwise, the Mann–Whitney U test or Wilcoxon test were used. Proportions for categorical variables were compared using Pearson’s chi square or Fisher’s exact test, as appropriate; McNemar’s test was used to compare paired proportions.
Multivariable logistic regression analyses were used to determine factors associated with poor quality of life prior to and 6 months after hospitalization. Significant factors identified in the univariate analysis and clinically relevant variables were considered for inclusion in the multivariate models. All tests were 2-sided, with a significance level of P<0.05.
ResultsForty four (18.2%) of the 242 patients included during the study period required ICU admission. There were no differences between patients who did or did not require ICU admission in relation to demographics, comorbidities, or home treatment (Table 1). Table 1 shows the clinical course, and treatment administered during the hospital stay. ICU patients received corticosteroids and tocilizumab more frequently than non ICU patients. Mean (SD) APACHE II score in the 44 ICU patients was 13.09 (4.52), 21 (70.5%) patients required mechanical ventilation, and 8 (21.1%) required tracheostomy. Forty (16.5%) patients died (10 in ICU and 30 on the ward).
Demographics, clinical characteristics, and treatments during hospitalization (n=242).
| Characteristics | |||||
|---|---|---|---|---|---|
| Demographics | All hospitalized patients | ICU patients | Non ICU patients | P value | |
| No=242 | No=44 | No=198 | |||
| Age, mean (SD) | 65.94 (14.08) | 66.07 (11.17) | 65.91 (14.68) | 0.987 | |
| Age, n (%) | <50 | 32 (13.2) | 5 (11.4) | 27 (13.6) | 0.710 |
| 50−70 | 113 (46.7) | 23 (52.3) | 90 (45.5) | ||
| >70 | 97 (40.1) | 16 (36.4) | 81 (40.9) | ||
| Male sex, n (%) | 144 (59.5) | 19 (43.2) | 79 (39.9) | 0.688 | |
| Comorbidities, n (%) | |||||
| Hypertension | 107 (44.2) | 22 (50.0) | 85 (42.9) | 0.393 | |
| Hyperlipidaemia | 90 (37.2) | 13 (29.5) | 77 (38.9) | 0.246 | |
| Obesity (BMI≥30kgm−2) | 70 (28.9) | 13 (29.5) | 57 (28.8) | 0.920 | |
| Diabetes | 52 (21.6) | 12 (27.3) | 40 (20.3) | 0.310 | |
| Chronic pulmonary disease | 44 (18.2) | 6 (13.6) | 38 (19.2) | 0.387 | |
| Chronic Heart disease | 32 (13.2) | 7 (15.9) | 25 (12.6) | 0.561 | |
| Home treatments, n (%) | |||||
| ACE inhibitors | 26 (10.7) | 8 (18.2) | 18 (9.1) | 0.103 | |
| Anticoagulants | 21 (8.7) | 4 (9.1) | 17 (8.6) | 0.999 | |
| Antiplatelets | 29 (12.0) | 2 (4.5) | 27 (13.6) | 0.093 | |
| Statins | 90 (37.2) | 13 (29.5) | 77 (38.9) | 0.246 | |
| Laboratory parameters, median (IQR) | |||||
| Lymphocyte count, /μL | 800.00 (560.00−1250.00) | 510.00 (380.00−800.00) | 940.00 (630.00−1360.00) | <0.001 | |
| Lactate dehydrogenase, U/L | 344.00 (250.50−493.50) | 419.00 (298.75−748.50) | 322.00 (241.00−427.50) | <0.001 | |
| D-dimer, ng/mL | 719.50 (445.50−1261.75) | 996.50 (603.75−1509.00) | 653.50 (413.50−1148.75) | 0.004 | |
| C-reactive protein, mg/L | 7.00 (3.08−13.00) | 13.00 (6.70−16.99) | 6.28 (2.74−11.00) | <0.001 | |
| Procalcitonin, ng/mL | 0.11 (0.07−0.20) | 0.13 (0.10−0.66) | 0.10 (0.06−0.18) | 0.007 | |
| Serum Ferritin, μg/L | 548.00 (320.00−1161.00) | 1179.50 (504.00−920.00) | 505.00 (258.50−937.50) | <0.001 | |
| Hospital treatments, n (%) | |||||
| Lopinavir-ritonavir | 206 (85.5) | 41 (95.3) | 165 (83.3) | 0.043 | |
| Hydroxychloroquine | 232 (96.3) | 41 (95.3) | 191 (96.5) | 0.664 | |
| Azithromycin | 218 (90.8) | 39 (92.9) | 179 (90.4) | 0.774 | |
| Tocilizumab | 31 (12.8) | 22 (50.0) | 9 (4.5) | <0.001 | |
| Corticosteroids | 91 (37.6) | 40 (90.9) | 51 (25.8) | <0.001 | |
| Characteristics during hospitalization | |||||
| Died during ICU stay, n (%) | 10 (4.1) | 10 (22.7) | |||
| Died during hospitalization, n (%) | 30 (12.4) | 11 (25.0) | 29 (14.6) | 0.094 | |
| Length of hospital stay, days median (IQR) | 10.00 (7.00−17.00) | 28.00 (18.00−43.00) | 9.00 (7.00−12.75) | <0.001 | |
| Invasive ventilation, n (%) | 31 (12.8) | 31 (70.5) | |||
| Tracheostomy, n (%) | 8 (3.3) | 8 (21.1) | |||
| Duration of MV, days, median (IQR) | 8.50 (0.00−18.00) | 8.50 (0.00−18.00) | |||
| Length of ICU stay, days, median (IQR) | 13.00 (7.25−30.50) | 13.00 (7.25−30.50) | |||
| APACHE II, mean (SD) | 13.09 (4.52) | 13.09 (4.52) | |||
| Characteristics after hospital discharge, n (%) | |||||
| Hospital readmission | 19 (8.3) | 6 (13.6) | 13 (7.0) | 0.217 | |
| Died after hospital discharge | 5 (2.1) | 1 (2.3) | 4 (2.0) | 0.999 | |
| Total died at 6 months | 45 (18.6) | 12 (27.3) | 33 (16.7) | 0.089 | |
Data shown as number (percentage), median (interquartile range), or mean (standard deviation). ACE: Angiotensin-converting-enzyme; APACHE II: Acute Physiology and Chronic Health disease Classification System II; BMI: Body mass index; ICU: intensive care unit; IQR: interquartile range; MV: mechanical ventilation.
Two hundred and two patients were discharged from the Hospital. At 6 months, 183 patients completed the quality-of-life questionnaire (32 needed ICU admission and 151 did not). The study flow chart is shown in Fig. 1.

The results of the quality of life questionnaire (5Q-3D-3L) at the 6-month interview are shown in Tables 2 and 3. Ninety-six (52.4%) patients reported worsening in at least 1 of the 5 dimensions analysed in the EQ-5D-3L, and 44 (24%) patients reported worsening in 2 or more dimensions. The most frequently reported problems were anxiety/depression (37.7%) and pain/discomfort (35.0%). More women than men reported problems in performing their usual activities (25.0% vs 12.1%, P=0.024), pain/discomfort (45.2% vs 26.3%, P=0.007), and anxiety/depression (53.6% vs 24.2%, P<0.001). Need for mechanical ventilation during hospital admission was associated with worsened mobility (63.6 vs 17.4, P<0.001), performance of usual activities (40.9 vs. 14.9, P=0.006), pain/discomfort (59.1% vs 31.7%, P=0.011), and anxiety/depression (68.2 vs 33.5, P=0.002). Age, length of hospital stay and need of ICU admission were associated with worsening in all 5 dimensions studied.
Quality of life and functional status (n=183).
| Quality of life (EQ-5D-3L) | Before COVID-19 | 6 months after COVID-19 | P value | Before COVID-19 | 6 months after COVID-19 | ||||
|---|---|---|---|---|---|---|---|---|---|
| Characteristics: | No=183 | No=183 | ICU patients | Non ICU patients | P value | ICU patients | Non ICU patients | P value | |
| No=32 | No=151 | No=32 | No=151 | ||||||
| Mobility: | |||||||||
| No problems | 169 (92.3) | 141 (77.0) | <0.001 | 31 (96.9) | 138 (91.4) | 0.470 | 13 (40.6) | 128 (84.8) | <0.001 |
| Some problems/Unable to walk | 14 (7.7) | 42 (17.4) | 1 (3.1) | 13 (8.6) | 19 (59.4) | 23 (15.2) | |||
| Self-care: | |||||||||
| No problems | 177 (96.7) | 170 (92.9) | 0.016 | 32 (100.0) | 145 (96.0) | 0.592 | 27 (84.4) | 143 (94.7) | 0.054 |
| Some problems/Unable to wash or dress myself | 6 (3.3) | 13 (7.1) | 0 (0.0) | 6 (4.0) | 5 (15.6) | 8 (5.3) | |||
| Usual activities: | |||||||||
| No problems | 176 (96.2) | 150 (82.0) | <0.001 | 32 (100.0) | 144 (95.4) | 0.608 | 20 (62.5) | 130 (86.1) | 0.002 |
| Some problems/Unable to perform | 7 (3.8) | 33 (18.0) | 0 (0.0) | 7 (4.6) | 12 (37.5) | 21 (13.9) | |||
| Pain or discomfort | |||||||||
| No pain or discomfort | 165 (90.2) | 119 (65.0) | <0.001 | 31 (96.9) | 134 (88.7) | 0.206 | 15 (46.9) | 104 (68.9) | 0.018 |
| Some or extreme pain or discomfort | 18 (9.8) | 64 (35.0) | 1 (3.1) | 17 (11.3) | 17 (53.1) | 47 (31.1) | |||
| Anxiety or depression | |||||||||
| Not anxious or depressed | 171 (93.4) | 114 (62.3) | <0.001 | 32 (100.0) | 139 (92.1) | 0.130 | 12 (37.5) | 102 (67.5) | 0.001 |
| Moderately or extremely anxious or depressed | 12(6.6) | 69 (37.7) | 0 (0.0) | 12 (7.9) | 20 (62.5) | 49 (32.5) | |||
| EQ-5D index | 0.9474 (0.1306) | 0.8074 (0.2173) | <0.001 | 0.9859 (0.0554) | 0.9392 (0.1402) | 0.059 | 0.6724 (0.2504) | 0.8360 (0.1991) | <0.001 |
| EQ-VAS (0−100) | 85.81 (14.74) | 72.51 (18.85) | <0.001 | 87.81 (10.08) | 85.38 (15.55) | 0.887 | 60.13 (14.70) | 75.09 (18.65) | <0.001 |
Data shown as n (%) or mean (SD). Quality of life measured using the EuroQol, 5-dimension, 3-level questionnaire, the EQ-5D index, and the EQ-VAS (0−100). Bold indicates statistical significance.
Percentage of EQ-5D problems reported.
| Mobility | Self-care | Usual activities | Pain or discomfort | Anxiety or depression | |||||||
|---|---|---|---|---|---|---|---|---|---|---|---|
| Problems or unable | P | Problems or unable | P | Problems or unable | P | Some or extreme | P | Moderate or extreme | P | ||
| Sex: | Male | 19 (19.2) | 0.189 | 7 (7.1) | 0.985 | 12 (12.1) | 0.024 | 26 (26.3) | 0.007 | 24 (24.2) | <0.001 |
| Female | 23 (27.4) | 6 (7.1) | 21 (25.0) | 38 (45.2) | 45 (53.6) | ||||||
| ICU | ICU | 19 (59.4) | <0.001 | 5 (15.6) | 0.039 | 12 (37.5) | 0.002 | 17 (53.1) | 0.018 | 20 (62.5) | 0.001 |
| Not ICU | 23 (15.2) | 8 (5.3) | 21 (37.5) | 47 (31.1) | 49 (32.5) | ||||||
| Comorbidity | No | 16 (21.9) | 0.787 | 3 (4.1) | 0.199 | 12 (16.4) | 0.648 | 24 (32.9) | 0.628 | 28 (38.4) | 0.882 |
| Yes | 26 (23.6) | 10 (9.1) | 21 (19.1) | 40 (36.4) | 41 (37.3) | ||||||
| Obesity | No | 31 (23.3) | 0.851 | 9 (6.8) | 0.753 | 26 (19.5) | 0.384 | 45 (33.8) | 0.599 | 50 (37.6) | 0.960 |
| Yes | 11 (22.0) | 4 (8.0) | 7 (14.0) | 19 (38.0) | 19 (38.0) | ||||||
| Hypertension | No | 26 (24.5) | 0.552 | 6 (5.7) | 0.372 | 20 (18.9) | 0.730 | 35 (33.0) | 0.516 | 41 (38.7) | 0.750 |
| Yes | 16 (20.8) | 7 (9.1) | 13 (16.9) | 29 (37.7) | 28 (36.4) | ||||||
| Diabetes | No | 33 (21.9) | 0.388 | 10 (6.6) | 0.467 | 26 (17.2) | 0.480 | 50 (33.1) | 0.201 | 59 (39.1) | 0.476 |
| Yes | 9 (29.0) | 3 (9.7) | 7 (22.6) | 14 (45.2) | 10 (32.3) | ||||||
| Chronic heart disease | No | 39 (23.4) | 0.676 | 11 (6.6) | 0.317 | 30 (18.0) | 0.999 | 58 (34.7) | 0.824 | 63 (37.7) | 0.986 |
| Yes | 3 (18.8) | 2 (12.5) | 3 (18.8) | 6 (37.5) | 6 (37.5) | ||||||
| Chronic pulmonary disease | No | 37 (23.7) | 0.553 | 10 (6.4) | 0.412 | 28 (17.9) | 0.999 | 54 (34.6) | 0.808 | 59 (37.8) | 0.938 |
| Yes | 5 (18.5) | 3 (11.1) | 5 (18.5) | 10 (37.0) | 10 (37.0) | ||||||
| Mechanical ventilation | No | 28 (17.4) | <0.001 | 9 (5.6) | 0.054 | 24 (14.9) | 0.006 | 51 (31.7) | 0.011 | 54 (33.5) | 0.002 |
| Yes | 14 (63.6) | 4 (18.2) | 9 (40.9) | 13 (59.1) | 15 (68.2) | ||||||
| Age, mean (SD) | 67.19 (11.05) | 0.023 | 70.31 (9.94) | 0.026 | 68.24 (11.15) | 0.009 | 64.25 (12.81) | 0.436 | 63.22 (13.60) | 0.698 | |
| Length of hospital stay, median (IR) | 18.0 (8.0−36.75) | <0.001 | 20.0 (12.5−68.0) | 0.001 | 17.0 (11.0−37.5) | <0.001 | 12.0 (8.0−20.0) | 0.003 | 12.0 (8.0−20.0) | 0.005 | |
Data are shown as n (%), mean (SD), or median (IQR). ICU: Intensive care unit. Bold indicates statistical significance.
ICU patients reported a significantly reduced quality of life measured on the EQ-5D index score and VAS score compared with non ICU patients (Table 2). More ICU patients showed worsening in at least 1 of the 5 dimensions studied (71.9% vs 43.7%, P=0.004), or in 2 or more dimensions (59.4% vs 16.6%, P<0.001) compared with non ICU patients.
Table 4 shows persistent symptoms potentially correlated with COVID-19 observed in the 183 study patients. Only 40 (21.8%) patients were completely free of persistent symptoms at the 6-month interview. The most frequent persistent symptoms reported were dyspnoea on exertion (53.0%), asthenia (33.9%), sleep disorder (30.6%), hair loss (30.6%), arthralgia (30.1%) and myalgia (29.5). There were no differences between the proportion of ICU and non ICU patients with persistent symptoms (87.5% vs 76.2%, P= 0.159). Compared with non ICU patients, ICU patients reported more dyspnoea on exertion, dyspnoea on mild exertion, and asthenia (Table 4).
Persistent symptoms at six months after COVID-19 (n=183).
| Persistent symptoms at 6 months | Overall | ICU patients | Non ICU patients | P value | |
|---|---|---|---|---|---|
| No = 183 | No = 32 | No = 151 | |||
| Patients with any symptoms | 143 (78.1) | 28 (87.5) | 115 (76.2) | 0.159 | |
| 1 symtom | 27 (18.9) | 4 (14.3) | 23 (20.0) | 0.680 | |
| 2 symptoms | 29 (20.3) | 5 (17.9) | 24 (20.9) | ||
| 3 or more symptoms | 87 (60.8) | 19 (67.9) | 68 (59.1) | ||
| Dyspnoea on exertion | 97 (53.0) | 25 (78.1) | 72 (47.7) | 0.002 | |
| Dyspnoea on mild exertion | 19 (10.4) | 12 (37.5) | 7 (4.6) | <0.001 | |
| Asthenia | 62 (33.9) | 18 (56.3) | 44 (29.1) | 0.003 | |
| Apathy | 33 (18.0) | 6 (18.8) | 27 (17.9) | 0.908 | |
| Myalgia | 54 (29.5) | 11 (34.4) | 43 (28.5) | 0.506 | |
| Arthralgia | 55 (30.1) | 10 (31.3) | 45 (29.8) | 0.871 | |
| Chest pain | 15 (8.2) | 0 (0.0) | 15 (9.9) | 0.077 | |
| Anosmia | 19 (10.4) | 3 (9.4) | 16 (10.6) | 0.999 | |
| Cough | 23 (12.7) | 4 (12.9) | 19 (12.7) | 0.999 | |
| Sleep disorder | 56 (30.6) | 6 (18.8) | 50 (33.1) | 0.109 | |
| Hair loss | 56 (30.6) | 10 (31.3) | 46 (30.5) | 0.930 | |
| Memory loss | 48 (26.2) | 7 (21.9) | 41 (27.2) | 0.538 | |
| Visual disturbances | 10 (5.5) | 1 (3.1) | 9 (6.0) | 0.999 | |
Data are shown as number (percentage). Bold indicates statistical significance.
Sex, age, length of hospital stay, comorbidity and need for ICU admission were included as independent variables in a multivariate logistic regression analysis (Table 5). Age was associated with greater risk of problems with mobility and usual activities. Female sex was associated with a higher risk of problems in performing usual activities, pain or discomfort, and anxiety or depression. Length of hospital stay was associated with a higher risk of problems with mobility, self-care, performing usual activities, and pain or discomfort (Table 5).
Multivariate logistic regression analysis of the relationships between the 5 dimensions of the EQ-5D-3L, functional status, and influencing factors.
| EQ-5D-3L dimensions | β | se (β) | P value | OR | IC 95% (OR) | |
|---|---|---|---|---|---|---|
| Mobility (Some problems/Unable to walk) | Female sex | 0.366 | 0.411 | 0.373 | 1.442 | 0.644−3.228 |
| Age | 0.038 | 0.019 | 0.041 | 1.039 | 1.001−1.077 | |
| Length of Hospital stay | 0.051 | 0.021 | 0.015 | 1.053 | 1.009−1.097 | |
| Comorbidity | −0.361 | 0.442 | 0.413 | 0.697 | 0.293−1.656 | |
| Need for ICU admission | 1.015 | 0.618 | 0.100 | 2.760 | 0.822−9.262 | |
| Self-care (Some problems/Unable to perform) | Female sex | −0.049 | 0.695 | 0.944 | 0.952 | 0.244−3.714 |
| Age | 0.047 | 0.032 | 0.137 | 1.048 | 0.985−1.114 | |
| Length of Hospital stay | 0.111 | 0.037 | 0.003 | 1.117 | 1.038−1.201 | |
| Comorbidity | 0.104 | 0.803 | 0.897 | 1.109 | 0.229−5.357 | |
| Need for ICU admission | −2.949 | 1.840 | 0.109 | 0.052 | 0.001−1.930 | |
| Usual activities (Some problems/Unable to perform) | Female sex | 0.960 | 0.454 | 0.034 | 2.613 | 1.074−6.355 |
| Age | 0.040 | 0.020 | 0.048 | 1.040 | 1.0004−1.082 | |
| Length of Hospital stay | 0.074 | 0.023 | 0.001 | 1.077 | 1.029−1.125 | |
| Comorbidity | −0.176 | 0.475 | 0.711 | 0.839 | 0.330−2.126 | |
| Need for ICU admission | −0.702 | 0.806 | 0.384 | 0.496 | 0.102−2.406 | |
| Pain/discomfort (Some or extreme) | Female sex | 0.885 | 0.335 | 0.008 | 2.424 | 1.257−4.670 |
| Age | 0.005 | 0.014 | 0.730 | 1.005 | 0.978−1.031 | |
| Length of Hospital stay | 0.041 | 0.018 | 0.021 | 1.042 | 1.006−1.079 | |
| Comorbidity | 0.116 | 0.354 | 0.743 | 1.123 | 0560−2.249 | |
| Need for ICU admission | −0.144 | 0.591 | 0.808 | 0.866 | 0.271−2.759 | |
| Anxiety/depression (Moderately or extremely) | Female sex | 1.320 | 0339 | 0.000 | 3.744 | 1.925−7.280 |
| Age | −0.004 | 0014 | 0.770 | 0.996 | 0.969−1.022 | |
| Length of Hospital stay | 0.029 | 0018 | 0.098 | 1.030 | 0.994−1.065 | |
| Comorbidity | 0.040 | 0.357 | 0.911 | 1.040 | 0.517−2.093 | |
| Need for ICU admission | 0.549 | 0.586 | 0.349 | 1.731 | 0.548−5.464 |
Quality of life was measured using the EuroQol, 5-dimension, 3-level questionnaire, the EQ-5D index, and the EQ-VAS (0−100). Bold values are statistically significant.
In this cohort study, we observed that quality of life had declined at 6-month follow-up in patients who required hospitalization for COVID-19. Persistent symptoms such as dyspnoea on exertion, asthenia, myalgia, hair loss, and sleep disorder were frequently reported. We also found that patients who required ICU admission reported lower overall quality of life than patients admitted to general medical wards.
Our findings are similar to those reported in long-term follow-up studies of ARDS survivors due to other aetiologies, such as influenza A(H1N1)8, or other coronavirus diseases9–13. The long-term problems observed after Severe Acute Respiratory Syndrome (SARS) in 2002 and Middle East Respiratory Syndrome (MERS) in 2012 were reduced HRQoL, respiratory compromise, muscle weakness, fatigue, pain disorders, and depression10–15.
Long-term COVID-19 symptoms are a major concern among the general public. A new term – long Covid16– has recently been introduced to describe illness in people who have either recovered from COVID-19 but still report long-term effects of the infection or have had the usual symptoms far longer than would be expected. Tenforde et al.17, in a multistate telephone survey of non-hospitalized symptomatic COVID-19 adults, showed that 35% of patients had not returned to their usual health status when interviewed 2–3 weeks after testing, resulting in prolonged illness and persistent symptoms. Fatigue (71%), cough (61%), and headache (61%) were the most commonly reported symptoms. In another study with a 60-day follow-up, Carfi et al.18 reported that 87% of patients discharged from hospital after recovering from COVID-19 still experienced at least 1 symptom 60 days after onset. Fatigue (53%), dyspnoea (43%) and joint pain (27%) were the most frequent symptoms reported. In these 2 studies, COVID-19 patients were followed up for 14–21 and 60 days, respectively. Our study included a long follow-up to determine the persistence of symptoms and the HRQoL of patients hospitalized for COVID-19. We found that these patients had worse HRQoL overall, and that patients requiring ICU care reported significantly lower quality of life compared with patients who were admitted to general medical wards. ICU patients present potential risk factors that have a negative impact on quality of life, such as age, comorbidities, prolonged mechanical ventilation, ICU stay or hospital stay, decreased mobility, delirium or depression, malnutrition, and need for muscle relaxants or corticosteroids. Corticosteroids, which have been shown to help reduce mortality secondary to the inflammatory response in COVID-19 patients19,20, were used more often in our ICU patients (91%) than in those who did not require ICU admission (26%). Previous studies have shown that corticosteroids induce myopathy, muscle wasting and weakness 1year after hospitalization21,22, and this can significantly reduce the quality of life of ICU survivors. The cumulative effect of these factors on HRQoL is unknown, and could be the focus of future research. Our study supports findings from other authors reporting poor long-term outcomes in critically ill patients23,24; however, we have found few studies comparing the HRQoL of patients with the same disease who were admitted to either the ICU or the ward13,25. Batawi et al.19 studied the HRQoL of MERS survivors who required hospitalization, and observed that 1year after diagnosis, ICU patients reported lower HRQoL than non ICU patients. Tøien et al.25 showed that trauma patients admitted to the ICU for more of 24h had lower HRQoL questionnaire scores compared with non ICU patients. Although ICU patients might be expected to experience worse HRQoL or decreased functional status compared with non ICU patients, Feemster et al.26 found no significant differences in HRQoL among 3 groups of patients: non hospitalized, hospitalized non ICU, and hospitalized ICU, and observed that hospitalization was associated with an increased risk of impairment in HRQoL after discharge. No differences were found between ICU and non ICU patients.
Limitations of this studyThis study has several limitations. First, it is a single-centre study with a limited number of patients. The results may not reflect the experience or outcomes of COVID-19 patients in other regions or countries. Second, 6 months after hospitalization patients were asked to evaluate their quality of life 1–3 months before COVID-19; we do not know whether their assessment may have been influenced by their clinical status at the time of the survey. Nevertheless, HRQoL was evaluated, and was found to correlate significantly with the EQ VAS and EQ-5D Index. Third, HRQoL and persistent symptoms were evaluated at 6 months after hospitalization, based on our hypothesis that the health problems presented at admission would have stabilized after 6 months, and that mortality beyond this date may be due to other factors. It would be important to assess these data at 1 and 5 years after hospitalization, because several authors have reported changes in HRQoL after that time22,27. A larger multicentre cohort study of patients with COVID-19 from Spain and other countries would help further define quality of life and persistent symptoms in the months or years following hospitalization.
ConclusionsIn this prospective cohort study of hospitalized patients with COVID-19, a large proportion of patients had persistent symptoms and reduced quality of life. ICU patients presented a greater decline in their quality of life compared with non ICU patients. Persistent symptoms were frequent in both ICU and non ICU patients. Our data suggest that interventions are needed to improve HRQoL after COVID-19, including telephone follow-up, post-hospital discharge rehabilitation programmes, and pain management.
Clinical trial numberThe ethics committee of Galicia, Spain (code 2020−188)
Funding statementNo funding provided.
Conflicts of interestThe authors have no conflict of interests to declare.
The authors would like to thank all the physicians and nurses from the participating hospitals.
Please cite this article as: Taboada M, Rodríguez N, Díaz-Vieito M, Domínguez MJ, Casal A, Riveiro V, et al. Calidad de vida y síntomas persistentes tras hospitalización por COVID-19. Estudio observacional prospectivo comparando pacientes con o sin ingreso en UCI. Rev Esp Anestesiol Reanim. 2022;69:326–335.
