


The clinical course of COVID-19 critically ill patients, during their admission in the intensive care unit (UCI), including medical and infectious complications and support therapies, as well as their association with in-ICU mortality has not been fully reported.
ObjectiveThis study aimed to describe clinical characteristics and clinical course of ICU COVID-19 patients, and to determine risk factors for ICU mortality of COVID-19 patients.
MethodsProspective, multicentre, cohort study that enrolled critically ill COVID-19 patients admitted into 30 ICUs from Spain and Andorra. Consecutive patients from March 12th to May 26th, 2020 were enrolled if they had died or were discharged from ICU during the study period. Demographics, symptoms, vital signs, laboratory markers, supportive therapies, pharmacological treatments, medical and infectious complications were reported and compared between deceased and discharged patients.
ResultsA total of 663 patients were included. Overall ICU mortality was 31% (203 patients). At ICU admission non-survivors were more hypoxemic [SpO2 with non-rebreather mask, 90 (IQR 83–93) vs 91 (IQR 87–94); p < 0.001] and with higher sequential organ failure assessment score [SOFA, 7 (IQR 5–9) vs 4 (IQR 3–7); p < 0.001]. Complications were more frequent in non-survivors: acute respiratory distress syndrome (ARDS) (95% vs 89%; p = 0.009), acute kidney injury (AKI) (58% vs 24%; p < 10−16), shock (42% vs 14%; p < 10−13), and arrhythmias (24% vs 11%; p < 10−4). Respiratory super-infection, bloodstream infection and septic shock were higher in non-survivors (33% vs 25%; p = 0.03, 33% vs 23%; p = 0.01 and 15% vs 3%, p = 10−7), respectively. The multivariable regression model showed that age was associated with mortality, with every year increasing risk-of-death by 1% (95%CI: 1–10, p = 0.014). Each 5-point increase in APACHE II independently predicted mortality [OR: 1.508 (1.081, 2.104), p = 0.015]. Patients with AKI [OR: 2.468 (1.628, 3.741), p < 10−4)], cardiac arrest [OR: 11.099 (3.389, 36.353), p = 0.0001], and septic shock [OR: 3.224 (1.486, 6.994), p = 0.002] had an increased risk-of-death.
ConclusionsOlder COVID-19 patients with higher APACHE II scores on admission, those who developed AKI grades II or III and/or septic shock during ICU stay had an increased risk-of-death. ICU mortality was 31%.
No se ha reportado plenamente la evolución clínica de los pacientes críticos de COVID-19 durante su ingreso en la unidad de cuidados intensivos (UCI), incluyendo las complicaciones médicas e infecciosas y terapias de soporte, así como su asociación con la mortalidad en ICU.
ObjetivoEl objetivo de este estudio es describir las características clínicas y la evolución de los pacientes ingresados en UCI por COVID-19, y determinar los factores de riesgo de la mortalidad en UCI de dichos pacientes.
MétodosEstudio prospectivo, multi-céntrico y de cohorte, que incluyó a los pacientes críticos de COVID-19 ingresados en 30 UCIs de España y Andorra. Se incluyó a los pacientes consecutivos de 12 de Marzo a 26 de Mayo de 2020 si habían fallecido o habían recibido el alta de la UCI durante el periodo de estudio. Se reportaron los datos demográficos, síntomas, signos vitales, marcadores de laboratorio, terapias de soporte, terapias farmacológicas, y complicaciones médicas e infecciosas, realizándose una comparación entre los pacientes fallecidos y los pacientes dados de alta.
ResultadosSe incluyó a un total de 663 pacientes. La mortalidad general en UCI fue del 31% (203 pacientes). Al ingreso en UCI los no supervivientes eran más hipoxémicos [SpO2 sin mascarilla de no reinhalación, de 90 (RIC 83–93) vs 91 (RIC 87–94); p < 0,001] y con mayor puntuación en la escala SOFA - Evaluación de daño orgánico secuencial - [SOFA, 7 (RIC 5–9) vs 4 (RIC 3–7); p < 0,001]. Las complicaciones fueron más frecuentes en los no supervivientes: síndrome de distrés respiratorio agudo (SDRA) (95% vs 89%; p = 0,009), insuficiencia renal aguda (IRA) (58% vs 24%; p < 10−16), shock (42% vs 14%; p < 10−13), y arritmias (24% vs 11%; p < 10−4). Las súper-infecciones respiratorias, infecciones del torrente sanguíneo y los shock sépticos fueron más frecuentes en los no supervivientes (33% vs 25%; p = 0,03, 33% vs 23%; p = 0,01 y 15% vs 3%, p = 10−7), respectivamente. El modelo de regresión multivariable reflejó que la edad estaba asociada a la mortalidad, y que cada año incrementaba el riesgo de muerte en un 1% (95%IC: 1–10, p = 0,014). Cada incremento de 5 puntos en la escala APACHE II predijo de manera independiente la mortalidad [OR: 1,508 (1,081, 2,104), p = 0,015]. Los pacientes con IRA [OR: 2,468 (1,628, 3,741), p < 10−4)], paro cardiaco [OR: 11,099 (3,389, 36,353), p = 0,0001], y shock séptico [OR: 3,224 (1,486, 6,994), p = 0,002] tuvieron un riesgo de muerte incrementado.
ConclusionesLos pacientes mayores de COVID-19 con puntuaciones APACHE II más altas al ingreso, que desarrollaron IRA en grados II o III y/o shock séptico durante la estancia en UCI tuvieron un riesgo de muerte incrementado. La mortalidad en UCI fue del 31%.
acute respiratory distress syndrome
acute kidney injury
chronic obstructive pulmonary disease
confidence interval
C-reactive protein
extracorporeal membrane oxygenation
Strengthening the Reporting of Observational Studies in Epidemiology
glutamic-pyruvic transaminase
high flow nasal therapy
intensive care unit
interquartile range
interleukin-6
kidney disease: improving global outcomes
lactate dehydrogenase
mechanical ventilation
non-invasive ventilation
neuromuscular blockers
odds ratio
carbon dioxide arterial pressure
arterial oxygen pressure to inspiratory oxygen fraction ratio
procalcitonin
Severe Acute Respiratory Syndrome Coronavirus 2
standard deviation
sequential organ failure assessment
peripheral oxyhemoglobin saturation
World Health Organization
On December 31st 2019, the Chinese office of the World Health Organization (WHO) reported a series of cases of pneumonia of unknown origin in Wuhan City, China.1 On February 11th 2020, the causative agent of the disease named Coronavirus Disease 2019 (COVID-19), a new type of coronavirus named as “Severe Acute Respiratory Syndrome Coronavirus 2 (SARS-CoV-2)” was identified. On March 13th 2020, three months after the first case and coinciding with the arrival of the first cases to the intensive care units (ICU) in Spain, the declaration of a pandemic was made.
Within the clinical spectrum of patients infected with COVID-19 some develop a viral pneumonia with severe hypoxemia and characteristic pulmonary infiltrates that can evolve into an acute respiratory distress syndrome (ARDS), the most severe form of acute respiratory failure.2 The pandemic scenario has pushed the resources of many ICUs to the limit in different countries worldwide. Retrospective data coming from China, Italy, and the United States described the clinical characteristics of critically ill patients, and prognostic factors for ARDS or death as well as ventilation strategies commonly used.3–9 As it has been shown, many of these patients present with an extremely serious clinical condition, often associating non-respiratory organic dysfunctions or displaying secondary superinfections. However, until today, the clinical course including medical complications or supportive therapies in ICU patients has not been prospectively reported. The present study prospectively describes the clinical course, treatment received, outcomes, and risk factors for in-ICU mortality in critically ill COVID-19 patients admitted to ICUs throughout Spain.
MethodsStudy designThis is a prospective, multicentre, observational, cohort study that enrolled critically ill patients with COVID-19 admitted to 30 ICUs in Spain, and Andorra (participating centres are listed in the Supplementary file). The study was approved by the referral Ethics Committee of Euskadi, Spain. The need for written informed consent from participants was considered by each participating centre. This study followed the “Strengthening the Reporting of Observational Studies in Epidemiology (STROBE)” statement guidelines for observational cohort studies.10 Patient and public involvement did not take place in this study.
Study population and data collectionData from patients’ electronic medical records was collected by physicians trained in critical care according to a previously standardized common protocol. Each investigator had a personal username and password and entered data into a specifically pre-designed online data acquisition system (CoVid19.ubikare.io). Patient confidentiality was protected by assigning a de-identified patient code. All consecutive COVID-19 patients included in the dataset from March 12th to May 26th, 2020 were enrolled if they fulfilled the following criteria: (1) >18 years old, and (2) had confirmed SARS-CoV-2 infection from a respiratory tract sample. Exclusion criteria were: (1) patients with non-confirmed SARS-CoV-2 infection according to WHO guidance,11 and (2) patients that had not accomplished the outcomes of death or ICU discharge by May 26th, 2020.
Recorded data included demographics, symptoms at ICU admission, vital signs, laboratory markers (bloodwork, coagulation, biochemistry), critical care supportive therapies (mechanical ventilation, renal replacement therapy, extracorporeal membrane oxygenation, etc.), pharmacological treatments, medical complications during stay (definitions are described in the Supplementary appendix), disease chronology [time from symptom onset and from hospital admission to ICU admission, to initiation of respiratory support, and to the onset of complications, and ICU length-of-stay (LOS)]. Sequential Organ Failure Assessment (SOFA) and APACHE II scores, and outcomes by May 26th, 2020 were also reported.
We defined baseline as the first day in ICU and a full set of data was collected on this day. We also gathered complete daily information and reported the “worst” values during the ICU period (maximum or minimum, depending on the variable). Our case report form collected data every day from ICU admission to either ICU discharge or death, whichever came first. It also allowed us to retrospectively collect data before ICU admission including symptoms at presentation or pharmacological treatment received. Before data were analysed, two independent investigators, and a statistician screened for erroneous data against standardized ranges and contacted local investigators in case of dubious values.
Measurements and outcomesThis study was aimed to describe the clinical characteristics and clinical course of COVID-19 patients admitted to ICU, as well as to determine risk factors for in-ICU mortality in COVID-19 patients.
Statistical analysisA pre-defined sample size was not estimated for this study. Descriptive variables are expressed as percentage, mean, and standard deviation (SD), or median and interquartile range (IQR), as appropriate for each variable. To compare variables across groups, Student t-test or Mann–Whitney test for numerical variables, and Chi squared test or Fisher exact test for categorical variables were used. Missing data was not imputed. Analyses were performed in a complete case analysis basis. All tests were two-sided, and a P-value <0.05 was considered statistically significant. Further, to explore the risk factors associated with in-ICU mortality, multivariable logistic regression models were computed. Parameters with a p-value less than 0.1 in univariate analysis were included with variables with more than 30% of missing data being excluded. Two different analyses were performed: (1) we investigated baseline factors such as demographics, comorbidities, symptoms and vital signs, laboratory markers, and severity scores at admission and (2) we explored factors related to the clinical course which included medical and infectious complications, and laboratory markers. Pseudo-r is presented as a measure of model fit. All analyses were performed with STATA version 16.
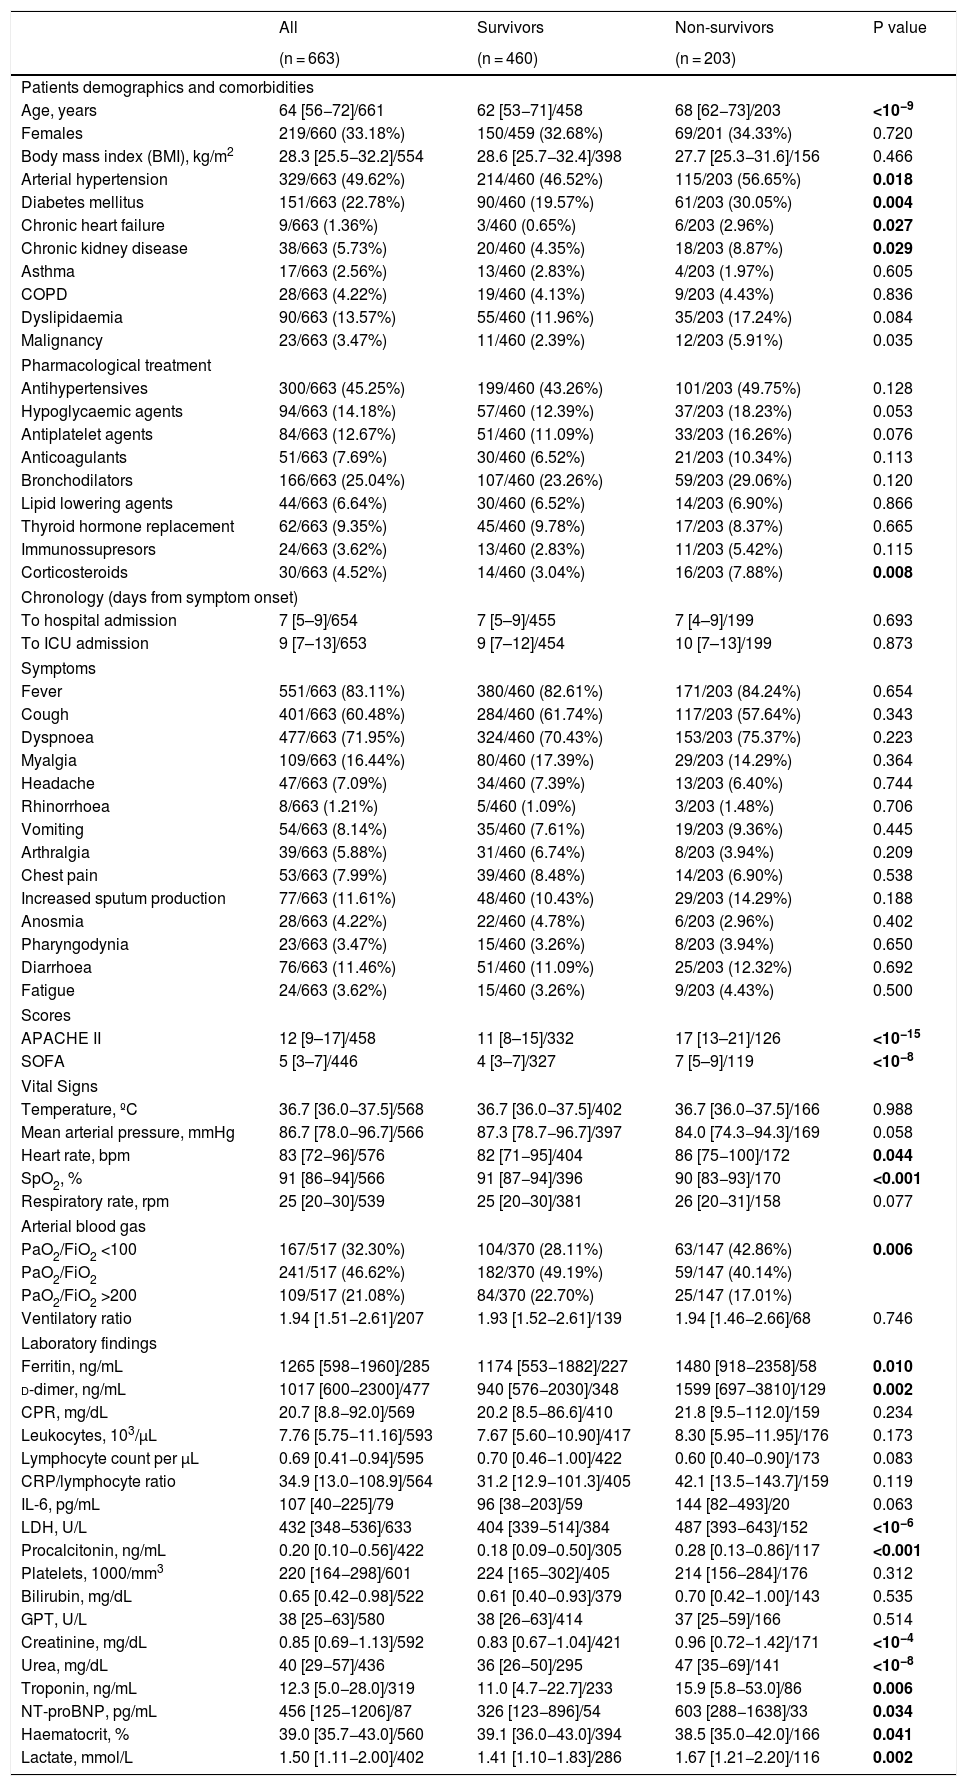
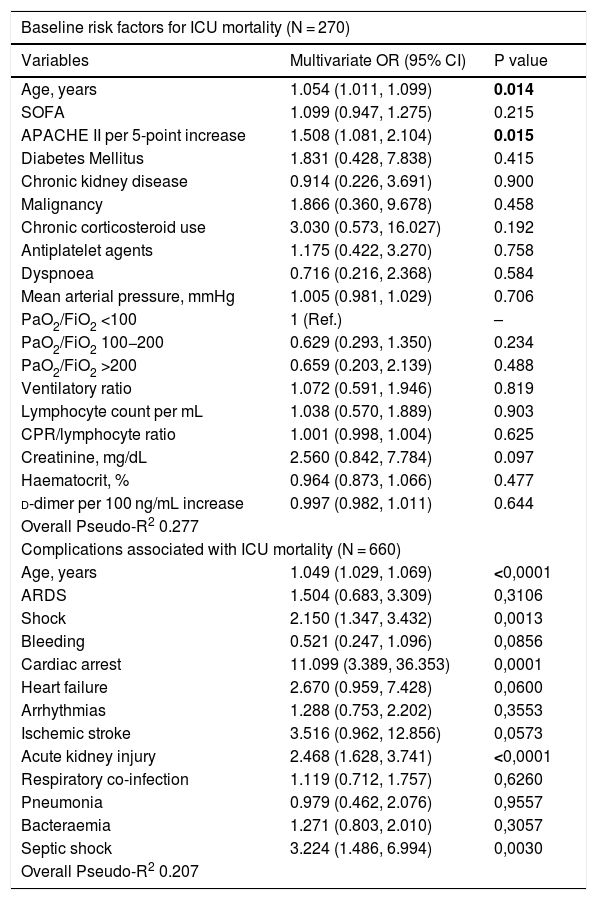
ResultsCharacteristicsOver a period of 80 days (between March 12th and May 26th, 2020), 663 patients with a definitive outcome of ICU discharge or death were admitted to 30 ICUs in Spain and Andorra. The enrolment of patients is still ongoing, and as of May 26th, 2020 297 (30%) patients were still in the ICU and therefore were not included in the analysis. Patients demographics, comorbidities and previous pharmacological treatments are shown in Table 1. The median days from symptom onset to hospital and ICU admission were 7 [IQR 5.0–9.0] and 9 [IQR 7.0–13.0], respectively with no differences between survivors and non-survivors (Table 1). Fever (83%) and dyspnoea (71%) were the most frequent symptoms at ICU admission. Among other symptoms, no differences were found between survivors and non-survivors. At ICU admission, non-survivors were sicker as shown by the substantial differences found in the severity scores [APACHE II, 17 (IQR 13–21) vs 11 (IQR 8–15); p < 0.001 and SOFA, 7 (IQR 5–9) vs 4 (IQR 3–7); p < 0.001]. Arterial blood gases at ICU admission showed that severe ARDS (PaO2/FiO2 < 100 mmHg) was more frequent in non-survivors (43% vs 28%; p = 0.006] (Table 1). The multivariable regression model showed that older age was associated with higher ICU mortality risk [OR 1.05; (95%CI: 1.011–1.099), p = 0.014], and that for each 5-point increase in APACHE II, the mortality risk increased by 51% [OR 1.508 (1.081, 2.104), p = 0.015] (Table 4). Worst values during admission and its relationship to ICU mortality are presented in Tables S1 and S2.
Demographic, comorbidities, pharmacological treatment, symptoms, scores, vital signs and laboratory markers on admission.
| All | Survivors | Non-survivors | P value | |
|---|---|---|---|---|
| (n = 663) | (n = 460) | (n = 203) | ||
| Patients demographics and comorbidities | ||||
| Age, years | 64 [56−72]/661 | 62 [53−71]/458 | 68 [62−73]/203 | <10−9 |
| Females | 219/660 (33.18%) | 150/459 (32.68%) | 69/201 (34.33%) | 0.720 |
| Body mass index (BMI), kg/m2 | 28.3 [25.5−32.2]/554 | 28.6 [25.7−32.4]/398 | 27.7 [25.3−31.6]/156 | 0.466 |
| Arterial hypertension | 329/663 (49.62%) | 214/460 (46.52%) | 115/203 (56.65%) | 0.018 |
| Diabetes mellitus | 151/663 (22.78%) | 90/460 (19.57%) | 61/203 (30.05%) | 0.004 |
| Chronic heart failure | 9/663 (1.36%) | 3/460 (0.65%) | 6/203 (2.96%) | 0.027 |
| Chronic kidney disease | 38/663 (5.73%) | 20/460 (4.35%) | 18/203 (8.87%) | 0.029 |
| Asthma | 17/663 (2.56%) | 13/460 (2.83%) | 4/203 (1.97%) | 0.605 |
| COPD | 28/663 (4.22%) | 19/460 (4.13%) | 9/203 (4.43%) | 0.836 |
| Dyslipidaemia | 90/663 (13.57%) | 55/460 (11.96%) | 35/203 (17.24%) | 0.084 |
| Malignancy | 23/663 (3.47%) | 11/460 (2.39%) | 12/203 (5.91%) | 0.035 |
| Pharmacological treatment | ||||
| Antihypertensives | 300/663 (45.25%) | 199/460 (43.26%) | 101/203 (49.75%) | 0.128 |
| Hypoglycaemic agents | 94/663 (14.18%) | 57/460 (12.39%) | 37/203 (18.23%) | 0.053 |
| Antiplatelet agents | 84/663 (12.67%) | 51/460 (11.09%) | 33/203 (16.26%) | 0.076 |
| Anticoagulants | 51/663 (7.69%) | 30/460 (6.52%) | 21/203 (10.34%) | 0.113 |
| Bronchodilators | 166/663 (25.04%) | 107/460 (23.26%) | 59/203 (29.06%) | 0.120 |
| Lipid lowering agents | 44/663 (6.64%) | 30/460 (6.52%) | 14/203 (6.90%) | 0.866 |
| Thyroid hormone replacement | 62/663 (9.35%) | 45/460 (9.78%) | 17/203 (8.37%) | 0.665 |
| Immunossupresors | 24/663 (3.62%) | 13/460 (2.83%) | 11/203 (5.42%) | 0.115 |
| Corticosteroids | 30/663 (4.52%) | 14/460 (3.04%) | 16/203 (7.88%) | 0.008 |
| Chronology (days from symptom onset) | ||||
| To hospital admission | 7 [5–9]/654 | 7 [5–9]/455 | 7 [4–9]/199 | 0.693 |
| To ICU admission | 9 [7–13]/653 | 9 [7–12]/454 | 10 [7–13]/199 | 0.873 |
| Symptoms | ||||
| Fever | 551/663 (83.11%) | 380/460 (82.61%) | 171/203 (84.24%) | 0.654 |
| Cough | 401/663 (60.48%) | 284/460 (61.74%) | 117/203 (57.64%) | 0.343 |
| Dyspnoea | 477/663 (71.95%) | 324/460 (70.43%) | 153/203 (75.37%) | 0.223 |
| Myalgia | 109/663 (16.44%) | 80/460 (17.39%) | 29/203 (14.29%) | 0.364 |
| Headache | 47/663 (7.09%) | 34/460 (7.39%) | 13/203 (6.40%) | 0.744 |
| Rhinorrhoea | 8/663 (1.21%) | 5/460 (1.09%) | 3/203 (1.48%) | 0.706 |
| Vomiting | 54/663 (8.14%) | 35/460 (7.61%) | 19/203 (9.36%) | 0.445 |
| Arthralgia | 39/663 (5.88%) | 31/460 (6.74%) | 8/203 (3.94%) | 0.209 |
| Chest pain | 53/663 (7.99%) | 39/460 (8.48%) | 14/203 (6.90%) | 0.538 |
| Increased sputum production | 77/663 (11.61%) | 48/460 (10.43%) | 29/203 (14.29%) | 0.188 |
| Anosmia | 28/663 (4.22%) | 22/460 (4.78%) | 6/203 (2.96%) | 0.402 |
| Pharyngodynia | 23/663 (3.47%) | 15/460 (3.26%) | 8/203 (3.94%) | 0.650 |
| Diarrhoea | 76/663 (11.46%) | 51/460 (11.09%) | 25/203 (12.32%) | 0.692 |
| Fatigue | 24/663 (3.62%) | 15/460 (3.26%) | 9/203 (4.43%) | 0.500 |
| Scores | ||||
| APACHE II | 12 [9–17]/458 | 11 [8–15]/332 | 17 [13–21]/126 | <10−15 |
| SOFA | 5 [3–7]/446 | 4 [3–7]/327 | 7 [5–9]/119 | <10−8 |
| Vital Signs | ||||
| Temperature, ºC | 36.7 [36.0−37.5]/568 | 36.7 [36.0−37.5]/402 | 36.7 [36.0−37.5]/166 | 0.988 |
| Mean arterial pressure, mmHg | 86.7 [78.0−96.7]/566 | 87.3 [78.7−96.7]/397 | 84.0 [74.3−94.3]/169 | 0.058 |
| Heart rate, bpm | 83 [72−96]/576 | 82 [71−95]/404 | 86 [75−100]/172 | 0.044 |
| SpO2, % | 91 [86−94]/566 | 91 [87−94]/396 | 90 [83−93]/170 | <0.001 |
| Respiratory rate, rpm | 25 [20−30]/539 | 25 [20−30]/381 | 26 [20−31]/158 | 0.077 |
| Arterial blood gas | ||||
| PaO2/FiO2 <100 | 167/517 (32.30%) | 104/370 (28.11%) | 63/147 (42.86%) | 0.006 |
| PaO2/FiO2 | 241/517 (46.62%) | 182/370 (49.19%) | 59/147 (40.14%) | |
| PaO2/FiO2 >200 | 109/517 (21.08%) | 84/370 (22.70%) | 25/147 (17.01%) | |
| Ventilatory ratio | 1.94 [1.51−2.61]/207 | 1.93 [1.52−2.61]/139 | 1.94 [1.46−2.66]/68 | 0.746 |
| Laboratory findings | ||||
| Ferritin, ng/mL | 1265 [598−1960]/285 | 1174 [553−1882]/227 | 1480 [918−2358]/58 | 0.010 |
| d-dimer, ng/mL | 1017 [600−2300]/477 | 940 [576−2030]/348 | 1599 [697−3810]/129 | 0.002 |
| CPR, mg/dL | 20.7 [8.8−92.0]/569 | 20.2 [8.5−86.6]/410 | 21.8 [9.5−112.0]/159 | 0.234 |
| Leukocytes, 103/µL | 7.76 [5.75−11.16]/593 | 7.67 [5.60−10.90]/417 | 8.30 [5.95−11.95]/176 | 0.173 |
| Lymphocyte count per µL | 0.69 [0.41−0.94]/595 | 0.70 [0.46−1.00]/422 | 0.60 [0.40−0.90]/173 | 0.083 |
| CRP/lymphocyte ratio | 34.9 [13.0−108.9]/564 | 31.2 [12.9−101.3]/405 | 42.1 [13.5−143.7]/159 | 0.119 |
| IL-6, pg/mL | 107 [40−225]/79 | 96 [38−203]/59 | 144 [82−493]/20 | 0.063 |
| LDH, U/L | 432 [348−536]/633 | 404 [339−514]/384 | 487 [393−643]/152 | <10−6 |
| Procalcitonin, ng/mL | 0.20 [0.10−0.56]/422 | 0.18 [0.09−0.50]/305 | 0.28 [0.13−0.86]/117 | <0.001 |
| Platelets, 1000/mm3 | 220 [164−298]/601 | 224 [165−302]/405 | 214 [156−284]/176 | 0.312 |
| Bilirubin, mg/dL | 0.65 [0.42−0.98]/522 | 0.61 [0.40−0.93]/379 | 0.70 [0.42−1.00]/143 | 0.535 |
| GPT, U/L | 38 [25−63]/580 | 38 [26−63]/414 | 37 [25−59]/166 | 0.514 |
| Creatinine, mg/dL | 0.85 [0.69−1.13]/592 | 0.83 [0.67−1.04]/421 | 0.96 [0.72−1.42]/171 | <10−4 |
| Urea, mg/dL | 40 [29−57]/436 | 36 [26−50]/295 | 47 [35−69]/141 | <10−8 |
| Troponin, ng/mL | 12.3 [5.0−28.0]/319 | 11.0 [4.7−22.7]/233 | 15.9 [5.8−53.0]/86 | 0.006 |
| NT-proBNP, pg/mL | 456 [125−1206]/87 | 326 [123−896]/54 | 603 [288−1638]/33 | 0.034 |
| Haematocrit, % | 39.0 [35.7−43.0]/560 | 39.1 [36.0−43.0]/394 | 38.5 [35.0−42.0]/166 | 0.041 |
| Lactate, mmol/L | 1.50 [1.11−2.00]/402 | 1.41 [1.10−1.83]/286 | 1.67 [1.21−2.20]/116 | 0.002 |
Data are expressed as median [interquartile range] or count (percentage). For numeric variables, total counts are presented for each cell. P values were calculated with Mann–Whitney test for numerical variables, and Fisher exact test for categorical variables. COPD: chronic obstructive pulmonary disease; SOFA: sequential organ failure assessment; SpO2: peripheral oxyhaemoglobin saturation; PaO2/FiO2: partial pressure of arterial oxygen to inspiratory oxygen fraction ratio; PaCO2: partial pressure of carbon dioxide; CRP: C-reactive protein; IL-6: interleukin 6; LDH: lactate dehydrogenase; GPT: pyruvic glutamic transaminase; NT-proBNP: N-terminal pro-brain natriuretic peptide. Mg/mL: milligram per millilitre, ng/mL: nanogram per millilitre, pg/mL: picogram per millilitre, and mmol/L: millimoles per litre, µL: microlitre, U/L: units per litre.
Risk factors associated with in-ICU mortality — multivariable logistic regression.
| Baseline risk factors for ICU mortality (N = 270) | ||
|---|---|---|
| Variables | Multivariate OR (95% CI) | P value |
| Age, years | 1.054 (1.011, 1.099) | 0.014 |
| SOFA | 1.099 (0.947, 1.275) | 0.215 |
| APACHE II per 5-point increase | 1.508 (1.081, 2.104) | 0.015 |
| Diabetes Mellitus | 1.831 (0.428, 7.838) | 0.415 |
| Chronic kidney disease | 0.914 (0.226, 3.691) | 0.900 |
| Malignancy | 1.866 (0.360, 9.678) | 0.458 |
| Chronic corticosteroid use | 3.030 (0.573, 16.027) | 0.192 |
| Antiplatelet agents | 1.175 (0.422, 3.270) | 0.758 |
| Dyspnoea | 0.716 (0.216, 2.368) | 0.584 |
| Mean arterial pressure, mmHg | 1.005 (0.981, 1.029) | 0.706 |
| PaO2/FiO2 <100 | 1 (Ref.) | – |
| PaO2/FiO2 100−200 | 0.629 (0.293, 1.350) | 0.234 |
| PaO2/FiO2 >200 | 0.659 (0.203, 2.139) | 0.488 |
| Ventilatory ratio | 1.072 (0.591, 1.946) | 0.819 |
| Lymphocyte count per mL | 1.038 (0.570, 1.889) | 0.903 |
| CPR/lymphocyte ratio | 1.001 (0.998, 1.004) | 0.625 |
| Creatinine, mg/dL | 2.560 (0.842, 7.784) | 0.097 |
| Haematocrit, % | 0.964 (0.873, 1.066) | 0.477 |
| d-dimer per 100 ng/mL increase | 0.997 (0.982, 1.011) | 0.644 |
| Overall Pseudo-R2 0.277 | ||
| Complications associated with ICU mortality (N = 660) | ||
| Age, years | 1.049 (1.029, 1.069) | <0,0001 |
| ARDS | 1.504 (0.683, 3.309) | 0,3106 |
| Shock | 2.150 (1.347, 3.432) | 0,0013 |
| Bleeding | 0.521 (0.247, 1.096) | 0,0856 |
| Cardiac arrest | 11.099 (3.389, 36.353) | 0,0001 |
| Heart failure | 2.670 (0.959, 7.428) | 0,0600 |
| Arrhythmias | 1.288 (0.753, 2.202) | 0,3553 |
| Ischemic stroke | 3.516 (0.962, 12.856) | 0,0573 |
| Acute kidney injury | 2.468 (1.628, 3.741) | <0,0001 |
| Respiratory co-infection | 1.119 (0.712, 1.757) | 0,6260 |
| Pneumonia | 0.979 (0.462, 2.076) | 0,9557 |
| Bacteraemia | 1.271 (0.803, 2.010) | 0,3057 |
| Septic shock | 3.224 (1.486, 6.994) | 0,0030 |
| Overall Pseudo-R2 0.207 | ||
Two multivariable logistic regression models are presented: the first one using predictors on admission to ICU, and the second one using complications as predictors. OR: odds ratio; SOFA: sequential organ failure assessment; SpO2: peripheral oxyhaemoglobin saturation; PaO2/FiO2: partial pressure of arterial oxygen to inspiratory oxygen fraction ratio; PaCO2: partial pressure of carbon dioxide; CRP: C-reactive protein; ARDS: acute respiratory distress syndrome. Mg/mL: milligram per millilitre, ng/mL: nanogram per millilitre.
Important inflammatory markers were significantly higher for non-survivors at ICU admission (Table 1): ferritin [1480 (IQR: 918–2358) vs 1174 (IQR: 553–1882); p = 0.010], d-dimer [1599 (697–3810) vs 940 (IQR: 576–2030); p = 0.002], procalcitonin (PCT) [0.28 (IQR: 0.13 to 0.86) vs 0.18 (IQR: 0.09 to 0.50); p < 0.001)] and lactate dehydrogenase (LDH) [487 (IQR: 393–643) vs 404 (IQR: 339–514); p < 0.001]. High-sensitivity troponin I [16 (IQR: 5–53) vs 11 (IQR: 4–22); p = 0.006], N terminal prohormone of brain natriuretic peptide (NT-proBNP) [603 (IQR: 288–1638) vs 326 (IQR: 123–896); p = 0.034], lactate [1.6 (IQR: 1.1–2.2) vs 1.4 (IQR: 1.1–1.8); p = 0.002] and creatinine [0.96 (IQR: 0.72–1.42) vs 0.83 (IQR: 0.67–1.04); p < 0.001)] were also significantly higher in non-survivors. The same finding was observed between survivors and non-survivors for the differences between the worst peak values for each laboratory marker (Table S1). The multivariable regression model showed that during ICU stay, PCT (OR 1.06; 95%CI: 1.01–1.11, p = 0.010) and platelets (OR 0.97; 95%CI: 0.993–1.000, p = 0.045) were associated to a higher risk of death (Table S2).
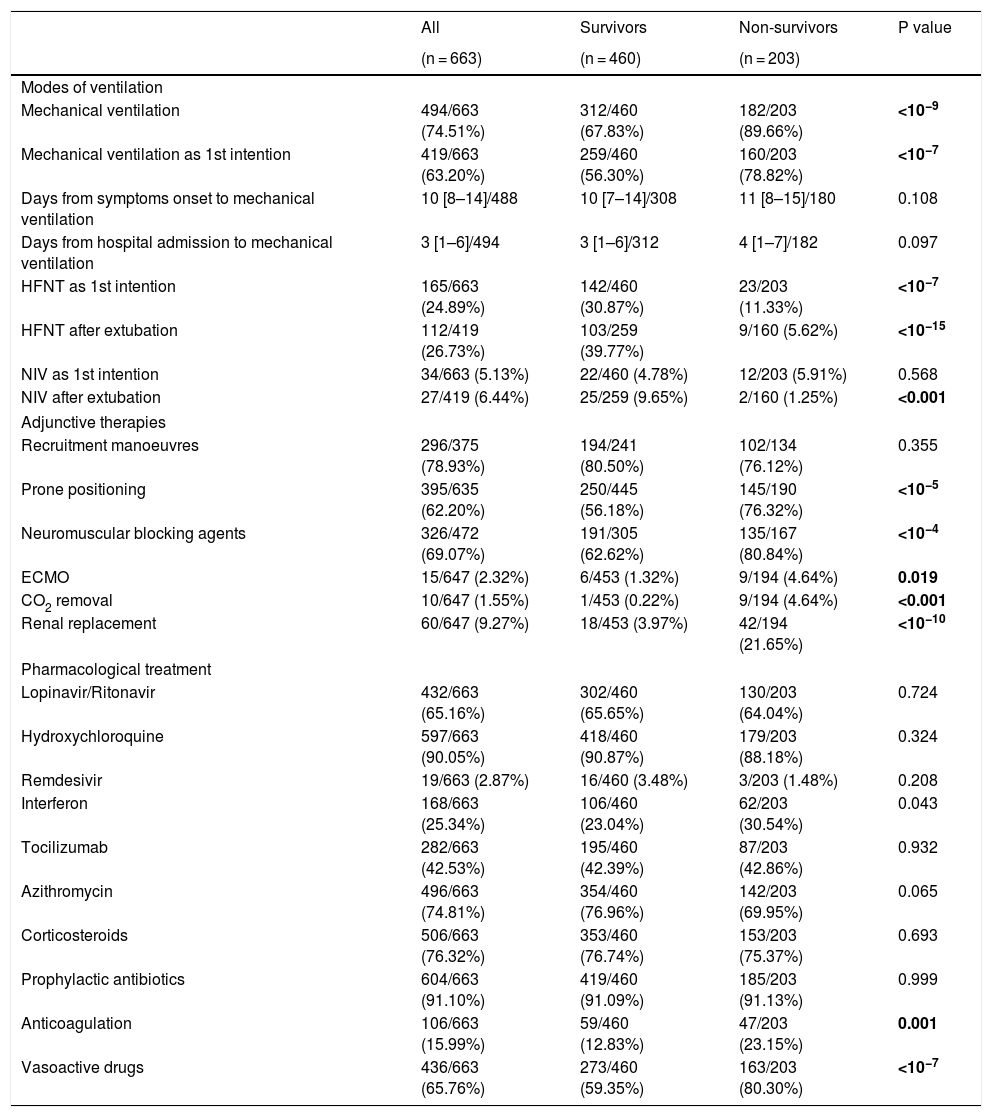
Respiratory support and adjunctive strategiesIn 199 out of 667 patients high flow nasal therapy (HFNT) or non-invasive ventilation (NIV) were chosen as the first therapeutic option for respiratory support, with HFNT (165, 24%) being more common than NIV (34, 5.1%). Besides, HFNT was used as first line treatment for respiratory support in 30% of survivors while in only 11% of non-survivors (p < 0.001). Invasive respiratory support was needed in 494 (74%) of patients, being required in 182 out of 203 non-survivors (89%), which was significantly higher (p < 0.001) than in survivors (312, 67%). The 19 non-survivors in whom invasive respiratory support was not instituted had not-to-intubate orders. The median time from symptom onset and from hospital admission to mechanical ventilation were 10 (IQR: 8–14) and 3 (IQR:1−6) days, respectively with no differences between survivors and non-survivors (Table 2). Regarding adjunctive therapies, lung recruitment manoeuvre was the commonest as it was applied in 78% of patients with no differences between survivors and non-survivors. Other therapies, such as prone positioning and the use of neuromuscular blocking agents were also frequently used [395 (62%) and 326 (69%), respectively], and they were clearly more frequently applied in deceased patients [145 (76%) vs 250 (56%); p < 0.001 and 135 (80%) vs 191 (62%); p < 0.001] (Table 2).
Ventilation, adjunctive therapies and pharmacological treatment during ICU stay.
| All | Survivors | Non-survivors | P value | |
|---|---|---|---|---|
| (n = 663) | (n = 460) | (n = 203) | ||
| Modes of ventilation | ||||
| Mechanical ventilation | 494/663 (74.51%) | 312/460 (67.83%) | 182/203 (89.66%) | <10−9 |
| Mechanical ventilation as 1st intention | 419/663 (63.20%) | 259/460 (56.30%) | 160/203 (78.82%) | <10−7 |
| Days from symptoms onset to mechanical ventilation | 10 [8–14]/488 | 10 [7–14]/308 | 11 [8–15]/180 | 0.108 |
| Days from hospital admission to mechanical ventilation | 3 [1–6]/494 | 3 [1–6]/312 | 4 [1–7]/182 | 0.097 |
| HFNT as 1st intention | 165/663 (24.89%) | 142/460 (30.87%) | 23/203 (11.33%) | <10−7 |
| HFNT after extubation | 112/419 (26.73%) | 103/259 (39.77%) | 9/160 (5.62%) | <10−15 |
| NIV as 1st intention | 34/663 (5.13%) | 22/460 (4.78%) | 12/203 (5.91%) | 0.568 |
| NIV after extubation | 27/419 (6.44%) | 25/259 (9.65%) | 2/160 (1.25%) | <0.001 |
| Adjunctive therapies | ||||
| Recruitment manoeuvres | 296/375 (78.93%) | 194/241 (80.50%) | 102/134 (76.12%) | 0.355 |
| Prone positioning | 395/635 (62.20%) | 250/445 (56.18%) | 145/190 (76.32%) | <10−5 |
| Neuromuscular blocking agents | 326/472 (69.07%) | 191/305 (62.62%) | 135/167 (80.84%) | <10−4 |
| ECMO | 15/647 (2.32%) | 6/453 (1.32%) | 9/194 (4.64%) | 0.019 |
| CO2 removal | 10/647 (1.55%) | 1/453 (0.22%) | 9/194 (4.64%) | <0.001 |
| Renal replacement | 60/647 (9.27%) | 18/453 (3.97%) | 42/194 (21.65%) | <10−10 |
| Pharmacological treatment | ||||
| Lopinavir/Ritonavir | 432/663 (65.16%) | 302/460 (65.65%) | 130/203 (64.04%) | 0.724 |
| Hydroxychloroquine | 597/663 (90.05%) | 418/460 (90.87%) | 179/203 (88.18%) | 0.324 |
| Remdesivir | 19/663 (2.87%) | 16/460 (3.48%) | 3/203 (1.48%) | 0.208 |
| Interferon | 168/663 (25.34%) | 106/460 (23.04%) | 62/203 (30.54%) | 0.043 |
| Tocilizumab | 282/663 (42.53%) | 195/460 (42.39%) | 87/203 (42.86%) | 0.932 |
| Azithromycin | 496/663 (74.81%) | 354/460 (76.96%) | 142/203 (69.95%) | 0.065 |
| Corticosteroids | 506/663 (76.32%) | 353/460 (76.74%) | 153/203 (75.37%) | 0.693 |
| Prophylactic antibiotics | 604/663 (91.10%) | 419/460 (91.09%) | 185/203 (91.13%) | 0.999 |
| Anticoagulation | 106/663 (15.99%) | 59/460 (12.83%) | 47/203 (23.15%) | 0.001 |
| Vasoactive drugs | 436/663 (65.76%) | 273/460 (59.35%) | 163/203 (80.30%) | <10−7 |
Data are expressed as median [interquartile range] or count (percentage). For numeric variables, total counts are presented for each cell. P values were calculated with Mann–Whitney test for numerical variables, and Fisher exact test for categorical variables. HFNT: high flow nasal therapy; NIV: non-invasive ventilation; ECMO: extracorporeal membrane oxygenation; CO2: carbon dioxide.
Treatments provided are shown in Table 2. We did not observe differences in the pharmacological treatment between survivors and non-survivors except for the use of vasoactive drugs [273 (59%) vs 183 (80%); p < 0.001] (Table 2). Among the antiviral drugs used, the use of hydroxychloroquine administered to 597 (90%) patients stood out. The use of remdesivir 19 (3%) was anecdotal. Regarding anti-inflammatory drugs, both corticosteroids 506 (76%) and tocilizumab 282 (42%) were frequently administered. It should be noted that full anticoagulant doses of heparin were used in 106 (15%) of the patients, being used more often in deceased patients (23% vs 13%, p < 0.001).
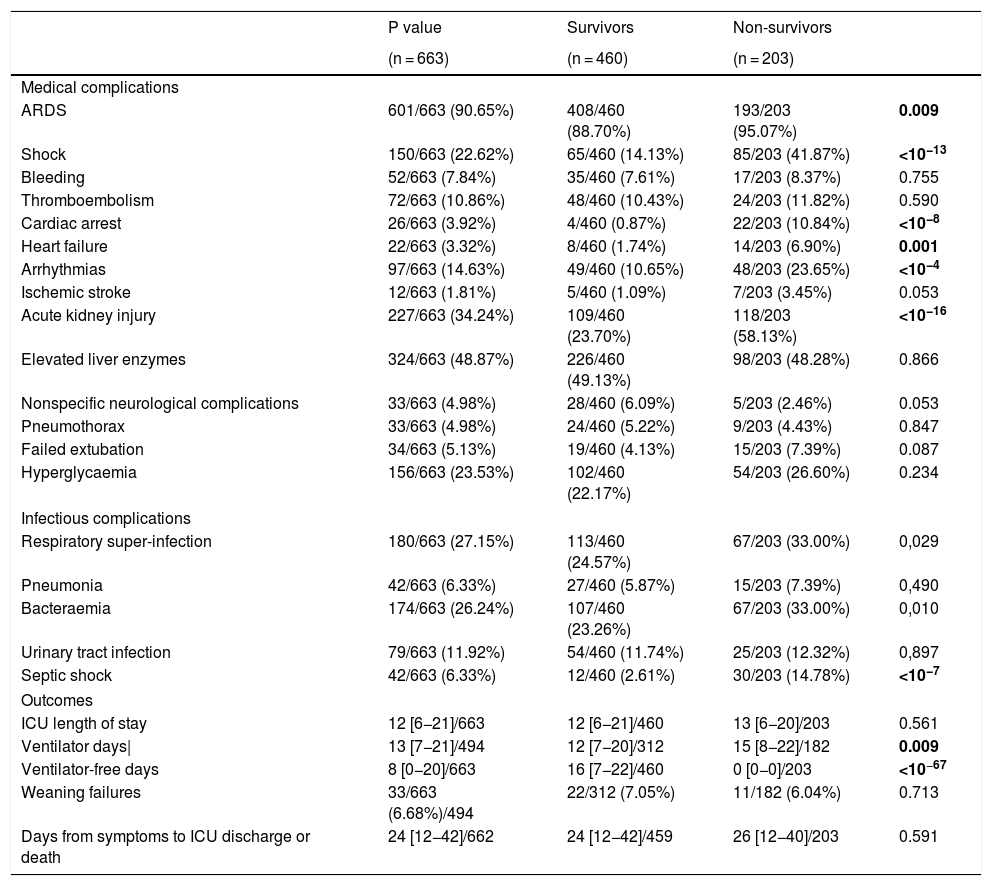
Medical and infectious complicationsComplications are shown on Table 3. Acute respiratory distress syndrome (ARDS) was the most commonly diagnosed complication in 597 (90%) patients followed by acute kidney injury (227; 34%). Less common complications, but still clinically relevant were shock (150; 23%), arrhythmias (97; 15%) and pulmonary embolism (72; 11%). Some were more frequent in non-survivors such as ARDS (95% vs 89%; p = 0.009), acute kidney injury (AKI) (58% vs 24%; p < 10−16), shock (42% vs 14%; p < 10−13), and arrhythmias (24% vs 11%; p < 10−4). Also, respiratory super-infection, bloodstream infection and septic shock were higher in non-survivors (33% vs 25%; p = 0.03, 33% vs 23%; p = 0.01 and 15% vs 3%, p = 10−7), respectively. However, pulmonary embolism was not different between groups (12% vs 10%, p = 0.59). Bacterial/fungal respiratory super-infection (176; 26%), and bloodstream infection (172; 25%) were very frequent and stood out above the rest of reported infections. Both, together with septic shock, were more frequent in non-survivors (33% vs 25%; p = 0.029, 33% vs 23%; p = 0.010 and 15% vs 3%, p < 0.0001). Patients with AKI [OR: 2.468 (1.628, 3.741), p < 10−4)], cardiac arrest [OR: 11.099 (3.389, 36.353), p = 0.0001], and septic shock [OR: 3.224 (1.486, 6.994), p = 0.002] had an increased risk-of-death (Table 4).
ICU complications and outcomes.
| P value | Survivors | Non-survivors | ||
|---|---|---|---|---|
| (n = 663) | (n = 460) | (n = 203) | ||
| Medical complications | ||||
| ARDS | 601/663 (90.65%) | 408/460 (88.70%) | 193/203 (95.07%) | 0.009 |
| Shock | 150/663 (22.62%) | 65/460 (14.13%) | 85/203 (41.87%) | <10−13 |
| Bleeding | 52/663 (7.84%) | 35/460 (7.61%) | 17/203 (8.37%) | 0.755 |
| Thromboembolism | 72/663 (10.86%) | 48/460 (10.43%) | 24/203 (11.82%) | 0.590 |
| Cardiac arrest | 26/663 (3.92%) | 4/460 (0.87%) | 22/203 (10.84%) | <10−8 |
| Heart failure | 22/663 (3.32%) | 8/460 (1.74%) | 14/203 (6.90%) | 0.001 |
| Arrhythmias | 97/663 (14.63%) | 49/460 (10.65%) | 48/203 (23.65%) | <10−4 |
| Ischemic stroke | 12/663 (1.81%) | 5/460 (1.09%) | 7/203 (3.45%) | 0.053 |
| Acute kidney injury | 227/663 (34.24%) | 109/460 (23.70%) | 118/203 (58.13%) | <10−16 |
| Elevated liver enzymes | 324/663 (48.87%) | 226/460 (49.13%) | 98/203 (48.28%) | 0.866 |
| Nonspecific neurological complications | 33/663 (4.98%) | 28/460 (6.09%) | 5/203 (2.46%) | 0.053 |
| Pneumothorax | 33/663 (4.98%) | 24/460 (5.22%) | 9/203 (4.43%) | 0.847 |
| Failed extubation | 34/663 (5.13%) | 19/460 (4.13%) | 15/203 (7.39%) | 0.087 |
| Hyperglycaemia | 156/663 (23.53%) | 102/460 (22.17%) | 54/203 (26.60%) | 0.234 |
| Infectious complications | ||||
| Respiratory super-infection | 180/663 (27.15%) | 113/460 (24.57%) | 67/203 (33.00%) | 0,029 |
| Pneumonia | 42/663 (6.33%) | 27/460 (5.87%) | 15/203 (7.39%) | 0,490 |
| Bacteraemia | 174/663 (26.24%) | 107/460 (23.26%) | 67/203 (33.00%) | 0,010 |
| Urinary tract infection | 79/663 (11.92%) | 54/460 (11.74%) | 25/203 (12.32%) | 0,897 |
| Septic shock | 42/663 (6.33%) | 12/460 (2.61%) | 30/203 (14.78%) | <10−7 |
| Outcomes | ||||
| ICU length of stay | 12 [6−21]/663 | 12 [6−21]/460 | 13 [6−20]/203 | 0.561 |
| Ventilator days| | 13 [7−21]/494 | 12 [7−20]/312 | 15 [8−22]/182 | 0.009 |
| Ventilator-free days | 8 [0−20]/663 | 16 [7−22]/460 | 0 [0−0]/203 | <10−67 |
| Weaning failures | 33/663 (6.68%)/494 | 22/312 (7.05%) | 11/182 (6.04%) | 0.713 |
| Days from symptoms to ICU discharge or death | 24 [12−42]/662 | 24 [12−42]/459 | 26 [12−40]/203 | 0.591 |
Data are expressed as median [interquartile range] or count (percentage). For numeric variables, total counts are presented for each cell. P values were calculated with Mann–Whitney test for numerical variables, and Fisher exact test for categorical variables. ARDS: acute respiratory distress syndrome; ICU: intensive care unit. Acute kidney injury (AKI) refer to stages II or III on the KDIGO classification. |Ventilator days include only patients that received mechanical ventilation.
The chronology of complications and treatments is shown on Figs. 1 and S1.
 ICU stay for discharged (upper graph) and deceased (lower graph) patients. The upper part of the graph represents discharged patients. The lower part of the graph represents deceased patients. Day 0 is the day of
 Chronology of treatments and complications during ICU stay for discharged (upper graph) and deceased (lower graph) patients.
The upper part of the graph represents discharged patients. The lower part of the graph represents deceased patients. Day 0 is the day of ICU admission. The vertical lines represent day of symptoms onset, day of hospital admission, day of ICU admission (day 0), and day of discharged (upper graph) or death (lower graph). Each horizontal bar plots the median day of start and median day of end of each treatment among patients with the treatment. Complications are represented at the median day of onset among patients with the complication. Infectious complications: 1 Septic shock; 2 Pneumonia; 3 Bacteraemia; 4 Urinary infection; 5 Respiratory co-infection; 6 Other infectious complication.
Medical complications: 1 ARDS; 2 Acute renal failure; 3 Arrhythmias; 4 Shock; 5 Bleeding; 6 Nonspecific neurological complications; 7 Thromboembolism; 8 Heart failure; 9 Cardiac arrest; 10 Ischemic Stroke; 11 Elevated liver enzymes; 12 Hyperglycaemia.
The overall ICU mortality found was 31% (203 patients). Median ICU length of stay was 12 [6–21], with no differences between survivors and deceased patients 12 [6–21] vs 13 [6–20]; p = 0.56.
DiscussionIn this nationwide prospective cohort study in COVID-19 critically ill patients, ageing men with prevalent comorbidities such as hypertension, obesity and diabetes were overrepresented, which is in line with previous reports.3–9 Non-survivors were often sicker as shown by the APACHE II, and SOFA scores, and baseline oxygenation parameters, as well as by the higher use of mechanical ventilation. However, on multivariable analysis using data collected at baseline, only age, and APACHE II remained as predictors of ICU mortality, thus making baseline prediction of mortality difficult. Indeed, a significant number of patients who received mechanical ventilation could be successfully discharged from ICU after two weeks of admission. Overall ICU mortality was 31%, which is similar to reports of non-COVID-19 ARDS.12
A wide array of complications was recorded. AKI stage II or III was among the commonest, being diagnosed in 1 out of 3 patients, and it was associated with a higher risk of mortality. 50% of patients presenting with this complication died in the ICU, a value that rose to 70% when renal replacement techniques were needed. In multivariable analysis, AKI stage II-III conferred an odds ratio for ICU mortality of 1.9. Considering prediction of mortality at baseline was poor, and that this complication often appeared early, AKI could represent a step-up for realistically characterizing the expected clinical picture of an individual COVID-19 patient. Cardiac complications had a similar prevalence than in previous studies, without differences between groups.3,9 Moreover, pulmonary embolism, although frequent did not increase the risk of death. Pulmonary embolism is a difficult complication to confirm since radiology is needed. Whether the latter underestimated the incidence in the most severe cases is unknown. Indeed, non-survivors were anticoagulated twofold more often, a fact that might have been triggered by higher levels of d-dimer in this subgroup. However, neither baseline nor maximal d-dimer independently predicted mortality in this cohort, a finding that is differential from previous studies. Our results reinforce the need to better characterize this phenomenon and to properly address the effect of using prophylactic therapeutic anticoagulation in the sickest patients, which was common in our cohort of patients, a strategy not devoid of potential complications. Although bleeding rate was not significantly different between groups, our methodology does not allow us to answer whether this strategy could be considered safe or effective in this population. Finally, 26% of patients were diagnosed with a respiratory super-infection and 25% with a bloodstream infection, both prevailing in non-survivors. When these complications further evolved into septic shock, the odds of mortality were threefold higher.
For laboratory markers, only maximal procalcitonin level and platelet count were predictive of mortality in multivariate analysis. Maximal interleukin-6 levels were higher in non-survivors; but peak values were far away from those described in the cytokine storm syndrome,13 an entity that some researchers have used to advocate for the use of anti-inflammatory treatment.14,15 In this line, ferritin levels were also much lower than those previously reported in severe forms of hemophagocytic lymphohistiocytosis (HLH) suggesting these two processes do not play a significant role in the outcome of COVID-19 patients.16 Despite this, both groups received often pharmacological treatment, and steroids were given to 3 out of 4 patients, and tocilizumab to roughly 40%, with no differences between groups. In our opinion, this is of high concern given the paucity of data about the efficacy and safety of these treatments.
This study has several strengths. First, this multicentre study provided a highly detailed description of the clinical picture in COVID-19 ICU patients, after including 663 patients with complete outcome data. Second, to the best of our knowledge this is the first study that prospectively explores the association between ICU features at admission and ICU mortality, and the association of the ICU clinical course to the risk of death. However, we acknowledge some limitations. First, observational studies, especially when multicentre in nature, are prone to induce errors while collecting data. For this reason, a concise manual was provided to all the researchers at the beginning of the study. Also, two investigators checked for the accuracy of the data and disregarded occasional unreliable values. Second, it is plausible that due to the burden of care experienced by participating clinicians during the study period, some of the patients admitted to the ICU were not included in the database. However, due to the nature of the registry, we consider that a selection bias was not favoured. Third, at the time of this analysis, as this information was not initially collected, we had no data on the different pharmacological treatments administered before ICU admission. Finally, at the time of the analysis 297 (30%) patients did not have a definitive outcome regarding ICU discharge or death and therefore were not included in the analysis.
ConclusionsCOVID-19 critically ill patients often present with an acute respiratory failure with high ICU mortality, which is similar to other non-COVID ARDS cases. Acute kidney injury and septic shock are common and confer an increased risk of mortality.
Ethics approval and consent to participateThe study was approved by the Ethics Committee of Euskadi, Spain. The need for written informed consent from participants was considered by each participating center.
Consent for publicationNot applicable.
Availability of data and materialsThe datasets used and/or analyzed during the current study are available from the corresponding author on reasonable request.
Competing interestThe authors declare that they have no competing interests.
FundingLa colaboración de un escritor médico ha sido financiada por Merck Sharp & Dohme España, S.A. Merck and Sharp no ha participado en el diseño, la elaboración, el análisis y las conclusiones del estudio.
Conflicto de interesesCarlos Ferrando, César Aldecoa, Fernando Ramasco, Emilio Maseda, Gonzalo Tamayo son miembros del Comité Editorial de la REDAR. Ninguno de los autores ha intervenido en el proceso de revisión del manuscrito.
Authors’ contributionsR M-A participated in the research question and was the responsible for drafting the manuscript.
CA, participated in the research question, contributed to data analysis, and corrected the manuscript.
AG was the responsible of the data analysis and corrected the final manuscript.
EA was the responsible of the design of the dataset, participated in the research question and corrected the manuscript.
CF and MH participated in generating the research question, contributed to data analysis and corrected the manuscript. He had full access to all the data in the study and takes responsibility for the integrity of the data and the accuracy of the data analysis.
COVID-19 Spanish ICU Network
Hospital Clínic de Barcelona, Department of Anesthesiology and Critical Care: Marina Vendrell, Gerard Sánchez-Etayo, Amalia Alcón, Isabel Belda, Mercé Agustí, Albert Carramiñana, Isabel Gracia, Miriam Panzeri, Irene León, Jaume Balust, Ricard Navarro, María José Arguís, Maria José Carretero, Cristina Ibáñez, Juan Perdomo, Antonio López, Manuel López-Baamonde, Tomás Cuñat, Marta Ubré, Antonio Ojeda, Andrea Calvo, Eva Rivas, Paola Hurtado, Roger Pujol, Nuria Martín, Javier Tercero, Pepe Sanahuja, Marta Magaldi, Miquel Coca, Elena del Rio, Julia Martínez-Ocon, Paula Masgoret, Angel Caballero, Raquel Risco, Lidia Gómez, Nicolas de Riva, Ana Ruiz, Beatriz, Tena, Sebastián Jaramillo, Jose María Balibrea, Francisco Borja de Lacy, Ana Otero, Ainitze Ibarzabal, Raquel Bravo, Anna Carreras, Daniel Martín-Barreda, Alfonso Jesús Alias, Mariano Balaguer, Jorge Aliaga, Alex Almuedo, Joan Ramón Alonso, Rut Andrea, Gerard Sergi Angelès, Marilyn Arias, Fátima Aziz, Joan Ramon Badía, Enric Barbeta, Toni Torres, Guillem Batiste, Pau Benet, Xavi Borrat, María Borrell, Ernest Bragulat, Inmaculada Carmona, Manuel Castellà, Pedro Castro, Joan Ceravalls, Oscar Comino, Claudia Cucciniello, Clàudia De Deray, Oriol De Diego, Paula De la Matta, Marta Farrero, Javier Fernández, Sara Fernández, Anna Fernández, Miquel Ferrer, Ana Fervienza, María Tallo Forga, Daniel Forné, Clàudia Galán, Andrea Gomez, Eduard Guasch, Maria Hernández- Tejero, Adriana Jacas, Beltrán Jiménez, Pere Leyes, Teresa López, José Antonio Martínez, Graciela Martínez-Pallí, Jordi Mercadal, Guido Muñoz, Jose Muñoz, Ricard Navarro, Josep Maria Nicolás, José Tomás Ortiz, Anna Peiró, Manuel Pérez, Esteban Poch, Margarida Pujol, Eduard Quintana, Bartomeu Ramis, Enric Reverter, Irene Rovira, Pablo Ruiz, Elena Sandoval, Stefan Schneider, Oriol Sibila, Carla Solé, Alex Soriano, Dolors Soy, M. Suárez, Adrián Téllez, Néstor David Toapanta, Antoni Torres, Xavier Urra. Hospital Universitario Río Hortega: César Aldecoa, Alicia Bordell, Silvia Martín, Judith Andres. Hospital Universitario Cruces: Alberto Martínez Ruiz, Gonzalo Tamayo Medel, Iñaki Bilbao Villasante, Fernando Iturri Clavero, Covadonga Peralta Álvarez, Julia T. Herrera, Andrea García Trancho, Iñaki Sainz Mandiola, Carmen Ruano Suarez, Angela Ruiz Bocos, Eneritz Urrutia Izagirre, Pablo Ortiz de Urbina Fernández, Naiara Apodaka, Leire Prieto Molano, Julia T. Herrera, Eunate Ganuza, Iratxe Vallinas, Karmele de Orte, Celia González Paniagua, Gemma Ortiz, Rosa Gutierrez, Mireia Pérez, Marta López, Estíbaliz Bárcena, Erik Urutxurtu, Maria Jesús Maroño, Blanca Escontrela. Hospital del Mar: Ramón Adalia, Luigi Zattera, Irina Adalid Hernandez, Leire Larrañaga Altuna, Aina Serrallonga Castells, Adriana Vilchez Garcia, María Núñez, Lorena Román. Hospital General Universitario De Ciudad Real: Francisco Javier Redondo Calvo, Ruben Villazala González, Victor Baladron González. Complejo Asistencial Universitario León: Sergio Marcos Contreras, Alejandro Garcia Rodríguez, Saleta Rey Vázquez, Cristina Garcia Pérez, Eva Higuera Miguelez, Irene Pérez Blanco, David García Rivera. Hospital Urduliz: Ane Martín de la Fuente, Marta Pardo, Vanessa Rodriguez, Unai Bengoetxea. Hospital Universitario de la Princesa: Fernando Ramasco, Sheila Olga Santidrián Bernal, Alvar Santa Cruz Hernando. Hospital Povisa: Beatriz Domínguez, Ana Vázquez Lima. Hospital Ramón y Cajal: Ángel Candela, Ismael A Acevedo Bambaren, Maria Isabel Albala Blanco, Paloma Alonso Montoiro, Fernando Álvarez Utrera, Juan Avellanosa Esteruelas, Amal Azzam López, Alberto José Balvis Balvis, María Beltrán Martín, Jacobo Benatar Haserfaty, Alberto Berruezo Camacho, Laura Betolaza Weimer, Maria del Mar Carbonell Soto, Cristina Carrasco Seral, Cristina Cerro Zaballos, Elizabeth Claros Llamas, Pilar Coleta Orduna, Ingrid P. Cortes Forero, Pascual Agustín Crespo Aliseda, María Angélica de Pablo Pajares, Yolanda Díez Remesal, Trinidad Dorado Díaz, Noemí Echevarría Blasco, María Elena Elías Martín, Javier Felices Triviño, Natalia Fernández López, Cristina Fernández Martín, Natalia Ferreiro Pozuelo, Luis Gajate Martín, Clara Gallego Santos, Diego Gil Mayo, María Gómez Rojo, Claudia González Cibrián, Elena Herrera López, Borja Hinojal Olmedillo, Berta Iglesias Gallego, Sassan Khonsari, María Nuria Mane Ruiz, María Manzanero Arroyo, Ana María Mariscal Ortega, Sara Martín Burcio, María del Carmen Martín González, Ascensión Martín Grande, Jose Juan Martín López, Cecilia Martín Rabes, Marcos Martínez Borja, Nilda Martínez Castro, Adolfo Martínez Pérez, Snejana Matcan, Cristina Medrano Viñas, Lisset Miguel Herrera, Adrián Mira Betancur, María Montiel Carbajo, Javier Moya Moradas, Lorena Muñoz Pérez, Mónica Nuñez Murias, Eva Ordiales González, Óscar Ordoñez Recio, Miguel Ángel Palomero Rodriguez, Diego Parise Roux, Lucia Pereira Torres, David Pestaña Lagunas, Juana María Pinto Corraliza, Marian Prieto Rodrigo, Inmaculada Rodriguez Diaz-Regaño, David Rodriguez Esteban, Víctor Rojas Pernia, Álvaro Ruigómez Saiz, Bárbara Saavedra Villarino, Noemí Samaranch Palero, Gloria Santos Pérez, Jaume Serna Pérez, Ana Belén Serrano Romero, Jesús Tercero López, Carlos Tiscar García, Marta de la Torre Concostrina, Eva María Ureta Mesa, Eva Velasco Olarte, Judith Villahoz Martínez, Raúl Villalaba Palacios, Gema Villanueva García, Cristina Vogel de Medeiros. Hospital Universitario Severo Ochoa: Sheila Gholamian Ovejero, Marta Vicente Orgaz, Patricia Lloreda Herradon, Cristina Crespo Gómez. Hospital Universitario de Gran Canaria Dr. Negrín: Tatiana Sarmiento-Trujillo. Hospital de Terrassa: Noemí García Medina, María Martínez García, Carles Espinós Ramírez, Nabil Mouhaffel Rivero, Jose Antonio Bernia Gil. Hospital Central de la Cruz Roja San José y Santa Adela: Sonsoles Martín. Hospital de la Santa Creu i Sant Pau: María Victoria Moral, Josefina Galán, Pilar Paniagua, Sergio Pérez, Albert Bainac, Ana Arias, Elsa Ramil, Jorge Escudero. Hospital Clínica Universidad de Navarra: Pablo Monedero, Carmen Cara, Andrea Lara, E. Mendez Martínez, Jorge Mendoza, Íñigo Rubio Baines. Medicina Preventiva y Salud Pública: Alfredo Gea, Alejandro Montero. Hospital Universitario Dr. Peset Aleixandre: Rocío Armero. Hospital Universitario de Cáceres: Fernando García Montoto. Hospital Clínico Universitario de Valencia: José Antonio Carbonell, Berta Monleón López, Sara Martínez-Castro, Gerardo Aguilar. Hospital Universitario a Coruña: María Gestal, Pablo Casas, Angel Outeiro Rosato, Andrea Naveiro Pan, María Alonso Portela, Adrián García Romar, Eva Mosquera Rodríguez, Diego Ruanova Seijo, Pablo Rama Maceiras. Complexo Universitario de Ferrol: Francisco Castro-Ceoane, Esther Moreno López. Hospital Clínico Universitario Lozano Blesa: Sergio Gil, Julia Guillén Antón, Patricia García-Consuegra Tirado, Aurora Callau Calvo, Laura Forés Lisbona, María Carbonell Romero, Belén Albericio Gil, Laura Pradal Jarne, María Soria Lozano, Diego Loscos López, Andrea Patiño Abarca. Universal Doctors: Jordi Serrano. UBIKARE: Javier Pérez-Asenjo, Ángel Díez-Domínguez, Ion Zubizarreta, Jon Ramos, Iosu Fernández. Hospital Universitario La Paz: Emilio Maseda. Hospital Universitario Gregorio Marañon: Ignacio Garutti. Hospital San Joan Despí Moises Broggi: Eva Bassas Parga, Carmen Deiros Garcia, Elisenda Pujol Rosa, Ana Tejedor Navarro, Roser Font Gabernet, Maria José Bernat, Meritxell Serra Valls, Cristina Cobaleda Garcia-Bernalt, Jesus Fernanz Anton, Adriana Aponte Sierra, Lucia Gil Gomez, Olaia Guenaga Vaqueiro, Susana Hernandez Marin, Laura Pardo Pinzon, Sira Garcia Aranda, Carlos Briones Orejuela, Edgar Cortes Sanchez, Alejandro Romero Fernandez, Esther Fernández Sanjosé, Patricia Iglesias Garsabal, Guillermo Isidro Lopez, Ana Vicol, Sara Espejo Malagon, Maria Sanabra Loewe, Laura Grau Torradeflo, Lourdes Blanco Alcaide, Gloria Buenaventura Sanclemente, Pere Serra Pujol, Gustavo Cuadros Mendoza, Miroslawa Konarska, Fedra Bachs Almenara, Agnieszka Golska, Aleix Carmona Blesa, Beatriz Cancio Rodriguez, Raquel Peredo Hernandez Arantxa Mas Serra. Hospital Universitario Infanta Leonor: Javier Ripolles Melchor, Ana Nieto Moreno, Káteri Chao Novo, Sandra Gadín López, Elena Nieto Moreno, Bérénice Gutiérrez Tonal, Elena Lucena de Pablo, Barbara Algar Yañez, Beatriz Vázquez Rivero, Beatriz Nozal Mateo, Marina de Retes, Norma Aracil Escoda, Cristina Gallardo Mayo, Rosa Sanz González, Alicia Ruiz Escobar, Maria Laura Pelegrina López, Marina Valenzuela Peña, David Stolle Dueñas, Ane Abad Motos, Alfredo Abad-Gurumeta, Ana Tirado Errazquin, Elena Sáez Ruiz, Nerea Gómez Perez, Francisco de Borja Bau González. Hospital sanitas CIMA: Cesar Morcillo Serra. Hospital Universitario y Politécnico La Fé: Rosario Vicente, Raquel Ferrandis, Silvia Polo Martín, Azucena Pajares Moncho, Ignacio Moreno Puigdollers, Juan Pérez Artacho Cortés, Ana Moret Calvo, Ana Pi Peña, María Catalán Fernández. Complexo hospitalario Universitario de Pontevedra: Marina Varela. Hospital Arnau de Vilanova: María Isabel Forés Chiva. Hospital General de Alicante: A. Javier Agulló. Hospital Universitario Infanta Sofía: Antonio Pérez Ferrer. Hospital Universitario San Juan de Alicante: Maria Galiana. Hospital Nuestra Señora de Meritxell SAAS: Antoni Margarit, Válerie Mourre del Rio, Eva Heras Muxella, Anna Vidal.
The following are Supplementary data to this article:
articles

www.publicationethics.org.