


Low birth weight is defined as the infant weighing less than 2500g; its origins are multifactorial and its prevalence at the global and national levels is between 4.8% and 9% respectively. Lack of social support has been emphasised as one of the risk factors that may have a high correlation with the occurrence of low birth weight.
ObjectiveTo determine the relationship between the absence of social support during pregnancy and low birth weight.
MethodsCase–control study in a population of 420 selected mothers in a tertiary hospital from November 2015 to July 2017. In these mothers, an instrument was applied that included sociodemographic variables and validated scales that evaluate social support and coping strategies. For the data analysis, logistic, psychological, biological and social regression models were developed, with variables for a history of vaginosis, living in rural areas, nulliparity, and inadequate social support; which were identified as having the greatest relationship with low birth weight.
ResultsIn the final logistic regression model we found that the absence of social support increases the chance of low birth weight by 3.59 fold (OR=4.59; 95% CI, 2.27–9.27; p<0.01). Another significant variable was nulliparity.
ConclusionsThe findings support the hypothesis that the absence of adequate social support during gestation is related to low birth weight.
El bajo peso al nacer se define cuando el neonato pesa menos de 2.500g; sus orígenes son multifactoriales y sus prevalencias mundial y nacional son del 4,8 y el 9% respectivamente. Se destaca la falta de apoyo social como uno de los factores de riesgo que puede tener gran relación con el bajo peso al nacer.
ObjetivoDeterminar la relación entre la ausencia de apoyo social durante el embarazo y el bajo peso al nacer.
MétodosEstudio de casos y controles en una población de 420 madres seleccionadas en un hospital de alta complejidad durante el periodo de noviembre 2015 a julio 2017. Se aplicó a estas madres un instrumento que incluía variables sociodemográficas y escalas validadas que evalúan apoyo social y estrategias de afrontamiento. Para el análisis de los datos, se desarrollaron modelos de regresión logística, psicológico, biológico y social, con las variables antecedente de vaginosis, vivir en área rural, nuliparidad y apoyo social no adecuado, que se identificaron como las que tienen mayor relación con el bajo peso al nacer.
ResultadosEn el modelo final de regresión logística, se encontró que la ausencia de apoyo social aumenta la oportunidad de bajo peso al nacer en 3,59 veces (OR=4,59; IC95%, 2,27-9,27; p<0,01). Otra variable significativa es la nuliparidad.
ConclusionesLos hallazgos respaldan la hipótesis de que la ausencia de apoyo social adecuado durante la gestación está relacionada con el bajo peso al nacer.
According to the World Health Organization (WHO), low birth weight is defined as less than 2500g; prematurity and intrauterine growth restriction (IUGR) are its main origins.1 It is one of the main causes of childhood morbidity and mortality and of morbidity in adult life.2,3 Its prevalence varies according to the regions: Australia (4.8%), Canada (5.5%), United Kingdom (6.0%) and United States (5.8%)4; in Latin America it is 9.26% and Colombia presents a similar picture (9%).3 In a tertiary institution (Hospital Universitario San José [HUSJ]), prevalences of 15–17% were found (as revealed by the unpublished observations of Dr Ortiz R. in the Boletin epidemilogico obstetricia y ginecologia [Obstetrics and Gynaecology Epidemiological Bulletin] of the Hospital Universitario San Jose, 2013).
Neonates with low birth weight have a 40-fold greater risk of dying in the neonatal period than those which weigh more than 2500g, and the risk increases 200-fold in those weighing less than 1500g.5 Although the neonatal mortality rate has reduced in the last five years, low birth weight is a significant worldwide problem. It is one of the main causes of childhood morbidity and mortality,6–10 as, along with prematurity, it causes one million neonatal deaths per year.11,12 It is also associated with higher short-term morbidity, such as neonatal sepsis, birth asphyxia, thermal instability, respiratory distress, infections, apnoeas, metabolic disorders, seizures, jaundice, kernicterus, difficulty breast-feeding, necrotising enterocolitis and periventricular leukomalacia, and higher rates of re-hospitalisation.13–15 Around 25% of neonates weighing less than 1000g have a disability. Goldenberg et al.16 show that neonates weighing less than 900g who survive have a higher incidence of infantile cerebral palsy, by demonstrating that there is an inverse relationship according to weight, with prevalences of 250, 30, 20 and 10/1000 live births with a birth weight of 600, 1000, 1500 and 2000g, respectively. Studies also indicate an increase in the prevalence of medical disorders in adult life, such as cardiovascular diseases, diabetes, metabolic syndrome, visual and hearing alterations and attention deficit, as the gestational age and, therefore, the birth weight reduces.2,6,9,17–19
The causes of low birth weight are multifactorial: history of low birth weight, infections (asymptomatic bacteriuria, vaginosis, TORCH complex and periodontitis, among others), maternal age of younger than 18 or older than 35, smoking,20 alcohol consumption, nulliparity or multiparity, birth interval of less than one year, low preconception weight and low education level.21 It is important to understand not only the multiple causes of low birth weight, but also the environmental interaction and genetic variability of these factors.2 Low birth weight has implications not only of a social and family nature, but also a financial nature. It is estimated that the annual expenditure for the care of preterm births with low birth weight in the United States is around 25 billion dollars, mostly due to care in intensive care units11; other studies show that care in rehabilitation per neonate is 6500 dollars yearly.22 Several studies show that pregnant women with adequate social support, even with biological and psychological risk factors, such as stress, depression and smoking, have a lower risk of preterm birth and low birth weight.21,23–33 Psychosocial risk factors, in particular stress, quality of life and family dysfunction, are proven risk factors of low birth weight, and social support, as a modifier of adverse events during pregnancy, can reduce the risk of adverse neonatal complications, as it acts by reducing the impact of life events on the generation of response to stress, both in its biological and psychological component.21,26–29,32–37
The evidence supports the hypothesis of giving support networks the role of protective factor in order to prevent low birth weight and other birth outcomes. To translate these findings to public health and clinical practice, it is essential to identify which subgroups of women can be especially susceptible to the potentially harmful effects of the lack of social support, as well as in which circumstances this lack of support may lead to greater complications for the pregnant women. Our setting does not escape the problem of low birth weight, which is why it is relevant and necessary to conduct studies which make it possible to evaluate and characterise the social support networks, taking into account that our population has differences from the contextual and individual point of view. In view of the above, this investigation was proposed with the objective of determining the relationship between the absence of social support during pregnancy and low birth weight.
MethodsBy means of a case–control study it was sought to determine the relationship between the absence of social support during pregnancy and low birth weight. This study was performed in a tertiary hospital (HUSJ), reference centre of the department of Cauca and south west Colombia, which treats the population with a contributory and subsidised insurance scheme in the country's current social security system, during the period from November 2015 to July 2017. A case was defined as any woman in the post-natal period who gave birth through a vaginal delivery or caesarean section to a single live baby weighing less than 2500g. The mothers of neonates with birth defects, of multiple pregnancies or stillborn, and those with a mental disorder (due to the difficulty in conducting the interview and the inconvenience of obtaining logical information and generating inconsistent information), and those who did not agree to be included in the study, were excluded. Mothers who had been in the post-natal period for less than 48h, whose neonate weighed 2500g or more, a single live baby and with no birth defects were included as controls. For the size of the sample, the following were taken into account: α=0.05; β=0.20; rate of exposure of the controls to an inadequate support network during pregnancy of 10% according to a local study38; and an odds ratio (OR) corresponding to the minimum increase of the OR of interest of 2.5, based on previous studies.27,30,38 To improve the robustness of the study, a ratio of three controls per case was taken. A sample size of 105 cases and 315 controls was obtained. The measurement of social support was performed by means of the MOS questionnaire (evaluates social support), developed by Sherbourne et al.39–41 in 1991, which has four domains with minimum and maximum scores: 8–40 for emotional support, 4–20 for instrumental support, 4–20 for positive social interaction and 3–15 for affective support. In the evaluation, the gross score was taken (the sum of the four domains), for which the total score ranges from 19 to 95. High scores are perceived as greater support; for this study, these cut-off points were taken both for the total and for each one of the domains, according to what has been done in previous studies, below which they were classified with deficient social support.42 Social variables—area of residence, marital status, education level, ethnic group, occupation, insurance, socioeconomic status and household income, preconception care, family planning, adequate prenatal care (number of controls ≥4 and gestational age from start of the check-up in the first trimester) and attendance of a psychoprophylactic course—; psychological variables—alcohol consumption, exposure to cigarette smoke, coping strategies (evaluated with the Brief COPE 28-item questionnaire43–46), use of psychoactive substances and planning of the current pregnancy—and biological factors—age, obstetric formula, preconception weight, history of preterm birth, history of low birth weight and infections during pregnancy (vaginosis, urinary infection)—were also measured. Before starting the data collection process, the interviewers were trained with the aim of standardising the information and controlling information biases. Once the case and control had been identified, the objective and the procedures of the investigation were explained to them; if the mothers agreed to participate, the respective scales and questionnaires were applied to them. Quality control of the data was performed, a database was created and the analysis of information was performed with the STATA program version 10.0.
Analytical planThe variables of interest were analysed individually from the exploratory point of view to check the normality of their distribution. Extreme values and missing values that could have an impact on the result were identified, the population subject to study was described according to the social, psychological and biological characteristics; the distributions of the characteristics of interest were compared between the cases and controls using the statistical tests χ2 and the Fisher's exact test, as appropriate. For the continuous variables with normal distribution, such as age, the Student's t-test was used, following an analysis of variance. For variables with non-normal distribution, the Mann–Whitney U test was used, following application of the Shapiro–Wilk normality test. To determine the possible relationships between some explanatory variables of the event, the strength of association (OR) was determined between these variables with their 95% confidence interval (95% CI).
Based on the findings of the bivariate analysis, three multivariate models (biological, psychological and social) models and one final model were described. To select the variables to be included in each one of the models and in the final model, the stepwise procedure was used with a likelihood of entry of 0.2 and of exit of 0.15. In addition to the statistical criterion for the selection of variables, the theoretical criterion was also considered, the area under the curve was generated for the final model, co-linearity was evaluated and finally a diagnosis was performed of the final model with the Hosmer–Lemeshow (HL) statistic. The continuous variables were categorised to introduce them into different models: age was categorised as a reference group of 19–34 years and risk categories ≤18 and ≥35 years.47,48 For preconception weight, the reference group was taken to be more than 45kg, and the risk category was considered to be less than 45kg. For education, the cut-off point of nine years was taken, as, according to previous studies, those of fewer school years are those at risk.48 For other variables such as race, it was assumed that the black and indigenous races are those most predisposed to discrimination, which is why a single category was created for them, and, as a reference, a category for white and mixed-race women was created. With regard to status, the classification of Sisbén was taken; levels 1 and 2 were taken to be low, and levels 3 and 4 were taken as a reference.
This study is regulated by the current international bioethical standards, such as the Nuremberg Code, the Declaration of Helsinki and the Belmont Report; likewise, it is regulated by the standards of the Colombian Civil Code, in article 1502, law 23 of 1981, degree 3380 of 1981 and resolution 8430 of 1993 of the Ministry of Health. Patients who agreed to participate voluntarily in the study signed the informed consent, and the ethical endorsement was obtained from HUSJ of Popayán and from the Universidad del Cauca for its conduct.
ResultsThis study was carried out from November 2015 to July 2017; there were no rejections or losses; the mean age was 26.29±7.11 years; average education was 9±3.11 years; 71.19% identified themselves as white/mixed race and 28.81% as indigenous and black race; 55.95% were from a rural area; 87.6% belonged to a low socioeconomic level (status 1 and 2); 79.76% belonged to the subsidised scheme; 44.52% receive less than one current legal minimum wage (CLMW), and 87.86% stated that they did not have a stable partner (single, widowed).
Table 1 describes the general characteristics of the population according to whether it was case or control. With regard to the baseline variables of the study population, significant differences were found between the groups: nulliparity and history of caesarean section (p<0.05). With regard to having given birth to children or not, 39.05% of the cases were nulliparous, versus 26.03% of the controls, with a statistically significant difference; regarding the history of caesarean section, 60.9% of the cases underwent it, compared to 47% of the controls. Regarding social support, 20.00% of the cases reported less social support, compared to 5.40% of the controls (p<0.05). In terms of coping strategies, they were similar in both groups; the control group indicated on a more frequent basis that they had planned the pregnancy. With regard to the social category, variables such as prenatal care, family planning and preconception consultation were classified as adequate, with greater frequency in the controls, while attending psychoprophylactic courses was more common in the cases, although with no statistical significance. In the variables race, partner stability and insurance, no significant differences were found. Rural residence, low socioeconomic status and low income were more common in the case group, although with no statistical significance.
Biological, psychological and social characteristics of the study population.
| Characteristics | Low birth weight (cases)(n=105) | Adequate birth weight (controls)(n=315) | p |
|---|---|---|---|
| Age (years) | 26.49±7.43 | 26.22±7.01 | 0.73a |
| Births | |||
| Nulliparous | 41 (39.05) | 82 (26.03) | 0.01b |
| At least one birth | 64 (60.95) | 233 (73.97) | |
| Caesarean section | |||
| Caesarean section | 64 (60.95) | 150 (47.62) | 0.01b |
| No Caesarean section | 41 (39.05) | 165 (52.38) | |
| Urinary infection in this pregnancy | 42 (40.00) | 137 (43.49) | 0.53b |
| Vaginosis in this pregnancy | 44 (41.90) | 109 (34.60) | 0.17b |
| Preconception weight <45kg | 14 (13.33) | 25 (7.94) | 0.09b |
| Alcohol consumption | 11 (10.48) | 32 (10.16) | 0.92b |
| Cigarette consumption | 0 | 4 (1.27) | N/A |
| Passive exposure to cigarette smoke | 16 (15.24) | 44 (13.97) | 0.74b |
| Psychoactive substances | 0 | 2 (0.63) | N/A |
| Coping strategies | 42 | 44 | 0.14c |
| Social support in general <57 | 21 (20.00) | 17 (5.40) | <0.01b |
| Inadequate social-emotional support | 21 (20.00) | 20 (6.35) | <0.01b |
| Inadequate social support, instrumental | 19 (18.10) | 17 (5.40) | <0.01b |
| Inadequate social support, social dimension | 17 (16.19) | 8 (2.54) | <0.01b |
| Inadequate social support, affective dimension | 14 (13.33) | 9 (2.86) | <0.01b |
| Without planning and trying to get pregnant | 75 (71.43) | 205 (65.08) | 0.23b |
| Without family planning before this pregnancy | 70 (66.67) | 190 (60.32) | 0.24b |
| Without preconception care | 96 (91.43) | 276 (87.62) | 0.28b |
| Inadequate prenatal care | 40 (38.10) | 104 (33.02) | 0.34b |
| Absence of psychoprophylactic course | 84 (80.00) | 259 (82.22) | 0.61b |
| Race | |||
| White/mixed | 71 (67.62) | 228 (72.38) | 0.35b |
| Indigenous/black | 34 (32.38) | 87 (27.62) | |
| Education level (years) | 9.00±4.10 | 9.48±3.79 | 0.27a |
| Area of residence | |||
| Urban | 38 (36.19) | 147 (46.67) | 0.061b |
| Rural | 67 (63.81) | 168 (53.33) | |
| Non-stable partner | 89 (84.76) | 280 (88.89) | 0.26b |
| Insurance | |||
| Contributory | 24 (22.86) | 61 (19.37) | 0.44b |
| Subsidised | 81 (77.14) | 254 (80.63) | |
| Socio-economic status | |||
| Low | 94 (89.52) | 274 (86.98) | 0.49b |
| Medium | 11 (10.48) | 41 (13.02) | |
| Household income | |||
| <1 CLMW | 51 (48.57) | 136 (43.17) | 0.33b |
| ≥1 CLMW | 54 (51.43) | 179 (56.83) | |
N/A: not applicable; CLMW: current legal minimum wage.
Table 2 shows the OR of the possible explanatory variables. Significant values were found in being nulliparous (OR=1.82; 95% CI, 1.10–2.97; p=0.01), previous caesarean section (OR=1.71; 95% CI, 1.06–2.76; p=0.01), social support generally inadequate (OR=4.38; 95% CI, 2.08–9.24; p<0.01), inadequate emotional social support (OR=3.68; 95% CI, 1.80–7.51; p<0.01), inadequate instrumental social support (OR=3.87; 95% CI, 1.81–8.28; p<0.01), inadequate affective social support (OR=5.23; 95% CI, 2.02–13.10; p<0.01) and inadequate social dimension social support (OR=7.41; 95% CI, 2.89–20.48; p<0.01). The other variables of this analysis were not significant.
Contingency table of possible explanatory variables of low birth weight.
| Possible explanatory variables | Low birth weight (cases)(n=105) | Adequate weight at birth (controls)(n=315) | OR (95% CI) | p |
|---|---|---|---|---|
| Age | ||||
| ≤18 years | 13 (12.38) | 44 (13.97) | 0.90 (0.42–1.83) | 0.77 |
| 19–34 years | 72 (68.57) | 221 (70.16) | ||
| ≥35 years | 20 (19.05) | 50 (15.87) | 1.22 (0.64–2.26) | 0.48 |
| Births | ||||
| Nulliparous | 41 (39.05) | 82 (26.03) | 1.82 (1.10–2.97) | 0.01 |
| At least one birth | 64 (60.95) | 233 (73.97) | ||
| Caesarean section | ||||
| Caesarean section | 64 (60.95) | 150 (47.62) | 1.71 (1.06–2.76) | 0.01 |
| No Caesarean section | 41 (39.05) | 165 (52.38) | ||
| Urinary infection | ||||
| Urinary infection in this pregnancy | 42 (40.00) | 137 (43.49) | 0.86 (0.53–1.38) | 0.53 |
| No urinary infection in this pregnancy | 63 (60.00) | 178 (56.51) | ||
| Vaginosis | ||||
| Vaginosis in this pregnancy | 44 (41.90) | 109 (34.60) | 1.36 (0.84–2.19) | 0.17 |
| No vaginosis in this pregnancy | 61 (58.10) | 206 (65.40) | ||
| Preconception weight | ||||
| ≤45kg | 14 (13.33) | 25 (7.94) | 1.78 (0.81–3.74) | 0.09 |
| >45kg | 91 (86.67) | 290 (92.06) | ||
| Race | ||||
| Black-indigenous | 71 (67.62) | 228 (72.38) | 1.25 (0.75–2.07) | 0.35 |
| Mixed-white | 34 (32.38) | 87 (27.62) | ||
| Passive exposure to cigarette smoke | ||||
| Yes | 16 (15.24) | 44 (13.97) | 1.10 (0.55–2.11) | 0.74 |
| No | 89 (84.76) | 271 (86.03) | ||
| Planning and trying to get pregnant | ||||
| They did not plan it | 75 (71.43) | 205 (65.08) | 1.34 (0.80–2.25) | 0.23 |
| They did plan it | 30 (28.57) | 110 (34.92) | ||
| General social support | ||||
| Inadequate | 21 (20.00) | 17 (5.40) | 4.38 (2.08–9.24) | <0.01 |
| Adequate | 84 (80.00) | 298 (94.60) | ||
| Emotional social support | ||||
| Inadequate | 21 (20.00) | 20 (6.35) | 3.68 (1.80–7.51) | <0.01 |
| Adequate | 84 (80.00) | 295 (93.65) | ||
| Social support, instrumental | ||||
| Inadequate | 19 (18.10) | 17 (5.40) | 3.87 (1.81–8.28) | <0.01 |
| Adequate | 86 (81.90) | 298 (94.60) | ||
| Social support, interaction | ||||
| Inadequate | 17 (16.19) | 8 (2.54) | 7.41 (2.89–20.48) | <0.01 |
| Adequate | 88 (83.81) | 307 (97.46) | ||
| Affective social support | ||||
| Inadequate | 14 (13.33) | 9 (2.86) | 5.23 (2.02–13.10) | <0.01 |
| Adequate | 91 (86.67) | 306 (97.14) | ||
| Preconception care | ||||
| No care | 96 (91.43) | 276 (87.62) | 1.50 (0.68–3.66) | 0.28 |
| Care | 9 (8.57) | 39 (12.38) | ||
| Prenatal care | ||||
| Inadequate | 40 (38.10) | 104 (33.02) | 1.24 (0.76–2.02) | 0.34 |
| Adequate | 65 (61.90) | 64 (23.70) | ||
| Psychoprophylactic course | ||||
| No course | 84 (80.00) | 259 (82.22) | 0.86 (0.48–1.59) | 0.61 |
| Course | 21 (20.00) | 56 (17.78) | ||
| Area of residence | ||||
| Rural | 67 (63.81) | 168 (53.33) | 1.54 (0.95–2.50) | 0.06 |
| Urban | 38 (36.19) | 147 (46.67) | ||
| Stable partner | ||||
| No | 89 (84.76) | 280 (88.89) | 0.69 (0.35–1.41) | 0.26 |
| Yes | 16 (15.24) | 35 (11.11) | ||
| Insurance | ||||
| Subsidised | 81 (77.14) | 254 (80.63) | 0.81 (0.46–1.45) | 0.44 |
| Contributory | 24 (22.86) | 61 (19.37) | ||
| Education level | ||||
| <9 years | 51 (48.57) | 130 (41.27) | 1.34 (0.84–2.14) | 0.19 |
| ≥9 years | 54 (51.43) | 185 (58.73) | ||
| Socioeconomic status | ||||
| Low | 94 (89.52) | 274 (86.98) | 1.27 (0.61–2.87) | 0.49 |
| Medium | 11 (10.48) | 41 (13.02) | ||
| Household income | ||||
| <1 CLMW | 51 (48.57) | 136 (43.17) | 1.24 (0.77–1.98) | 0.33 |
| >1 CLMW | 54 (51.43) | 179 (56.83) | ||
95% CI: 95% confidence interval; CLMW: current legal minimum wage in 2017; OR: odds ratio.
The values are expressed as n (%). Source: Own data.
Table 3 shows the models developed with their respective adjusted OR (ORa). It was found that in the biological model the different variables lost their statistical significance, as the 95% CI crosses the unit. In the psychological model, the absence of adequate social support remains significant (ORa=4.38; 95% CI, 2.21–8.68; p<0.05). No variables with statistical significance were found in the social model.
Low birth weight models.
| OR | ORa (95% CI) | p | |
|---|---|---|---|
| Model 1, biological | |||
| ≤18 years | 0.90 | 1.27 (0.62–2.60) | 0.50 |
| ≥35 years | 1.22 | 1.70 (0.70–4.08) | 0.23 |
| Births | |||
| Nulliparous | 1.82 | 1.59 (0.84–3.01) | 0.14 |
| Caesarean section | |||
| Caesarean section | 1.71 | 1.30 (0.71–2.38) | 0.38 |
| Vaginosis | |||
| Vaginosis | 1.36 | 1.59 (0.84–3.01) | 0.14 |
| Model 2, psychological | |||
| No social support | 4.38 | 4.38 (2.21–8.68) | <0.01 |
| Model 3, social | |||
| Education <9 years | 1.34 | 1.17 (0.73–1.89) | 0.67 |
| Area of residence, rural | 1.54 | 1.45 (0.89–2.36) | 0.13 |
95% CI: 95% confidence interval; OR: odds ratio; ORa: adjusted OR. Source: Own data.
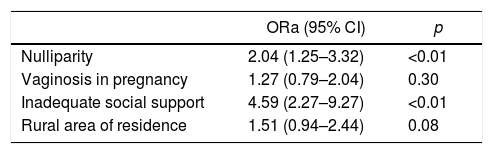
In the final model shown in Table 4, it was found that, after adjusting for the different variables of the proposed models, inadequate social support continued to be significant (ORa=4.59; 95% CI, 2.27–9.27; p<0.05), as well as being nulliparous (ORa=2.04, 95% CI, 1.25–3.32; p<0.05). Living in a rural area showed a tendency to statistical significance (OR=1.51; 95% CI, 0.94–2.44; p=0.08).
Final biopsychosocial model of low birth weight.
| ORa (95% CI) | p | |
|---|---|---|
| Nulliparity | 2.04 (1.25–3.32) | <0.01 |
| Vaginosis in pregnancy | 1.27 (0.79–2.04) | 0.30 |
| Inadequate social support | 4.59 (2.27–9.27) | <0.01 |
| Rural area of residence | 1.51 (0.94–2.44) | 0.08 |
95% CI: 95% confidence interval; ORa: adjusted odds ratio. Source: Own data.
When performing the final evaluation of the model with HL statistics χ2=4.39 (df, 6; p=0.62), it is concluded that it has good adjustment; the area under the curve of the final model was 65.57%, with a sensitivity of 16.19% and a specificity of 97.14%; the final model correctly classifies 76.90% of cases.
DiscussionThis study identified that the absence of social support is a risk factor for low birth weight, which is consistent with other studies. Feldman et al. related social support to foetal growth, highlighted that married women have children with a higher birth weight and, after monitoring by the duration of the pregnancy and obstetric factors, observed that the relationship between social support and low birth weight is maintained; they conclude that social support is an independent predictor of birth weight, but to the same extent as known medical determinants of birth weight.26 Likewise, Elsenbruch et al. described similar results and that the effects of social support on the pregnancy outcomes were greater in women who had smoked during pregnancy; for example, in the size of the child (inadequate versus adequate social support, 51.76±2.31 versus 50.43±2.81cm; F=4.26; p=0.04) and birth weight (3175±453 versus 3571±409g; F=11.35; p=0.001). In the study, they included the variables symptoms of depression and reduced quality of life, and related them to little social support. They also found that, in patients who had smoked during pregnancy, obstetric complications were more common when the social support was not adequate (34 versus 10.3%; RR=3.3; 95% CI, 1.1–10.2; χ2=5.49; p=0.019).34 Other studies differ from ours; in 2001 a cohort study conducted in Chile had an approximation to these results, with the difference that in these findings there was no higher proportion of low birth weight (3.6% in this special group). The associated variables were: absence of planning of the pregnancy in 55.7% of women, consideration of pregnancy as a negative event in 31.8%, death or illness of a close family member (in the six months prior to the interview) in 16.7% and dissatisfaction with the social support in 80.7%. When they took the birth weight as a result variable, the incorporation of these psychosocial variables improved the predictive power of the model by 21.7%.33 Although the results of this investigation differ from our study in the planning of pregnancy as a protective factor, it is clear that adequate social support results in outcomes such as reduced low birth weight. In 2010, the Cochrane group performed a meta-analysis of 17 randomised studies with the main objective of evaluating the effects of additional social support programmes, in comparison with routine care, for pregnant women at high risk of giving birth to premature babies or babies weighing less than 2500g or both. Programmes with additional support for pregnant women at risk were not associated with improvements in the perinatal outcome, but they were associated with a reduced likelihood of prenatal hospitalisation (three trials, n=737; RR=0.79; 95% CI, 0.68–0.92) and caesarean section (nine trials, n=4522; RR=0.87; 95% CI, 0.78–0.97).32 A more recent prospective cohort study (June 2012–February 2013) by Wado et al. is consistent with this study; among the psychological variables they ruled out the incidence of unwanted pregnancy (28.4%), antenatal depression (26.2%) and little social support (22.4%) and they related it to low birth weight (17.9%). The birth weight of neonates from unwanted pregnancies was 114g less than those from wanted pregnancies, and the average birth weight of babies from women with symptoms of depression was 116g less than children from women without symptoms during pregnancy. They concluded that social support plays a mediating role between symptoms of depression and low birth weight, but not between the intention of pregnancy and low birth weight.21 Although it was not a finding in this study, the mediating effect of social support between depression in pregnancy and low birth weight is an integral therapeutic target of the pregnant woman with depression and should be included in social support strategies.
Although in this study a significant association between variables such as having a stable partner or not with the weight of the neonate was not established, nor was exposure to cigarette smoke established as a risk factor, it is clear that the absence of social support is a psychological determinant in the weight of neonates, as it acts by reducing the impact of life events. This can be explained by the generation of the neuro-immune-endocrine response, whose pathophysiological base is from knowledge of the relationship that exists between the neuroendocrine system and the immune system in the modulatory effect of the responses to the environmental factors surrounding a human being. This is how support would be given to the fact that the most vulnerable populations from the social and psychological point of view have greater incidence of low birth weight as an expression of imbalance of these factors.
The strengths of the study include that the sample size was met, there were no losses or rejections, the scales and questionnaires used are validated in Spanish with good psychometric properties and the measurement of the exposure was performed in a similar way in both groups. In order to avoid memory bias, high-risk pregnant women were chosen as controls, and the hypothesis evaluated was not revealed to them. As it was not possible to mask the condition of case or control, procedures were implemented to minimise the probability of information biases occurring: training of the interviewers, monitoring of data collection activities and standardisation of protocols. Among the limitations, there is a probable selection bias, as most of the population is from low statuses and lives in rural areas, meaning that there is a greater risk of absence of social support for this reason; however, two populations are comparable with respect to this variable and they were selected from populations of defined reference.
In the end, it can be concluded that the absence of adequate social support during pregnancy is related to low birth weight. To translate these findings to public health and clinical practice, the subgroup of women who may be especially susceptible to the potentially harmful effects of lack of social support, and in which circumstances this lack of support may lead to greater complications for the pregnant woman and the neonate have been identified. Therefore, pregnant women in their first pregnancy, who have undergone a previous caesarean section, with a history of vaginosis in pregnancy, with inadequate social support, of low socioeconomic status, education level <9 years and from a rural area should be the target of special attention in prenatal care check-ups. With these findings it is possible to reformulate policies and restructure the functioning of the prenatal care check-up programmes for pregnant women, with activities refocused on the strengthening of psychosocial interventions, which are an important component for the generation of knowledge, planning, development and adjustment of the clinical guideline for management of the prenatal check-up of the Ministry of Social Protection and of the institution in which the study was conducted, as well as offering a benchmark to other institutions and cities of Colombia and Latin America with similar characteristics in terms of the prevalence of the condition, the profile of pregnant women and the structure for the provision of health services. This study provides a considerable contribution to the knowledge of the causal factors of low birth weight and, in particular, of its modifiable risk factors. It is important that, based on the evidence, work is continued on intervention models with adequate social support to minimise low birth weight.
Conflicts of interestThe authors have no conflicts of interest to declare.
To the Hospital Universitario San José, the Gynaecology and Obstetrics Department, the departments of Social Medicine and Family Health and of Gynaecology and Obstetrics and to the mothers and children who participated in this study.
Please cite this article as: Paredes Mondragón CV, Molano Dorado H, Martínez Gómez SY, Ortiz Martínez RA, Arias Linthon S, López Benavides AC. Relación entre la ausencia de soporte social adecuado durante el embarazo y el bajo peso al nacer. Rev Colomb Psiquiat. 2019;48:140–148.
